Bowling Green, MO (Missouri) Houses and Residents
| Bowling Green: | $117,922 |
| Missouri: | $221,200 |
Mean price in 2022:
Detached houses: $112,283
Here: $112,283 State: $278,068 Mobile homes: $164,728
Here: $164,728 State: $95,912
Total population: 5,505 (Urban population: 3,241 (all inside urban clusters), Rural population: 0)
Houses: 1,518 (1,414 occupied: 808 owner occupied, 626 renter occupied)
| % of renters here: | 44% |
| State: | 32% |
Housing density: 781 houses/condos per square mile
Median price asked for vacant for-sale houses and condos in 2022: $1,872,685.
Median contract rent in 2022: $553 (lower quartile is $401, upper quartile is $625)
Median rent asked for vacant for-rent units in 2022: $2,685
Median gross rent in Bowling Green, MO in 2022: $724
Housing units in Bowling Green with a mortgage: 375 (16 second mortgage, 0 home equity loan, 16 both second mortgage and home equity loan)
Houses without a mortgage: 0
Median household income for houses/condos with a mortgage: $87,124
Median household income for apartments without a mortgage: $46,794
Median monthly housing costs: $664
Compare current foreclosures near Bowling Green, MO:
| Photo | Address | Area | Beds / Baths | Price | Details |
|---|---|---|---|---|---|

|
#1
S Science St
Bowling Green, MO 63334
|
- sq. feet
|
- baths 3 beds |
show details | |

|
#2
W Locust St
Bowling Green, MO 63334
|
- sq. feet
|
- baths 2 beds |
show details | |

|
#3
Mcward Dr
Bowling Green, MO 63334
|
- sq. feet
|
- baths - beds |
show details | |

|
#4
W Main St
Bowling Green, MO 63334
|
- sq. feet
|
- baths - beds |
show details | |

|
#5
E Champ Clark Dr
Bowling Green, MO 63334
|
- sq. feet
|
- baths 2 beds |
show details | |

|
#6
S 11th St
Bowling Green, MO 63334
|
- sq. feet
|
- baths 2 beds |
show details | |

|
#7
Lakeshore Dr
Bowling Green, MO 63334
|
- sq. feet
|
- baths - beds |
show details | |

|
#8
Pike 403
Bowling Green, MO 63334
|
- sq. feet
|
- baths - beds |
show details | |

|
#9
Hwy W
Vandalia, MO 63382
|
- sq. feet
|
- baths - beds |
$58,500
|
show details |

|
#10
N 3rd St
Clarksville, MO 63336
|
- sq. feet
|
2 baths 3 beds |
show details |
| Photo | Address | Area | Beds / Baths | Price | Details |
|---|---|---|---|---|---|

|
#11
S 4th St
Clarksville, MO 63336
|
- sq. feet
|
- baths - beds |
show details | |

|
#12
Pike 236 # 2
Clarksville, MO 63336
|
- sq. feet
|
- baths - beds |
show details | |

|
#13
Pike 241
Clarksville, MO 63336
|
- sq. feet
|
- baths - beds |
show details | |

|
#14
N 4th St
Clarksville, MO 63336
|
- sq. feet
|
- baths - beds |
show details | |

|
#15
Georgia St
Louisiana, MO 63353
|
- sq. feet
|
- baths 2 beds |
show details | |

|
#16
N 6th St
Clarksville, MO 63336
|
- sq. feet
|
- baths - beds |
show details | |

|
#17
Pike 114
Louisiana, MO 63353
|
- sq. feet
|
- baths - beds |
show details | |

|
#18
S Carolina St
Louisiana, MO 63353
|
- sq. feet
|
- baths 2 beds |
show details | |

|
#19
Pike 454
Curryville, MO 63339
|
- sq. feet
|
- baths - beds |
show details | |

|
#20
Highway M
Curryville, MO 63339
|
- sq. feet
|
- baths 2 beds |
show details |
| Photo | Address | Area | Beds / Baths | Price | Details |
|---|---|---|---|---|---|

|
#21
Royal Oak Dr
Silex, MO 63377
|
1,872 sq. feet
|
- baths - beds |
show details | |

|
#22
Pike 268
Eolia, MO 63344
|
- sq. feet
|
- baths - beds |
show details | |

|
#23
Pike 273
Louisiana, MO 63353
|
- sq. feet
|
- baths - beds |
show details | |

|
#24
Carroll Dr
Clarksville, MO 63336
|
- sq. feet
|
- baths - beds |
show details | |

|
Check over 1 million property listings on Foreclosure.com!
|
browse all offers | |||


 | Missouri Outlaw History (3407 replies) |
| Long ago on independence square (13162 replies) |
| What is wrong with St.Charles County? (227 replies) |
| Kansas City or St Louis area recommendation (2 replies) |
| Greeting Missouri Residents - KC, MO area; working in Fairfax, KS (23 replies) |
| Recommendations for good cities to live in (26 replies) |

Median year apartment built: 1974
Household type by relationship:
Households: 4,164- Male householders: 687 (275 living alone), Female householders: 716 (261 living alone)
457 spouses (457 opposite-sex spouses), 156 unmarried partners, (156 opposite-sex unmarried partners), 968 children (917 natural, 0 adopted, 51 stepchildren), 93 grandchildren, 10 brothers or sisters, 44 parents, 0 foster children, 8 other relatives, 37 non-relatives
- In group quarters: 984
Size of family households: 374 2-persons, 146 3-persons, 170 4-persons, 80 5-persons, 9 6-persons, 9 7-or-more-persons.
Size of nonfamily households: 555 1-person, 60 2-persons, 24 3-persons.
351 married couples with children.
368 single-parent households (140 men, 228 women).
93.5% of residents of Bowling Green speak English at home.
1.6% of residents speak Spanish at home (55% speak English very well, 14% speak English well, 31% speak English not well).
0.1% of residents speak other Indo-European language at home (100% speak English not well).
0.1% of residents speak Asian or Pacific Island language at home (100% speak English very well).
4.8% of residents speak other language at home (79% speak English very well, 21% speak English well).
Foreign born population: 84 (2.0%)
(95.2% of them are naturalized citizens)
| Here: | 5.5 |
| State: | 6.4 |
| Here: | 4.6 |
| State: | 4.4 |

- Bedrooms in owner-occupied houses and condos in Bowling Green, Missouri
- 0no bedroom
- 321 bedroom
- 2892 bedrooms
- 4163 bedrooms
- 524 bedrooms
- 185+ bedrooms

- Bedrooms in renter-occupied apartments in Bowling Green, Missouri
- 0no bedroom
- 901 bedroom
- 2322 bedrooms
- 2653 bedrooms
- 404 bedrooms
- 05+ bedrooms

- Cars and other vehicles available in Bowling Green in owner-occupied houses/condos
- 45no vehicle
- 2821 vehicle
- 2832 vehicles
- 1253 vehicles
- 734 vehicles
- 05+ vehicles

- Cars and other vehicles available in Bowling Green in renter-occupied apartments
- 146no vehicle
- 2621 vehicle
- 1642 vehicles
- 553 vehicles
- 04 vehicles
- 05+ vehicles

- Rooms in owner-occupied houses in Bowling Green, Missouri
- 01 room
- 02 rooms
- 893 rooms
- 874 rooms
- 2125 rooms
- 1976 rooms
- 1107 rooms
- 458 rooms
- 689+ rooms

- Rooms in renter-occupied apartments in Bowling Green, Missouri
- 01 room
- 462 rooms
- 483 rooms
- 1954 rooms
- 2055 rooms
- 956 rooms
- 347 rooms
- 38 rooms
- 09+ rooms


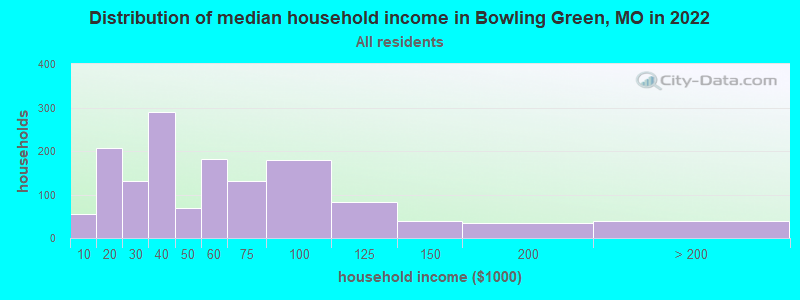
Bowling Green, MO household income distribution

- 55Less than $10,000
- 207$10,000 to $19,999
- 132$20,000 to $29,999
- 289$30,000 to $39,999
- 68$40,000 to $49,999
- 181$50,000 to $59,999
- 131$60,000 to $74,999
- 180$75,000 to $99,999
- 83$100,000 to $124,999
- 38$125,000 to $149,999
- 35$150,000 to $199,999
- 40$200,000 or more
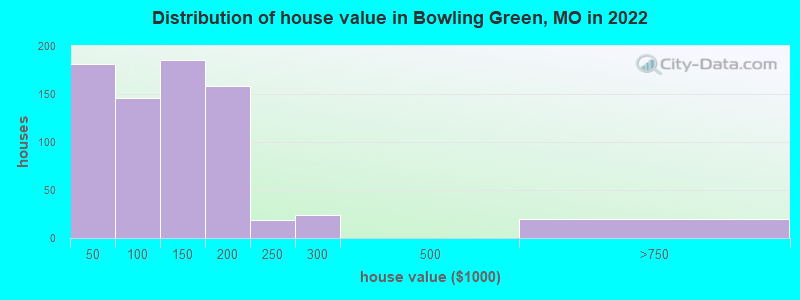
Home value of owner - occupied houses in 2022 in Bowling Green, MO
-
- 41Less than $10,000
- 1$15,000 to $19,999
- 98$20,000 to $24,999
- 36$25,000 to $29,999
- 2$35,000 to $39,999
- 38$50,000 to $59,999
- 40$70,000 to $79,999
- 32$80,000 to $89,999
- 34$90,000 to $99,999
- 124$100,000 to $124,999
- 61$125,000 to $149,999
- 126$150,000 to $174,999
- 32$175,000 to $199,999
- 19$200,000 to $249,999
- 24$250,000 to $299,999
- 20$500,000 to $749,999
Rent paid by renters in 2022 in Bowling Green, MO
-
- 18Less than $100
- 56$100 to $149
- 9$200 to $249
- 4$250 to $299
- 23$300 to $349
- 41$350 to $399
- 24$400 to $449
- 53$450 to $499
- 70$500 to $549
- 148$550 to $599
- 40$600 to $649
- 8$650 to $699
- 33$700 to $749
- 36$800 to $899
- 3$1,000 to $1,249
- 22No cash rent


Percentage of workers working in this county: 69.1%
Number of people working at home: 77 (5.7% of all workers)
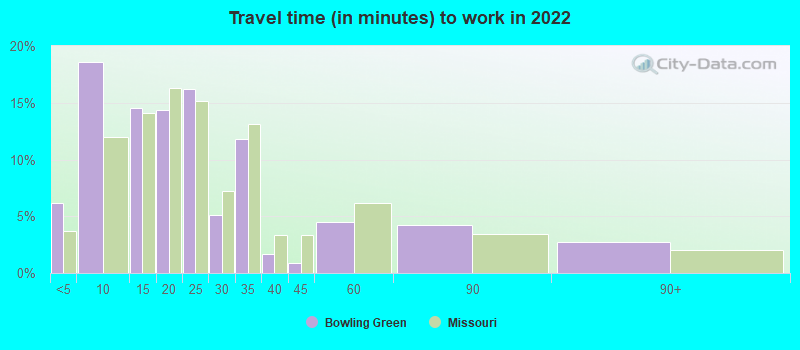
Travel time to work (commute)
- Less than 5 minutes: 135
- 5 to 9 minutes: 311
- 10 to 14 minutes: 197
- 15 to 19 minutes: 87
- 20 to 24 minutes: 111
- 25 to 29 minutes: 88
- 30 to 34 minutes: 207
- 35 to 39 minutes: 23
- 40 to 44 minutes: 0
- 45 to 59 minutes: 44
- 60 to 89 minutes: 40
- 90 or more minutes: 24
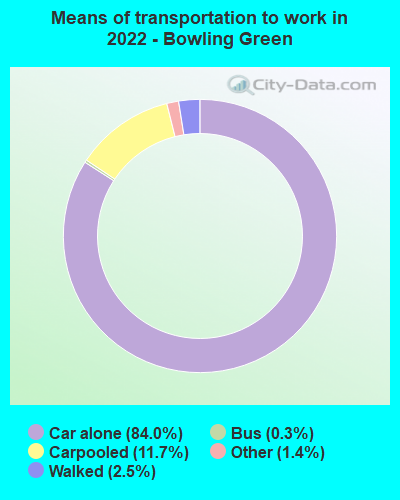
Means of transportation to work:
- Drove a car alone: 2,285 (79.6%)
- Carpooled: 322 (11.2%)
- Bus: 7 (0.2%)
- Taxi: 39 (1.4%)
- Walked: 64 (2.2%)
- Worked at home: 77 (2.7%)

- Unemployment by race in 2022
- Unemployment rate for White non-Hispanic residents
- 9.0%Males
- 4.0%Females
- Unemployment rate for Asian residents
- 100.0%Males
- Unemployment rate for Hispanic or Latino residents
- 100.0%Males

- Year of entry for the foreign-born population in Bowling Green, Missouri
- 02010 or later
- 782000 to 2009
- 31990 to 1999
- 71980 to 1989
- 01970 to 1979
- 0Before 1970
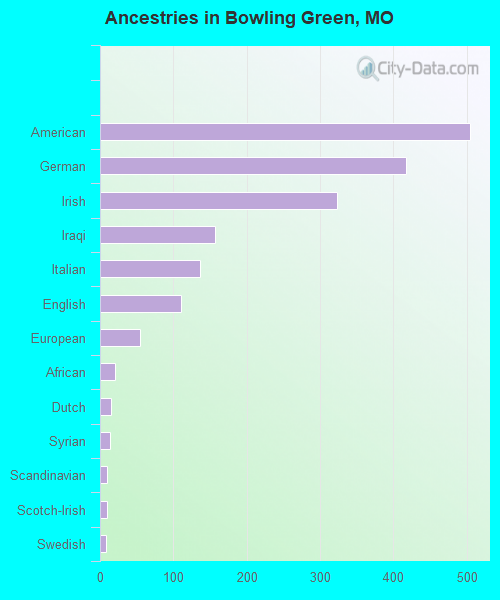
First ancestries reported:
- American: 505 (22.5%)
- German: 417 (18.6%)
- Irish: 323 (14.4%)
- Iraqi: 157 (7.0%)
- Italian: 136 (6.1%)
- English: 111 (4.9%)
- European: 55 (2.5%)
- African: 21 (0.9%)
- Dutch: 15 (0.7%)
- Syrian: 13 (0.6%)
- Scandinavian: 10 (0.4%)
- Scotch-Irish: 9 (0.4%)
- Swedish: 8 (0.4%)
- Scottish: 3 (0.1%)
- Canadian: 2 (0.09%)
- French: 2 (0.09%)
- French Canadian: 2 (0.09%)
- Polish: 2 (0.09%)
- Haitian: 2 (0.09%)
- Jamaican: 2 (0.09%)
- Norwegian: 1 (0.04%)
Most common places of birth for foreign-born residents (%):
| Bowling Green: | 31.0% (26) |
| Missouri: | 0.4% (1,113) |
| Bowling Green: | 29.8% (25) |
| Missouri: | 1.4% (3,509) |
| Bowling Green: | 4.8% (4) |
| Missouri: | 4.2% (10,873) |
Place of birth for U.S.-born residents:
- This state: 3,317
- Other state: 732
- Northeast: 26
- Midwest: 318
- South: 206
- West: 182
84.6% of Bowling Green residents lived in the same house 1 years ago.
Out of people who lived in different houses, 20.8% lived in this county.
Out of people who lived in different counties, 85.0% lived in Missouri.
| Bowling Green: | 84.6% |
| State average: | 87.1% |
Education attainment for males 25 years and older:
- No schooling: 7
- Nursery to 4th grade: 3
- 5th and 6th grade: 0
- 7th and 8th grade: 44
- 9th grade: 47
- 10th grade: 99
- 11th grade: 98
- 12th grade, no diploma: 64
- High school graduate (or equivalency): 983
- Less than 1 year of college: 84
- Some college more than 1 year, no degree: 156
- Associate degree: 40
- Bachelor's degree: 183
- Master's degree: 6
- Professional school degree: 15
- Doctorate degree: 0

Education attainment for females 25 years and older:
- No schooling: 18
- Nursery to 4th grade: 0
- 5th and 6th grade: 6
- 7th and 8th grade: 21
- 9th grade: 7
- 10th grade: 13
- 11th grade: 60
- 12th grade, no diploma: 29
- High school graduate (or equivalency): 468
- Less than 1 year of college: 41
- Some college more than 1 year, no degree: 107
- Associate degree: 92
- Bachelor's degree: 98
- Master's degree: 95
- Professional school degree: 0
- Doctorate degree: 4


Housing units in structures:
- One, detached: 957
- One, attached: 12
- Two: 139
- 3 or 4: 152
- 5 to 9: 8
- 20 to 49: 36
- 50 or more: 72
- Mobile homes: 139
House/condo owner moved in on average 7 years ago
Renter moved in on average 1 years ago

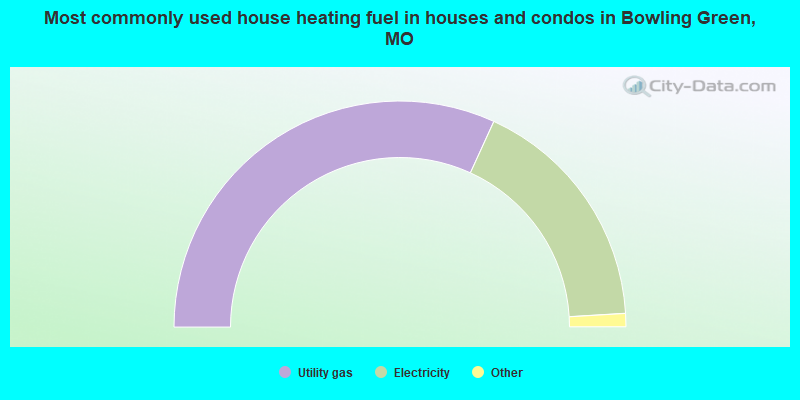
- 63.7%Utility gas
- 34.5%Electricity
- 1.3%Other fuel
- 0.5%Bottled, tank, or LP gas
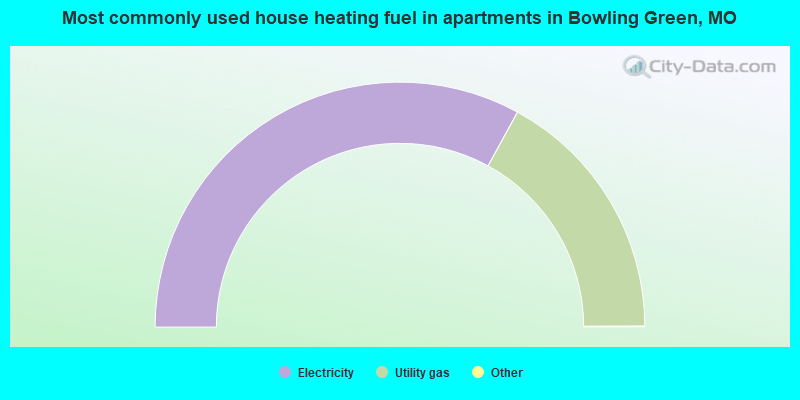
- 66.0%Electricity
- 34.0%Utility gas
Private vs. public school enrollment:
| Here: | 4.6% |
| Missouri: | 15.4% |
| Here: | 9.7% |
| Missouri: | 13.9% |
| Here: | 1.1% |
| Missouri: | 22.6% |


