Bradbury, CA (California) Houses and Residents
| Bradbury: | $2,011,359 |
| California: | $715,900 |
Mean price in 2022:
Detached houses: $3,867,616
Here: $3,867,616 State: $988,808
Total population: 1,087 (Urban population: 862, Rural population: 0)
Houses: 344 (280 occupied: 260 owner occupied, 21 renter occupied)
| % of renters here: | 7% |
| State: | 44% |
Housing density: 180 houses/condos per square mile
Median price asked for vacant for-sale houses and condos in 2022: $12,719,490.
Median gross rent in Bradbury, CA in 2022: $-666,666,666
Housing units in Bradbury with a mortgage: 189 (23 second mortgage, 0 home equity loan, 23 both second mortgage and home equity loan)
Houses without a mortgage: 2
Median household income for houses/condos with a mortgage: $191,085
Median household income for apartments without a mortgage: $73,302
Median monthly housing costs: $3,935
Compare current foreclosures near Bradbury, CA:
| Photo | Address | Area | Beds / Baths | Price | Details |
|---|---|---|---|---|---|

|
#1
Millbury Ave
Baldwin Park, CA 91706
|
1,632 sq. feet
|
2 baths 4 beds |
$850,000
|
show details |

|
#2
E Norma Ave
West Covina, CA 91791
|
1,134 sq. feet
|
2 baths 3 beds |
$599,000
|
show details |

|
#3
E Holton St
West Covina, CA 91791
|
- sq. feet
|
2 baths 3 beds |
$450,000
|
show details |

|
#4
And 6111 Northside Drive
Los Angeles, CA 90022
|
1,329 sq. feet
|
4 baths 3 beds |
show details | |

|
#5
Apple Court
Upland, CA 91786
|
1,655 sq. feet
|
2 baths 2 beds |
show details | |

|
#6
Bohlig Rd Apt 45
Los Angeles, CA 90032
|
813 sq. feet
|
2 baths 2 beds |
show details | |

|
#7
E Victoria Ave
Montebello, CA 90640
|
1,025 sq. feet
|
1 baths 2 beds |
show details | |

|
#8
Griffin Ave
Los Angeles, CA 90031
|
3,277 sq. feet
|
5 baths 9 beds |
show details | |

|
#9
N 20th St
Montebello, CA 90640
|
1,488 sq. feet
|
2 baths 4 beds |
show details | |

|
#10
Highland Oaks Dr
Arcadia, CA 91006
|
2,212 sq. feet
|
3 baths 3 beds |
show details |
| Photo | Address | Area | Beds / Baths | Price | Details |
|---|---|---|---|---|---|

|
#11
N Morada Ave
West Covina, CA 91790
|
1,144 sq. feet
|
1 baths 3 beds |
show details | |

|
#12
Fernbank Ave
Monterey Park, CA 91754
|
1,310 sq. feet
|
2 baths 3 beds |
show details | |

|
#13
E Benbow St
Covina, CA 91722
|
1,514 sq. feet
|
2 baths 4 beds |
show details | |

|
#14
Flora St
Montclair, CA 91763
|
1,145 sq. feet
|
2 baths 4 beds |
show details | |

|
#15
Lander Cir
Claremont, CA 91711
|
1,469 sq. feet
|
2 baths 3 beds |
show details | |

|
#16
Park Ave
Baldwin Park, CA 91706
|
2,452 sq. feet
|
4 baths 7 beds |
show details | |

|
#17
Park Rock Dr
La Puente, CA 91744
|
1,450 sq. feet
|
2 baths 3 beds |
show details | |

|
#18
E Pinehurst Ave
La Habra, CA 90631
|
1,125 sq. feet
|
1 baths 3 beds |
show details | |

|
#19
N Montebello Blvd
Montebello, CA 90640
|
1,509 sq. feet
|
2 baths 2 beds |
show details | |

|
#20
W Wilson St
Pomona, CA 91768
|
576 sq. feet
|
1 baths 1 beds |
show details |
| Photo | Address | Area | Beds / Baths | Price | Details |
|---|---|---|---|---|---|

|
#21
Bequette Ave
Pico Rivera, CA 90660
|
2,766 sq. feet
|
2 baths 3 beds |
show details | |

|
#22
N Towne Ave
Pomona, CA 91767
|
2,177 sq. feet
|
2 baths 5 beds |
show details | |

|
#23
Wagon Train Ln
Diamond Bar, CA 91765
|
3,554 sq. feet
|
3 baths 4 beds |
show details | |

|
#24
E Edna Pl
Covina, CA 91722
|
1,440 sq. feet
|
2 baths 4 beds |
show details | |

|
#25
El Selinda Ave
Bell, CA 90201
|
1,182 sq. feet
|
1 baths 3 beds |
show details | |

|
#26
Adelita St
Montebello, CA 90640
|
2,435 sq. feet
|
3 baths 4 beds |
show details | |

|
#27
Calico Ave
Pico Rivera, CA 90660
|
2,220 sq. feet
|
2 baths 3 beds |
show details | |

|
#28
Topaz Ave
La Habra, CA 90631
|
2,481 sq. feet
|
3 baths 5 beds |
show details | |

|
#29
S Bender Ave
Glendora, CA 91740
|
1,410 sq. feet
|
2 baths 3 beds |
show details | |

|
#30
N Charter Dr
Covina, CA 91724
|
1,387 sq. feet
|
2 baths 4 beds |
show details |
| Photo | Address | Area | Beds / Baths | Price | Details |
|---|---|---|---|---|---|

|
#31
S Pintado Dr
Diamond Bar, CA 91765
|
1,465 sq. feet
|
2 baths 4 beds |
show details | |

|
#32
Nassau Ave
Los Angeles, CA 90063
|
1,036 sq. feet
|
1 baths 3 beds |
show details | |

|
#33
W Washington Blvd
Pasadena, CA 91103
|
1,608 sq. feet
|
2 baths 4 beds |
show details | |

|
#34
Flintridge Dr
Glendale, CA 91206
|
2,648 sq. feet
|
3 baths 5 beds |
show details | |

|
#35
Calle Ciervos
San Dimas, CA 91773
|
1,825 sq. feet
|
2 baths 3 beds |
show details | |

|
#36
Lavell Dr
Los Angeles, CA 90065
|
- sq. feet
|
4 baths 4 beds |
show details | |

|
#37
Tacoma Ave
Los Angeles, CA 90065
|
2,047 sq. feet
|
2 baths 3 beds |
show details | |

|
#38
Rincon Dr
Whittier, CA 90606
|
1,002 sq. feet
|
1 baths 3 beds |
show details | |

|
#39
Catalina Ave #108
Pasadena, CA 91106
|
1,269 sq. feet
|
2 baths 2 beds |
show details | |

|
#40
Lavell Dr
Los Angeles, CA 90065
|
2,076 sq. feet
|
4 baths 4 beds |
show details |
| Photo | Address | Area | Beds / Baths | Price | Details |
|---|---|---|---|---|---|

|
#41
N Jackson St Apt 210
Glendale, CA 91206
|
- sq. feet
|
1 baths 1 beds |
show details | |

|
#42
Meadow Grove St
La Canada Flintridge, CA 91011
|
8,618 sq. feet
|
8 baths 7 beds |
show details | |

|
#43
Mitony Ave
Whittier, CA 90605
|
1,561 sq. feet
|
2 baths 3 beds |
show details | |

|
#44
Brookshire Ave
Downey, CA 90240
|
3,506 sq. feet
|
3 baths 4 beds |
show details | |

|
#45
Dittmar Dr
Whittier, CA 90603
|
1,094 sq. feet
|
1 baths 3 beds |
show details | |

|
#46
Shoemaker Ave
Whittier, CA 90605
|
1,700 sq. feet
|
2 baths 3 beds |
show details | |

|
#47
W Calora St
San Dimas, CA 91773
|
1,178 sq. feet
|
2 baths 3 beds |
show details | |

|
#48
Lemoran Ave
Pico Rivera, CA 90660
|
1,633 sq. feet
|
2 baths 3 beds |
show details | |

|
#49
Margaret Ave
Los Angeles, CA 90022
|
1,192 sq. feet
|
1 baths 3 beds |
show details | |

|
Check over 1 million property listings on Foreclosure.com!
|
browse all offers | |||

Latest news about housing in Bradbury, CA collected exclusively by city-data.com from local newspapers, TV, and radio stations


Median year apartment built: 1957
Household type by relationship:
Households: 750- Male householders: 173 (14 living alone), Female householders: 97 (14 living alone)
208 spouses (205 opposite-sex spouses), 9 unmarried partners, (7 opposite-sex unmarried partners), 172 children (162 natural, 4 adopted, 4 stepchildren), 22 grandchildren, 6 brothers or sisters, 42 parents, 0 foster children, 4 other relatives, 12 non-relatives
Size of family households: 127 2-persons, 45 3-persons, 46 4-persons, 17 5-persons, 2 6-persons.
Size of nonfamily households: 31 1-person, 9 2-persons.
62 married couples with children.
16 single-parent households (0 men, 16 women).
61.7% of residents of Bradbury speak English at home.
4.8% of residents speak Spanish at home (63% speak English very well, 17% speak English well, 20% speak English not well).
9.2% of residents speak other Indo-European language at home (97% speak English very well, 3% don't speak English at all).
19.3% of residents speak Asian or Pacific Island language at home (63% speak English very well, 20% speak English well, 11% speak English not well, 6% don't speak English at all).
5.1% of residents speak other language at home (100% speak English very well).
Foreign born population: 238 (31.7%)
(79.0% of them are naturalized citizens)
| Here: | 7.8 |
| State: | 6.0 |
| Here: | 6.8 |
| State: | 3.9 |

- Bedrooms in owner-occupied houses and condos in Bradbury, California
- 0no bedroom
- 201 bedroom
- 12 bedrooms
- 653 bedrooms
- 1034 bedrooms
- 715+ bedrooms

- Bedrooms in renter-occupied apartments in Bradbury, California
- 0no bedroom
- 01 bedroom
- 62 bedrooms
- 03 bedrooms
- 154 bedrooms
- 05+ bedrooms

- Cars and other vehicles available in Bradbury in owner-occupied houses/condos
- 0no vehicle
- 331 vehicle
- 982 vehicles
- 633 vehicles
- 174 vehicles
- 505+ vehicles

- Cars and other vehicles available in Bradbury in renter-occupied apartments
- 7no vehicle
- 01 vehicle
- 142 vehicles
- 03 vehicles
- 04 vehicles
- 05+ vehicles

- Rooms in owner-occupied houses in Bradbury, California
- 01 room
- 02 rooms
- 23 rooms
- 154 rooms
- 275 rooms
- 266 rooms
- 477 rooms
- 338 rooms
- 1109+ rooms

- Rooms in renter-occupied apartments in Bradbury, California
- 01 room
- 02 rooms
- 03 rooms
- 04 rooms
- 05 rooms
- 96 rooms
- 57 rooms
- 78 rooms
- 09+ rooms


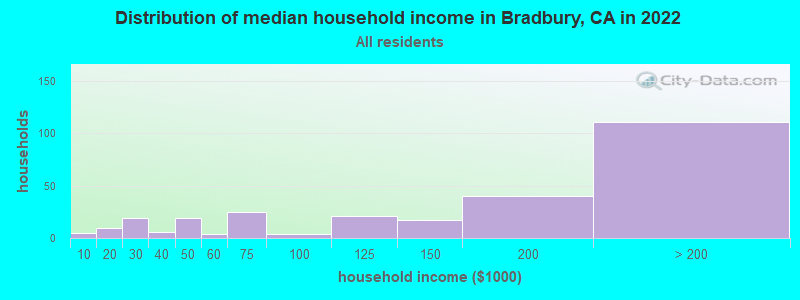
Bradbury, CA household income distribution

- 5Less than $10,000
- 10$10,000 to $19,999
- 19$20,000 to $29,999
- 6$30,000 to $39,999
- 19$40,000 to $49,999
- 4$50,000 to $59,999
- 25$60,000 to $74,999
- 4$75,000 to $99,999
- 21$100,000 to $124,999
- 17$125,000 to $149,999
- 40$150,000 to $199,999
- 111$200,000 or more
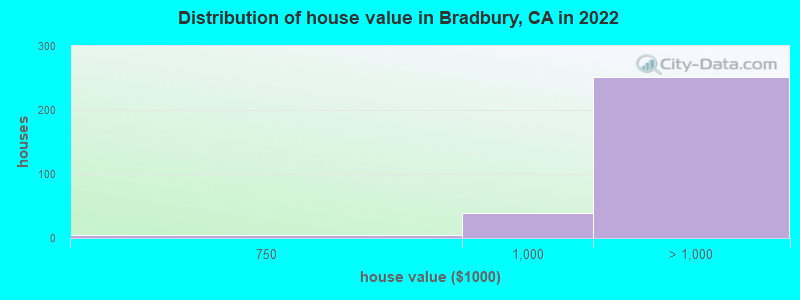
Home value of owner - occupied houses in 2022 in Bradbury, CA
-
- 1$100,000 to $124,999
- 1$175,000 to $199,999
- 1$400,000 to $499,999
- 5$500,000 to $749,999
- 38$750,000 to $999,999
- 69$1,000,000 to $1,499,999
- 41$1,500,000 to $1,999,999
- 140$2,000,000 or more

Percentage of workers working in this county: 91.8%
Number of people working at home: 73 (19.9% of all workers)
Travel time to work (commute)
- Less than 5 minutes: 4
- 5 to 9 minutes: 9
- 10 to 14 minutes: 34
- 15 to 19 minutes: 76
- 20 to 24 minutes: 41
- 25 to 29 minutes: 11
- 30 to 34 minutes: 35
- 35 to 39 minutes: 6
- 40 to 44 minutes: 15
- 45 to 59 minutes: 31
- 60 to 89 minutes: 23
- 90 or more minutes: 7
Means of transportation to work:
- Drove a car alone: 322 (79.1%)
- Carpooled: 34 (8.4%)
- Bus or trolley bus: 2 (0.5%)
- Streetcar or trolley car: 6 (1.5%)
- Bicycle: 2 (0.5%)
- Walked: 10 (2.5%)
- Other means: 6 (1.5%)
- Worked at home: 25 (6.1%)

- Unemployment by race in 2022
- Unemployment rate for White non-Hispanic residents
- 6.9%Males
- 15.5%Females
- Unemployment rate for Asian residents
- 2.6%Females
- Unemployment rate for two or more race residents
- 11.6%Females
- Unemployment rate for Hispanic or Latino residents
- 9.3%Females

- Year of entry for the foreign-born population in Bradbury, California
- 512010 or later
- 252000 to 2009
- 421990 to 1999
- 501980 to 1989
- 611970 to 1979
- 49Before 1970

First ancestries reported:
- American: 31 (7.6%)
- Egyptian: 21 (5.1%)
- English: 14 (3.4%)
- Irish: 14 (3.4%)
- Polish: 11 (2.7%)
- Iranian: 10 (2.4%)
- Italian: 7 (1.7%)
- German: 6 (1.5%)
- Afghan: 5 (1.2%)
- Yugoslavian: 5 (1.2%)
- Danish: 3 (0.7%)
- European: 3 (0.7%)
- Scotch-Irish: 3 (0.7%)
- British: 2 (0.5%)
- Dutch: 2 (0.5%)
- Russian: 2 (0.5%)
- Scottish: 2 (0.5%)
- French: 1 (0.2%)
- Swedish: 1 (0.2%)
Most common places of birth for foreign-born residents (%):
| Bradbury: | 27.3% (65) |
| California: | 6.6% (684,672) |
| Bradbury: | 18.9% (45) |
| California: | 1.7% (176,274) |
| Bradbury: | 16.0% (38) |
| California: | 5.2% (539,184) |
| Bradbury: | 7.1% (17) |
| California: | 7.8% (818,297) |
| Bradbury: | 6.3% (15) |
| California: | 37.2% (3,881,193) |
| Bradbury: | 3.8% (9) |
| California: | 2.0% (206,004) |
| Bradbury: | 2.9% (7) |
| California: | 4.9% (512,335) |
| Bradbury: | 2.5% (6) |
| California: | 0.4% (42,718) |
| Bradbury: | 2.5% (6) |
| California: | 0.5% (55,249) |
| Bradbury: | 1.7% (4) |
| California: | 0.0% (3,239) |
Place of birth for U.S.-born residents:
- This state: 371
- Other state: 122
- Northeast: 50
- Midwest: 49
- South: 7
- West: 14
93.7% of Bradbury residents lived in the same house 1 years ago.
Out of people who lived in different houses, 44.0% lived in this county.
Out of people who lived in different counties, 37.5% lived in California.
| Bradbury: | 93.7% |
| State average: | 88.9% |
Education attainment for males 25 years and older:
- No schooling: 4
- Nursery to 4th grade: 0
- 5th and 6th grade: 2
- 7th and 8th grade: 0
- 9th grade: 0
- 10th grade: 8
- 11th grade: 0
- 12th grade, no diploma: 2
- High school graduate (or equivalency): 15
- Less than 1 year of college: 16
- Some college more than 1 year, no degree: 29
- Associate degree: 31
- Bachelor's degree: 100
- Master's degree: 36
- Professional school degree: 22
- Doctorate degree: 11

Education attainment for females 25 years and older:
- No schooling: 21
- Nursery to 4th grade: 0
- 5th and 6th grade: 0
- 7th and 8th grade: 0
- 9th grade: 0
- 10th grade: 2
- 11th grade: 5
- 12th grade, no diploma: 5
- High school graduate (or equivalency): 56
- Less than 1 year of college: 20
- Some college more than 1 year, no degree: 30
- Associate degree: 31
- Bachelor's degree: 66
- Master's degree: 57
- Professional school degree: 25
- Doctorate degree: 11


Housing units in structures:
- One, detached: 333
- One, attached: 2
- 50 or more: 8
Housing units lacking complete kitchen facilities in 2022: 3.5%
House/condo owner moved in on average 11 years ago
Renter moved in on average 6 years ago

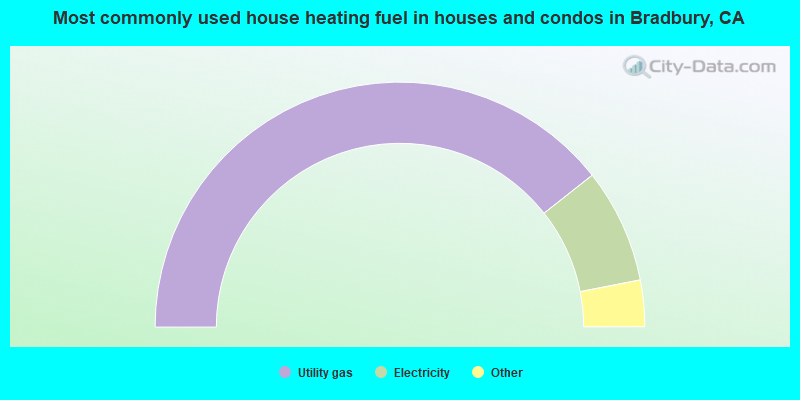
- 79.3%Utility gas
- 15.2%Electricity
- 3.1%No fuel used
- 0.8%Bottled, tank, or LP gas
- 0.8%Coal or coke
- 0.8%Solar energy
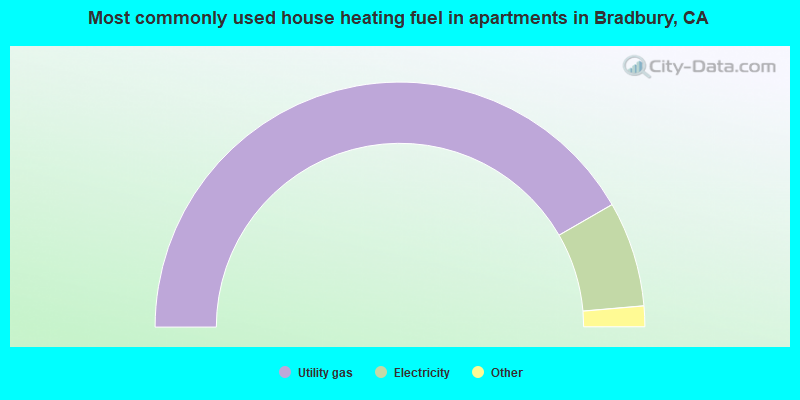
- 85.7%Utility gas
- 14.3%Electricity
Private vs. public school enrollment:
| Here: | 38.1% |
| California: | 10.5% |
| Here: | 37.5% |
| California: | 8.5% |
| Here: | 44.8% |
| California: | 15.9% |


