Bradley, IL (Illinois) Houses and Residents
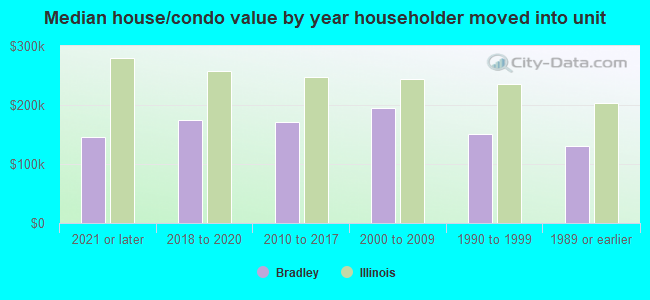
| Bradley: | $173,488 |
| Illinois: | $251,600 |
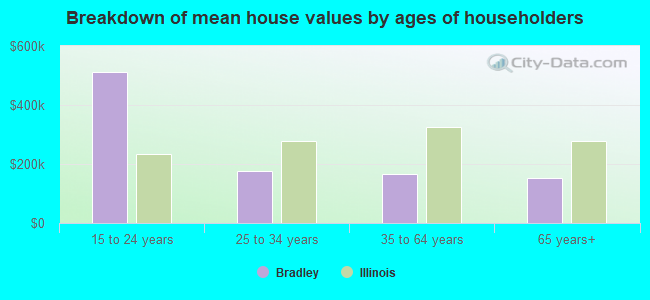
Mean price in 2022:
Detached houses: $185,366
Here: $185,366 State: $310,164 Townhouses or other attached units: $158,597
Here: $158,597 State: $286,230 In 2-unit structures: $130,144
Here: $130,144 State: $299,638 In 3-to-4-unit structures: $59,522
Here: $59,522 State: $330,907
Total population: 15,677 (Urban population: 12,716, Rural population: 6 (all nonfarm))
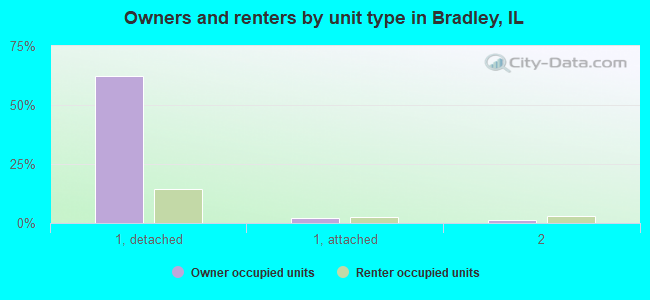
Houses: 6,337 (6,001 occupied: 3,797 owner occupied, 2,188 renter occupied)
| % of renters here: | 37% |
| State: | 33% |
Housing density: 1,676 houses/condos per square mile
Median price asked for vacant for-sale houses and condos in 2022 in this county: $115,283.
Median contract rent in 2022: $938 (lower quartile is $723, upper quartile is $1,165)
Median rent asked for vacant for-rent units in 2022: $719
Median gross rent in Bradley, IL in 2022: $1,161
Housing units in Bradley with a mortgage: 2,289 (196 second mortgage, 19 home equity loan, 132 both second mortgage and home equity loan)
Houses without a mortgage: 6
Median household income for houses/condos with a mortgage: $103,174
Median household income for apartments without a mortgage: $56,194
Median monthly housing costs: $1,076
Compare current foreclosures near Bradley, IL:
| Photo | Address | Area | Beds / Baths | Price | Details |
|---|---|---|---|---|---|

|
#1
S Cleveland Ave
Bradley, IL 60915
|
1,200 sq. feet
|
1 baths 2 beds |
$103,900
|
show details |

|
#2
S Douglas Ave
Bradley, IL 60915
|
852 sq. feet
|
1 baths 3 beds |
show details | |

|
#3
Meadow Ct
Bradley, IL 60915
|
1,056 sq. feet
|
1 baths 3 beds |
show details | |

|
#4
S Prairie Ave
Bradley, IL 60915
|
- sq. feet
|
- baths - beds |
show details | |

|
#5
S Schuyler Ave
Bradley, IL 60915
|
- sq. feet
|
- baths - beds |
show details | |

|
#6
E Maple St
Kankakee, IL 60901
|
1,320 sq. feet
|
1 baths 4 beds |
$49,900
|
show details |

|
#7
Jordan Dr
Bourbonnais, IL 60914
|
936 sq. feet
|
1 baths 3 beds |
$187,000
|
show details |

|
#8
Jonette Ave
Bradley, IL 60915
|
- sq. feet
|
- baths - beds |
show details | |

|
#9
Durham St
Bradley, IL 60915
|
- sq. feet
|
- baths - beds |
show details | |

|
#10
Flamingo Ln
Bradley, IL 60915
|
- sq. feet
|
- baths - beds |
show details |
| Photo | Address | Area | Beds / Baths | Price | Details |
|---|---|---|---|---|---|

|
#11
Cook Blvd
Bradley, IL 60915
|
- sq. feet
|
- baths - beds |
show details | |

|
#12
N Jackson Ave
Bradley, IL 60915
|
- sq. feet
|
- baths - beds |
show details | |

|
#13
Evergreen Ln
Bradley, IL 60915
|
- sq. feet
|
- baths - beds |
show details | |

|
#14
W Brookmont Blvd
Bradley, IL 60915
|
- sq. feet
|
- baths - beds |
show details | |

|
#15
S Blaine Ave
Bradley, IL 60915
|
- sq. feet
|
- baths - beds |
show details | |

|
#16
N Prairie Ave
Bradley, IL 60915
|
- sq. feet
|
- baths - beds |
show details | |

|
#17
S Douglas Dr
Bradley, IL 60915
|
- sq. feet
|
- baths - beds |
show details | |

|
#18
S Douglas Ave
Bradley, IL 60915
|
- sq. feet
|
- baths - beds |
show details | |

|
#19
Truman Dr
Bradley, IL 60915
|
- sq. feet
|
- baths - beds |
show details | |

|
#20
Durham St
Bradley, IL 60915
|
- sq. feet
|
- baths - beds |
show details |
| Photo | Address | Area | Beds / Baths | Price | Details |
|---|---|---|---|---|---|

|
#21
Mac Arthur Dr
Bradley, IL 60915
|
- sq. feet
|
- baths - beds |
show details | |

|
#22
S Schuyler Ave
Bradley, IL 60915
|
- sq. feet
|
- baths - beds |
show details | |

|
#23
Ponderosa Dr
Bradley, IL 60915
|
- sq. feet
|
- baths - beds |
show details | |

|
#24
N Prairie Ave
Bradley, IL 60915
|
- sq. feet
|
- baths - beds |
show details | |

|
#25
Jeffery St
Bradley, IL 60915
|
- sq. feet
|
- baths - beds |
show details | |

|
#26
Heather Rd E
Bourbonnais, IL 60914
|
- sq. feet
|
2 baths 3 beds |
$297,400
|
show details |

|
#27
S Curtis Ave
Kankakee, IL 60901
|
1,210 sq. feet
|
2 baths 4 beds |
show details | |

|
#28
West Second South Street
Chebanse, IL 60922
|
1,288 sq. feet
|
2 baths 3 beds |
show details | |

|
#29
S Macks Rd
Wilmington, IL 60481
|
1,800 sq. feet
|
4 baths 3 beds |
show details | |

|
#30
S 4th Ave
Kankakee, IL 60901
|
- sq. feet
|
1 baths 2 beds |
show details |
| Photo | Address | Area | Beds / Baths | Price | Details |
|---|---|---|---|---|---|

|
#31
S May Ave
Kankakee, IL 60901
|
1,120 sq. feet
|
1 baths 2 beds |
show details | |

|
#32
N Oak St
Herscher, IL 60941
|
1,260 sq. feet
|
2 baths 3 beds |
show details | |

|
#33
S Small Ave
Kankakee, IL 60901
|
1,020 sq. feet
|
1 baths 2 beds |
show details | |

|
#34
Toni St
Bourbonnais, IL 60914
|
920 sq. feet
|
1 baths 3 beds |
show details | |

|
#35
S Mckinley Ave
Kankakee, IL 60901
|
- sq. feet
|
1 baths 2 beds |
show details | |

|
#36
Strasma W Dr
Kankakee, IL 60901
|
- sq. feet
|
2 baths 4 beds |
show details | |

|
#37
S 6th Ave
Kankakee, IL 60901
|
- sq. feet
|
- baths - beds |
show details | |

|
#38
S 4th Ave
Kankakee, IL 60901
|
- sq. feet
|
- baths - beds |
show details | |

|
#39
S 7th Ave
Kankakee, IL 60901
|
- sq. feet
|
- baths - beds |
show details | |

|
#40
S 10th Ave
Kankakee, IL 60901
|
- sq. feet
|
- baths - beds |
show details |
| Photo | Address | Area | Beds / Baths | Price | Details |
|---|---|---|---|---|---|

|
#41
Emery Dr
Bourbonnais, IL 60914
|
- sq. feet
|
- baths - beds |
show details | |

|
#42
S 6th Ave
Kankakee, IL 60901
|
- sq. feet
|
- baths - beds |
show details | |

|
#43
Saint George Dr
Bourbonnais, IL 60914
|
- sq. feet
|
- baths - beds |
show details | |

|
#44
Little Chief Dr
Bourbonnais, IL 60914
|
- sq. feet
|
- baths - beds |
show details | |

|
#45
Little Chief Dr
Bourbonnais, IL 60914
|
- sq. feet
|
- baths - beds |
show details | |

|
#46
Big Chief Dr
Bourbonnais, IL 60914
|
- sq. feet
|
- baths - beds |
show details | |

|
#47
W Taylor St
Grant Park, IL 60940
|
- sq. feet
|
- baths - beds |
show details | |

|
#48
Saint Pauls Dr
Bourbonnais, IL 60914
|
- sq. feet
|
- baths - beds |
show details | |

|
#49
Locust Ln
Peotone, IL 60468
|
- sq. feet
|
- baths - beds |
show details | |

|
Check over 1 million property listings on Foreclosure.com!
|
browse all offers | |||

Latest news about housing in Bradley, IL collected exclusively by city-data.com from local newspapers, TV, and radio stations

 | Nicest/safest parts of Bourbonnais (6 replies) |
| Homewood - Flossmoor area (7 replies) |
| Is Kankakee a bad area to live in? (66 replies) |
| Potential Move to Bradley/Bourbonnais (3 replies) |
| I have all of IL to choose from, where should I move? (24 replies) |
| Working in Bradley, IL want to live closer to Chicago (7 replies) |
Median year apartment built: 1976
Household type by relationship:
Households: 15,186- Male householders: 2,941 (742 living alone), Female householders: 2,970 (927 living alone)
2,513 spouses (2,485 opposite-sex spouses), 423 unmarried partners, (423 opposite-sex unmarried partners), 4,448 children (4,124 natural, 64 adopted, 259 stepchildren), 338 grandchildren, 173 brothers or sisters, 141 parents, 15 foster children, 78 other relatives, 1,009 non-relatives
- In group quarters: 131
Size of family households: 1,473 2-persons, 847 3-persons, 691 4-persons, 601 5-persons, 49 6-persons, 9 7-or-more-persons.
Size of nonfamily households: 1,669 1-person, 521 2-persons, 81 3-persons, 34 5-persons.
1,448 married couples with children.
1,197 single-parent households (268 men, 929 women).
89.8% of residents of Bradley speak English at home.
8.2% of residents speak Spanish at home (90% speak English very well, 3% speak English well, 1% speak English not well, 5% don't speak English at all).
0.9% of residents speak other Indo-European language at home (100% speak English very well).
0.2% of residents speak Asian or Pacific Island language at home (48% speak English very well, 52% speak English not well).
0.4% of residents speak other language at home (100% speak English very well).
Foreign born population: 515 (3.4%)
(62.3% of them are naturalized citizens)
| Here: | 6.1 |
| State: | 6.4 |
| Here: | 4.2 |
| State: | 4.1 |
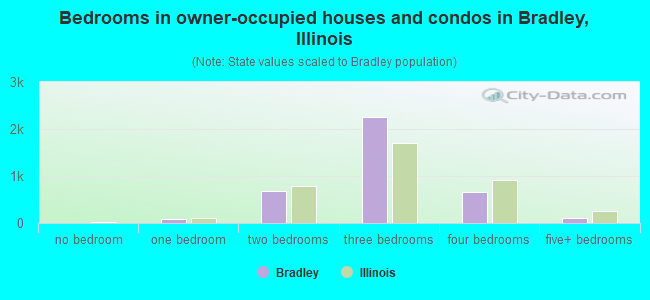
- Bedrooms in owner-occupied houses and condos in Bradley, Illinois
- 10no bedroom
- 761 bedroom
- 6802 bedrooms
- 2,2553 bedrooms
- 6654 bedrooms
- 1125+ bedrooms
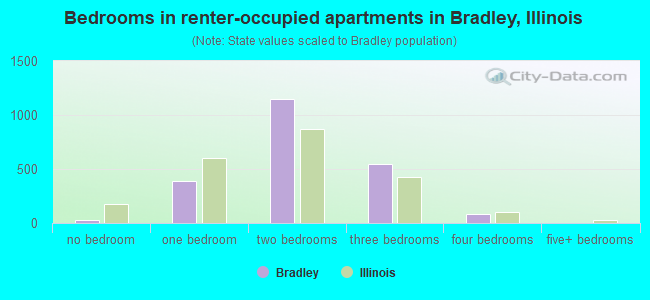
- Bedrooms in renter-occupied apartments in Bradley, Illinois
- 26no bedroom
- 3851 bedroom
- 1,1482 bedrooms
- 5453 bedrooms
- 854 bedrooms
- 05+ bedrooms
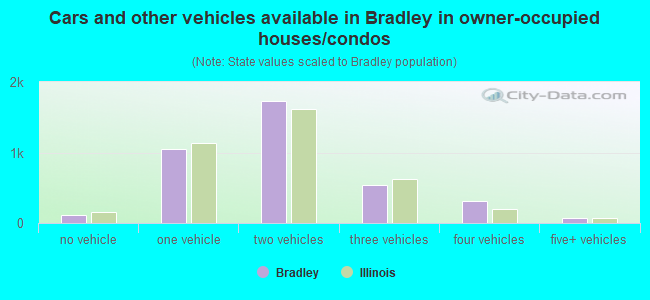
- Cars and other vehicles available in Bradley in owner-occupied houses/condos
- 111no vehicle
- 1,0441 vehicle
- 1,7292 vehicles
- 5333 vehicles
- 3174 vehicles
- 645+ vehicles
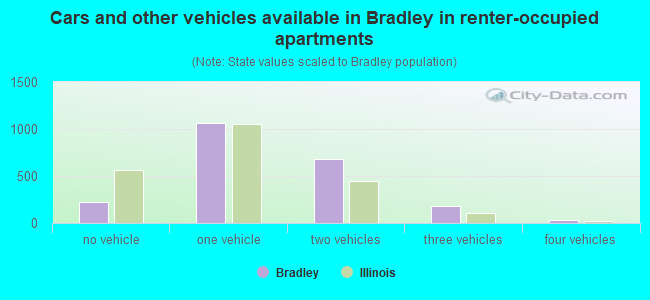
- Cars and other vehicles available in Bradley in renter-occupied apartments
- 220no vehicle
- 1,0691 vehicle
- 6802 vehicles
- 1843 vehicles
- 364 vehicles
- 05+ vehicles
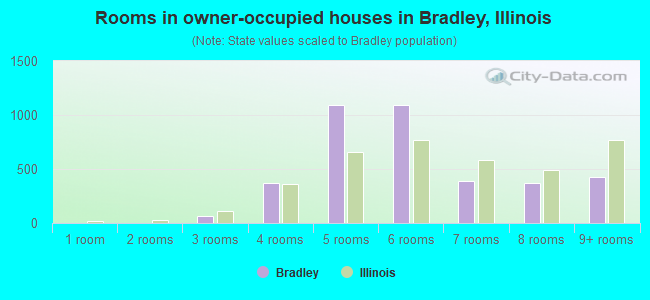
- Rooms in owner-occupied houses in Bradley, Illinois
- 01 room
- 02 rooms
- 623 rooms
- 3674 rooms
- 1,0925 rooms
- 1,0936 rooms
- 3877 rooms
- 3698 rooms
- 4289+ rooms
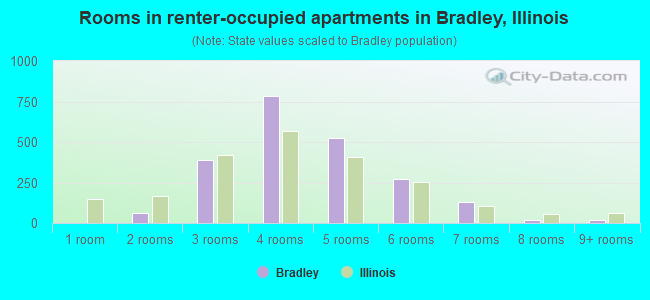
- Rooms in renter-occupied apartments in Bradley, Illinois
- 01 room
- 622 rooms
- 3863 rooms
- 7834 rooms
- 5225 rooms
- 2736 rooms
- 1277 rooms
- 198 rooms
- 179+ rooms
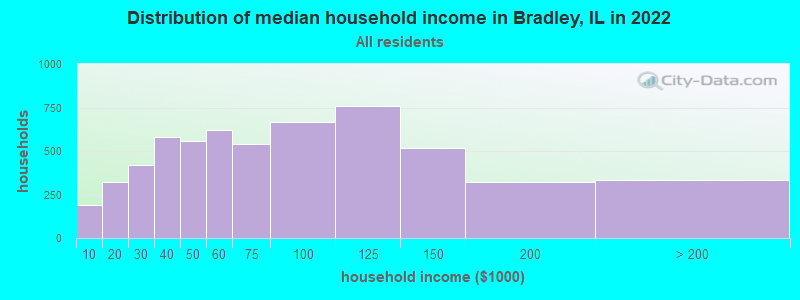
Bradley, IL household income distribution

- 190Less than $10,000
- 321$10,000 to $19,999
- 417$20,000 to $29,999
- 583$30,000 to $39,999
- 560$40,000 to $49,999
- 619$50,000 to $59,999
- 541$60,000 to $74,999
- 665$75,000 to $99,999
- 756$100,000 to $124,999
- 517$125,000 to $149,999
- 322$150,000 to $199,999
- 335$200,000 or more
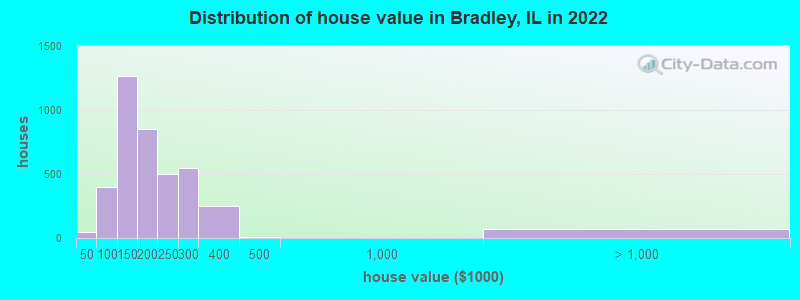
Home value of owner - occupied houses in 2022 in Bradley, IL
-
- 22$10,000 to $14,999
- 16$30,000 to $34,999
- 5$40,000 to $49,999
- 15$50,000 to $59,999
- 39$60,000 to $69,999
- 116$70,000 to $79,999
- 121$80,000 to $89,999
- 98$90,000 to $99,999
- 642$100,000 to $124,999
- 620$125,000 to $149,999
- 608$150,000 to $174,999
- 243$175,000 to $199,999
- 502$200,000 to $249,999
- 544$250,000 to $299,999
- 249$300,000 to $399,999
- 11$400,000 to $499,999
- 69$1,500,000 to $1,999,999
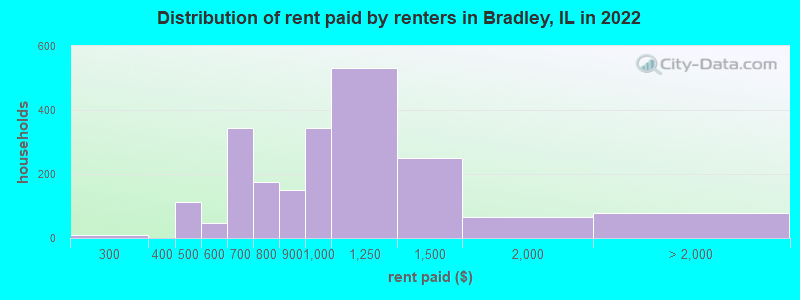
Rent paid by renters in 2022 in Bradley, IL
-
- 8$250 to $299
- 45$400 to $449
- 66$450 to $499
- 16$500 to $549
- 29$550 to $599
- 273$600 to $649
- 70$650 to $699
- 59$700 to $749
- 116$750 to $799
- 151$800 to $899
- 343$900 to $999
- 530$1,000 to $1,249
- 248$1,250 to $1,499
- 65$1,500 to $1,999
- 13$2,000 to $2,499
- 65No cash rent
Percentage of workers working in this county: 79.4%
Number of people working at home: 525 (6.6% of all workers)
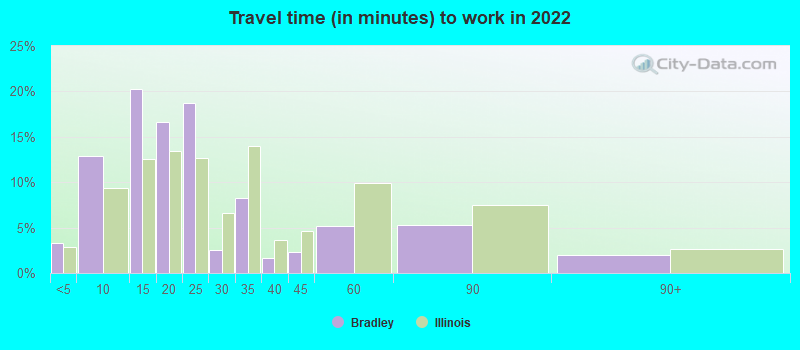
Travel time to work (commute)
- Less than 5 minutes: 449
- 5 to 9 minutes: 1,057
- 10 to 14 minutes: 1,507
- 15 to 19 minutes: 1,144
- 20 to 24 minutes: 1,043
- 25 to 29 minutes: 122
- 30 to 34 minutes: 577
- 35 to 39 minutes: 184
- 40 to 44 minutes: 232
- 45 to 59 minutes: 409
- 60 to 89 minutes: 362
- 90 or more minutes: 178
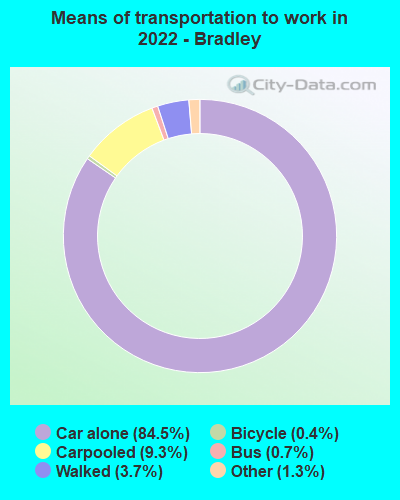
Means of transportation to work:
- Drove a car alone: 7,325 (79.9%)
- Carpooled: 570 (6.2%)
- Bus: 59 (0.6%)
- Taxi: 109 (1.2%)
- Bicycle: 15 (0.2%)
- Walked: 515 (5.6%)
- Worked at home: 525 (5.7%)
- Unemployment by race in 2022
- Unemployment rate for White non-Hispanic residents
- 5.8%Males
- 2.8%Females
- Unemployment rate for Black residents
- 8.0%Females
- Unemployment rate for other race residents
- 10.9%Females
- Unemployment rate for Hispanic or Latino residents
- 1.3%Females
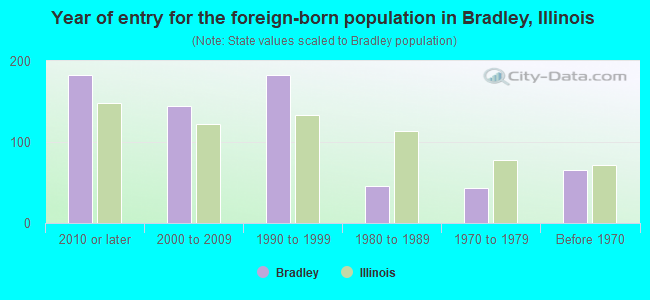
- Year of entry for the foreign-born population in Bradley, Illinois
- 1832010 or later
- 1452000 to 2009
- 1831990 to 1999
- 461980 to 1989
- 431970 to 1979
- 65Before 1970
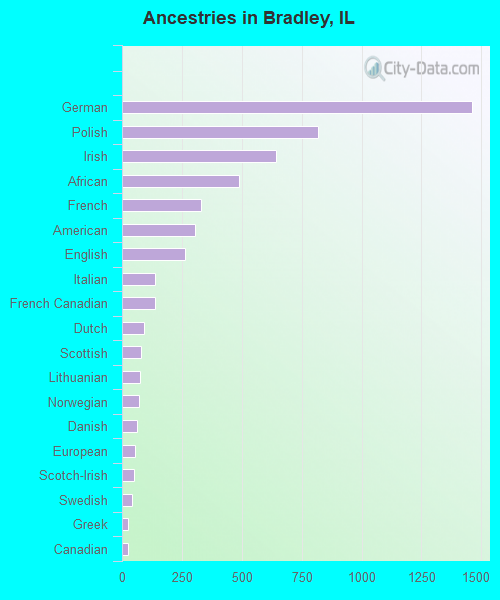
First ancestries reported:
- German: 1,459 (19.2%)
- Polish: 818 (10.8%)
- Irish: 641 (8.4%)
- African: 490 (6.4%)
- French: 331 (4.4%)
- American: 303 (4.0%)
- English: 265 (3.5%)
- Italian: 139 (1.8%)
- French Canadian: 137 (1.8%)
- Dutch: 93 (1.2%)
- Scottish: 78 (1.0%)
- Lithuanian: 75 (1.0%)
- Norwegian: 69 (0.9%)
- Danish: 64 (0.8%)
- European: 53 (0.7%)
- Scotch-Irish: 51 (0.7%)
- Swedish: 41 (0.5%)
- Greek: 24 (0.3%)
- Canadian: 23 (0.3%)
- Czech: 7 (0.09%)
- Belgian: 6 (0.08%)
- Slovak: 5 (0.07%)
- Ghanaian: 5 (0.07%)
- Kenyan: 1 (0.01%)
Most common places of birth for foreign-born residents (%):
| Bradley: | 61.5% (348) |
| Illinois: | 34.7% (626,958) |
| Bradley: | 8.7% (49) |
| Illinois: | 1.2% (21,186) |
| Bradley: | 4.8% (27) |
| Illinois: | 2.2% (40,393) |
| Bradley: | 3.7% (21) |
| Illinois: | 5.2% (93,003) |
| Bradley: | 3.7% (21) |
| Illinois: | 1.0% (18,753) |
| Bradley: | 3.4% (19) |
| Illinois: | 0.3% (4,823) |
| Bradley: | 3.2% (18) |
| Illinois: | 1.3% (22,793) |
| Bradley: | 3.0% (17) |
| Illinois: | 1.1% (19,306) |
| Bradley: | 2.3% (13) |
| Illinois: | 0.1% (2,017) |
| Bradley: | 1.9% (11) |
| Illinois: | 1.2% (22,269) |
Place of birth for U.S.-born residents:
- This state: 12,514
- Other state: 2,170
- Northeast: 177
- Midwest: 860
- South: 725
- West: 365
93.9% of Bradley residents lived in the same house 1 years ago.
Out of people who lived in different houses, 39.4% lived in this county.
Out of people who lived in different counties, 55.4% lived in Illinois.
| Bradley: | 93.9% |
| State average: | 88.3% |
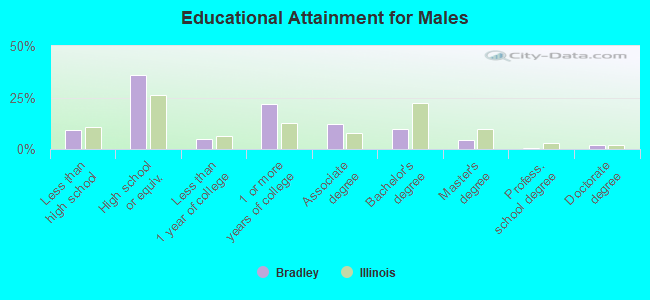
Education attainment for males 25 years and older:
- No schooling: 59
- Nursery to 4th grade: 102
- 5th and 6th grade: 19
- 7th and 8th grade: 54
- 9th grade: 6
- 10th grade: 63
- 11th grade: 38
- 12th grade, no diploma: 112
- High school graduate (or equivalency): 1,737
- Less than 1 year of college: 237
- Some college more than 1 year, no degree: 1,051
- Associate degree: 594
- Bachelor's degree: 466
- Master's degree: 208
- Professional school degree: 18
- Doctorate degree: 90
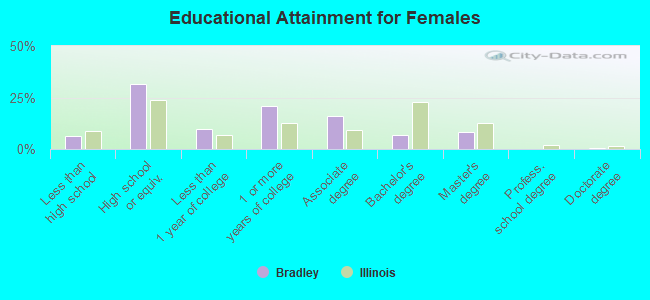
Education attainment for females 25 years and older:
- No schooling: 5
- Nursery to 4th grade: 23
- 5th and 6th grade: 0
- 7th and 8th grade: 28
- 9th grade: 67
- 10th grade: 56
- 11th grade: 38
- 12th grade, no diploma: 123
- High school graduate (or equivalency): 1,638
- Less than 1 year of college: 506
- Some college more than 1 year, no degree: 1,083
- Associate degree: 839
- Bachelor's degree: 365
- Master's degree: 439
- Professional school degree: 0
- Doctorate degree: 17
Housing units in structures:
- One, detached: 4,731
- One, attached: 292
- Two: 228
- 3 or 4: 552
- 5 to 9: 481
- 10 to 19: 21
- 50 or more: 20
- Mobile homes: 10
Housing units lacking complete kitchen facilities in 2022: 1.4%
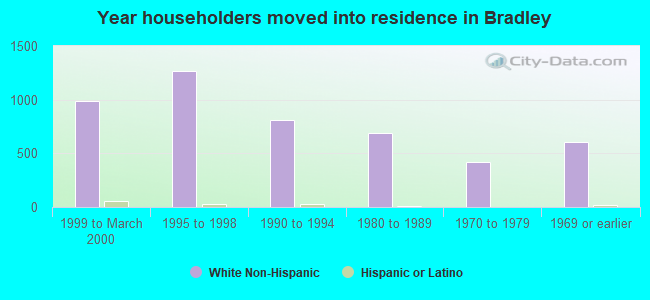
House/condo owner moved in on average 14 years ago
Renter moved in on average 2 years ago
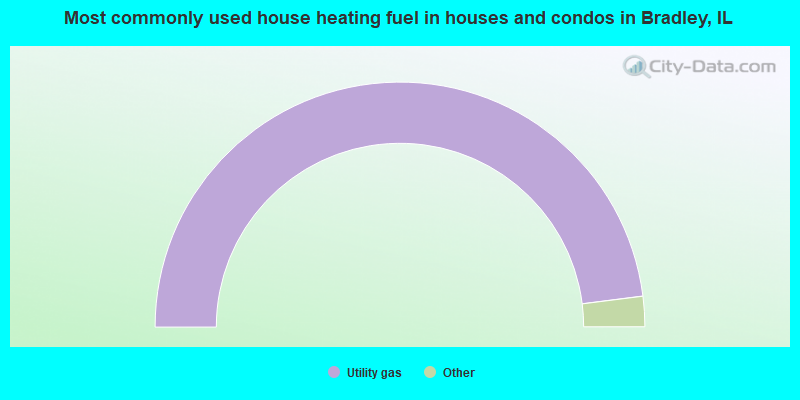
- 96.0%Utility gas
- 3.7%Electricity
- 0.3%No fuel used
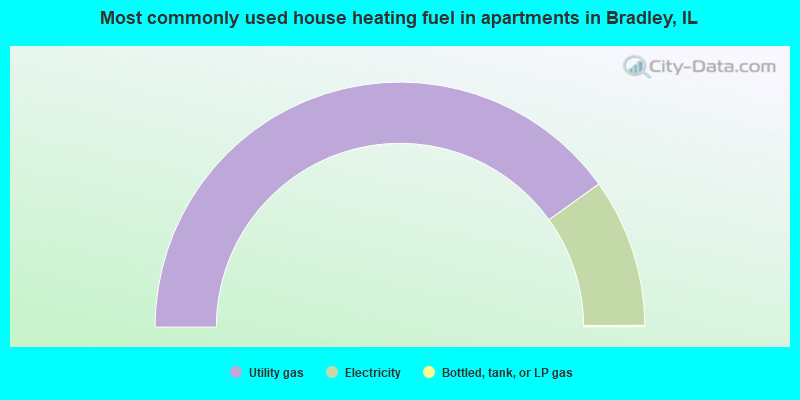
- 80.1%Utility gas
- 19.6%Electricity
- 0.2%Bottled, tank, or LP gas
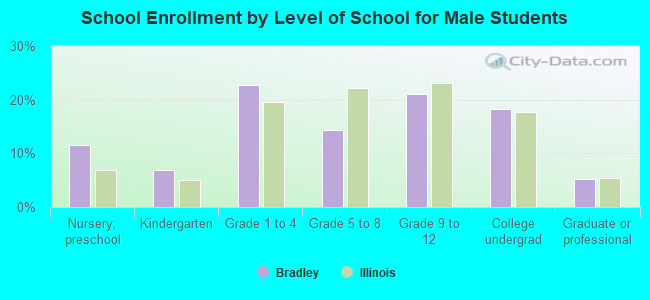
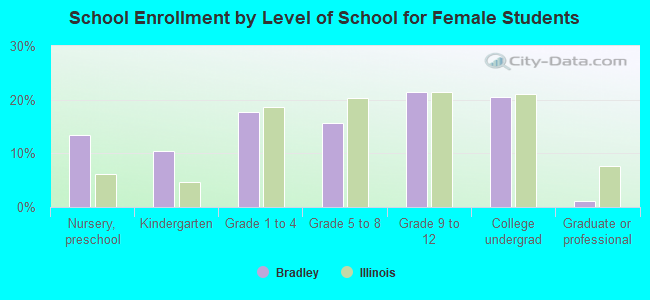
Private vs. public school enrollment:
| Here: | 10.1% |
| Illinois: | 13.3% |
| Here: | 4.6% |
| Illinois: | 9.9% |
| Here: | 9.2% |
| Illinois: | 27.4% |