Bret Harte, CA (California) Houses and Residents
| Bret Harte: | $249,472 |
| California: | $715,900 |
Total population: 5,152 (Urban population: 5,028, Rural population: 0)
Houses: 1,167 (1,155 occupied: 429 owner occupied, 726 renter occupied)
| % of renters here: | 63% |
| State: | 44% |
Housing density: 2,077 houses/condos per square mile
Median price asked for vacant for-sale houses and condos in 2022 in this county: $516,748.
Median contract rent in 2022: $1,048 (lower quartile is $863, upper quartile is $1,227)
Median rent asked for vacant for-rent units in 2022: $1,066
Median gross rent in Bret Harte, CA in 2022: $1,299
Housing units in Bret Harte with a mortgage: 182 (0 second mortgage, 0 home equity loan, 0 both second mortgage and home equity loan)
Houses without a mortgage: 0
Median household income for houses/condos with a mortgage: $98,081
Median household income for apartments without a mortgage: $39,041
Median monthly housing costs: $1,189
Compare current foreclosures near Bret Harte, CA:
| Photo | Address | Area | Beds / Baths | Price | Details |
|---|---|---|---|---|---|

|
#1
Wildwood Dr
Modesto, CA 95350
|
1,679 sq. feet
|
2 baths 3 beds |
$345,000
|
show details |

|
#2
Mayette Ave
Modesto, CA 95351
|
1,080 sq. feet
|
1 baths 2 beds |
$223,000
|
show details |

|
#3
San Martin Dr
Modesto, CA 95358
|
1,452 sq. feet
|
2 baths 3 beds |
$317,200
|
show details |

|
#4
5th St
Modesto, CA 95351
|
1,200 sq. feet
|
1 baths 3 beds |
show details | |

|
#5
Fallen Oak Dr
Modesto, CA 95355
|
3,074 sq. feet
|
3 baths 5 beds |
show details | |

|
#6
Attika St
Ceres, CA 95307
|
2,924 sq. feet
|
2 baths 4 beds |
show details | |

|
#7
Pedras Rd
Turlock, CA 95382
|
1,684 sq. feet
|
1 baths 3 beds |
show details | |

|
#8
1207 Grand Prix Drive
Modesto, CA 95356
|
- sq. feet
|
2 baths 4 beds |
show details | |

|
#9
L St
Patterson, CA 95363
|
1,110 sq. feet
|
1 baths 2 beds |
show details | |

|
#10
Tasmania Way
Modesto, CA 95356
|
1,531 sq. feet
|
2 baths 3 beds |
show details |
| Photo | Address | Area | Beds / Baths | Price | Details |
|---|---|---|---|---|---|

|
#11
Shearwater Dr
Patterson, CA 95363
|
2,377 sq. feet
|
3 baths 4 beds |
show details | |

|
#12
Brooks Ln
Ripon, CA 95366
|
3,262 sq. feet
|
3 baths 4 beds |
show details | |

|
#13
D St
Waterford, CA 95386
|
1,040 sq. feet
|
1 baths 3 beds |
show details | |

|
#14
Lannis Ct
Ripon, CA 95366
|
1,324 sq. feet
|
2 baths 4 beds |
show details | |

|
#15
Hinkley Ave
Oakdale, CA 95361
|
1,318 sq. feet
|
1 baths 2 beds |
show details | |

|
#16
6th St
Hughson, CA 95326
|
- sq. feet
|
2 baths 3 beds |
show details | |

|
#17
Tully Rd
Modesto, CA 95350
|
1,161 sq. feet
|
1 baths 3 beds |
show details | |

|
#18
Pleasant Ave
Ceres, CA 95307
|
1,484 sq. feet
|
2 baths 4 beds |
show details | |

|
#19
Golden Gate Dr
Modesto, CA 95350
|
1,530 sq. feet
|
2 baths 3 beds |
show details | |

|
#20
Liselle Ln
Modesto, CA 95358
|
1,469 sq. feet
|
3 baths 4 beds |
show details |
| Photo | Address | Area | Beds / Baths | Price | Details |
|---|---|---|---|---|---|

|
#21
Miller Ave
Modesto, CA 95354
|
990 sq. feet
|
1 baths 2 beds |
show details | |

|
#22
Emerson Ave
Modesto, CA 95350
|
889 sq. feet
|
1 baths 3 beds |
show details | |

|
#23
Marsh Wren Ct
Patterson, CA 95363
|
1,524 sq. feet
|
2 baths 3 beds |
show details | |

|
#24
W Colony Rd
Ripon, CA 95366
|
2,881 sq. feet
|
3 baths 5 beds |
show details | |

|
#25
Ustick Rd
Modesto, CA 95358
|
1,136 sq. feet
|
2 baths 3 beds |
show details | |

|
#26
Topaz Cir
Hilmar, CA 95324
|
1,386 sq. feet
|
2 baths 3 beds |
show details | |

|
#27
Ronald Ct
Modesto, CA 95350
|
1,607 sq. feet
|
3 baths 3 beds |
show details | |

|
#28
Shady Ln Apt 1022
Turlock, CA 95382
|
1,136 sq. feet
|
2 baths 2 beds |
show details | |

|
#29
Empire Ave
Modesto, CA 95354
|
768 sq. feet
|
1 baths 2 beds |
show details | |

|
#30
American Ave
Hilmar, CA 95324
|
1,518 sq. feet
|
2 baths 3 beds |
show details |
| Photo | Address | Area | Beds / Baths | Price | Details |
|---|---|---|---|---|---|

|
#31
Fleur De Lis Dr
Modesto, CA 95356
|
3,618 sq. feet
|
3 baths 5 beds |
show details | |

|
#32
Sylvan Ave
Modesto, CA 95355
|
1,526 sq. feet
|
2 baths 3 beds |
show details | |

|
#33
Merrifield Ave
Modesto, CA 95356
|
1,373 sq. feet
|
2 baths 3 beds |
show details | |

|
#34
Plum Way
Modesto, CA 95356
|
3,757 sq. feet
|
3 baths 4 beds |
show details | |

|
#35
Orchard Hills Dr
Salida, CA 95368
|
1,564 sq. feet
|
2 baths 4 beds |
show details | |

|
#36
Spring Mountain Ct
Modesto, CA 95356
|
2,104 sq. feet
|
2 baths 4 beds |
show details | |

|
#37
Snyder Ave
Modesto, CA 95356
|
1,832 sq. feet
|
2 baths 3 beds |
show details | |

|
#38
Via Giardiano
Modesto, CA 95357
|
2,038 sq. feet
|
2 baths 3 beds |
show details | |

|
#39
Dandelion Ct
Salida, CA 95368
|
1,477 sq. feet
|
3 baths 4 beds |
show details | |

|
#40
Laguna Seca Ct
Modesto, CA 95356
|
2,415 sq. feet
|
3 baths 3 beds |
show details |
| Photo | Address | Area | Beds / Baths | Price | Details |
|---|---|---|---|---|---|

|
#41
Dezzani Ln
Modesto, CA 95358
|
1,394 sq. feet
|
2 baths 3 beds |
show details | |

|
#42
Wild Rose Dr
Salida, CA 95368
|
1,564 sq. feet
|
2 baths 3 beds |
show details | |

|
#43
Van Dusen Ave
Riverbank, CA 95367
|
1,507 sq. feet
|
2 baths 3 beds |
show details | |

|
#44
Carnival Dr
Turlock, CA 95380
|
2,155 sq. feet
|
3 baths 5 beds |
show details | |

|
#45
Nickels Ct
Riverbank, CA 95367
|
1,314 sq. feet
|
2 baths 3 beds |
show details | |

|
#46
Colony Manor Dr
Riverbank, CA 95367
|
2,340 sq. feet
|
2 baths 4 beds |
show details | |

|
#47
W Springer Dr
Turlock, CA 95382
|
1,472 sq. feet
|
2 baths 4 beds |
show details | |

|
#48
Turpin Ave
Riverbank, CA 95367
|
1,100 sq. feet
|
2 baths 3 beds |
show details | |

|
#49
Woodland Dr
Turlock, CA 95382
|
2,634 sq. feet
|
3 baths 4 beds |
show details | |

|
Check over 1 million property listings on Foreclosure.com!
|
browse all offers | |||


 | Rent vs. buy in SV? (30 replies) |
| Where to live with budget of $1.3M and good schools? (48 replies) |
| Willow Glen, Cambrian, Almaden and our predicaments (26 replies) |
| Good public high schools in Sillicon Valley (37 replies) |
| Almaden : feedback (18 replies) |
| Relocating to Sacramento from East Coast (7 replies) |

Median year apartment built: 1960
Household type by relationship:
Households: 4,918- Male householders: 633 (22 living alone), Female householders: 512 (101 living alone)
582 spouses (582 opposite-sex spouses), 84 unmarried partners, (84 opposite-sex unmarried partners), 2,329 children (2,182 natural, 8 adopted, 137 stepchildren), 334 grandchildren, 85 brothers or sisters, 40 parents, 0 foster children, 129 other relatives, 175 non-relatives
- In group quarters: 9
Size of family households: 133 2-persons, 134 3-persons, 218 4-persons, 259 5-persons, 29 6-persons, 165 7-or-more-persons.
Size of nonfamily households: 124 1-person, 83 2-persons.
1,125 married couples with children.
556 single-parent households (116 men, 440 women).
15.1% of residents of Bret Harte speak English at home.
85.6% of residents speak Spanish at home (54% speak English very well, 12% speak English well, 13% speak English not well, 20% don't speak English at all).
Foreign born population: 1,617 (32.9%)
(25.5% of them are naturalized citizens)
| Here: | 5.2 |
| State: | 6.0 |
| Here: | 4.5 |
| State: | 3.9 |

- Bedrooms in owner-occupied houses and condos in Bret Harte, California
- 0no bedroom
- 101 bedroom
- 1482 bedrooms
- 2253 bedrooms
- 464 bedrooms
- 05+ bedrooms

- Bedrooms in renter-occupied apartments in Bret Harte, California
- 9no bedroom
- 601 bedroom
- 3522 bedrooms
- 2283 bedrooms
- 784 bedrooms
- 05+ bedrooms

- Cars and other vehicles available in Bret Harte in owner-occupied houses/condos
- 0no vehicle
- 1281 vehicle
- 1342 vehicles
- 433 vehicles
- 634 vehicles
- 605+ vehicles

- Cars and other vehicles available in Bret Harte in renter-occupied apartments
- 9no vehicle
- 2281 vehicle
- 3472 vehicles
- 1273 vehicles
- 164 vehicles
- 05+ vehicles

- Rooms in owner-occupied houses in Bret Harte, California
- 01 room
- 02 rooms
- 103 rooms
- 1214 rooms
- 1505 rooms
- 1146 rooms
- 87 rooms
- 98 rooms
- 179+ rooms

- Rooms in renter-occupied apartments in Bret Harte, California
- 91 room
- 92 rooms
- 303 rooms
- 3184 rooms
- 2555 rooms
- 1056 rooms
- 07 rooms
- 08 rooms
- 09+ rooms


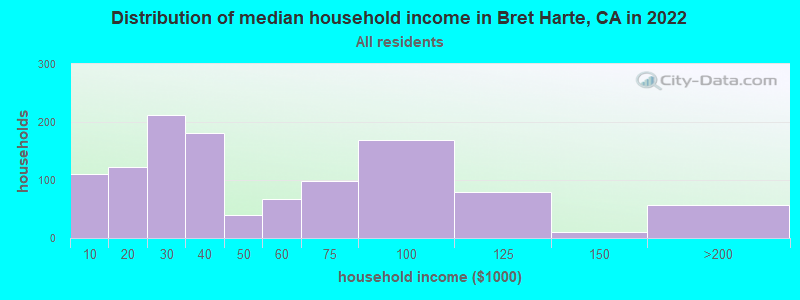
Bret Harte, CA household income distribution

- 111Less than $10,000
- 123$10,000 to $19,999
- 212$20,000 to $29,999
- 181$30,000 to $39,999
- 40$40,000 to $49,999
- 67$50,000 to $59,999
- 98$60,000 to $74,999
- 169$75,000 to $99,999
- 80$100,000 to $124,999
- 11$125,000 to $149,999
- 55$150,000 to $199,999
- 2$200,000 or more
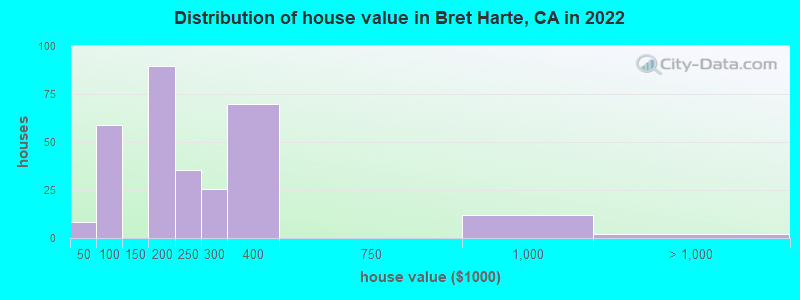
Home value of owner - occupied houses in 2022 in Bret Harte, CA
-
- 8$30,000 to $34,999
- 44$50,000 to $59,999
- 13$80,000 to $89,999
- 85$150,000 to $174,999
- 3$175,000 to $199,999
- 35$200,000 to $249,999
- 25$250,000 to $299,999
- 69$300,000 to $399,999
- 12$750,000 to $999,999
- 2$1,000,000 to $1,499,999
Rent paid by renters in 2022 in Bret Harte, CA
-
- 15$650 to $699
- 3$750 to $799
- 202$800 to $899
- 103$900 to $999
- 236$1,000 to $1,249
- 60$1,250 to $1,499
- 31$1,500 to $1,999
- 7No cash rent


Percentage of workers working in this county: 79.7%
Number of people working at home: 46 (3.3% of all workers)
Travel time to work (commute)
- Less than 5 minutes: 0
- 5 to 9 minutes: 29
- 10 to 14 minutes: 140
- 15 to 19 minutes: 277
- 20 to 24 minutes: 247
- 25 to 29 minutes: 122
- 30 to 34 minutes: 203
- 35 to 39 minutes: 41
- 40 to 44 minutes: 58
- 45 to 59 minutes: 51
- 60 to 89 minutes: 56
- 90 or more minutes: 130
Means of transportation to work:
- Drove a car alone: 874 (67.8%)
- Carpooled: 366 (28.4%)
- Bus or trolley bus: 6 (0.5%)
- Walked: 35 (2.7%)
- Worked at home: 9 (0.7%)

- Unemployment by race in 2022
- Unemployment rate for White non-Hispanic residents
- 14.1%Males
- 20.1%Females
- Unemployment rate for other race residents
- 2.7%Males
- 25.7%Females
- Unemployment rate for two or more race residents
- 14.4%Males
- Unemployment rate for Hispanic or Latino residents
- 8.7%Males
- 9.7%Females

- Year of entry for the foreign-born population in Bret Harte, California
- 2272010 or later
- 6662000 to 2009
- 2751990 to 1999
- 5561980 to 1989
- 3341970 to 1979
- 165Before 1970

First ancestries reported:
- English: 25 (0.6%)
- German: 8 (0.2%)
- Welsh: 7 (0.2%)
Most common places of birth for foreign-born residents (%):
| Bret Harte: | 93.9% (1,468) |
| California: | 37.2% (3,881,193) |
| Bret Harte: | 4.1% (64) |
| California: | 4.2% (440,287) |
Place of birth for U.S.-born residents:
- This state: 3,192
- Other state: 117
- Northeast: 0
- Midwest: 38
- South: 51
- West: 31
93.0% of Bret Harte residents lived in the same house 1 years ago.
Out of people who lived in different houses, 30.2% lived in this county.
Out of people who lived in different counties, 41.7% lived in California.
| Bret Harte: | 93.0% |
| State average: | 88.9% |
Education attainment for males 25 years and older:
- No schooling: 117
- Nursery to 4th grade: 93
- 5th and 6th grade: 129
- 7th and 8th grade: 35
- 9th grade: 74
- 10th grade: 6
- 11th grade: 8
- 12th grade, no diploma: 48
- High school graduate (or equivalency): 466
- Less than 1 year of college: 0
- Some college more than 1 year, no degree: 53
- Associate degree: 0
- Bachelor's degree: 0
- Master's degree: 10
- Professional school degree: 0
- Doctorate degree: 3

Education attainment for females 25 years and older:
- No schooling: 121
- Nursery to 4th grade: 64
- 5th and 6th grade: 284
- 7th and 8th grade: 10
- 9th grade: 25
- 10th grade: 0
- 11th grade: 34
- 12th grade, no diploma: 32
- High school graduate (or equivalency): 535
- Less than 1 year of college: 43
- Some college more than 1 year, no degree: 105
- Associate degree: 19
- Bachelor's degree: 9
- Master's degree: 0
- Professional school degree: 0
- Doctorate degree: 0


Housing units in structures:
- One, detached: 1,037
- One, attached: 93
- Two: 9
- 3 or 4: 9
- 20 to 49: 9
- Mobile homes: 9
House/condo owner moved in on average 19 years ago
Renter moved in on average 6 years ago

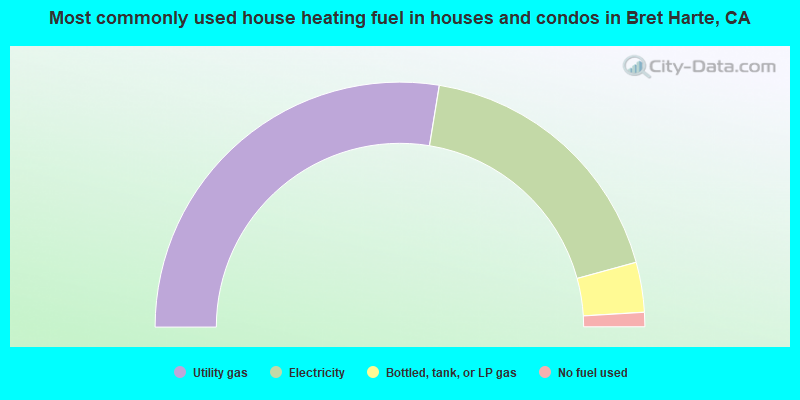
- 55.2%Utility gas
- 36.4%Electricity
- 6.6%Bottled, tank, or LP gas
- 1.9%No fuel used
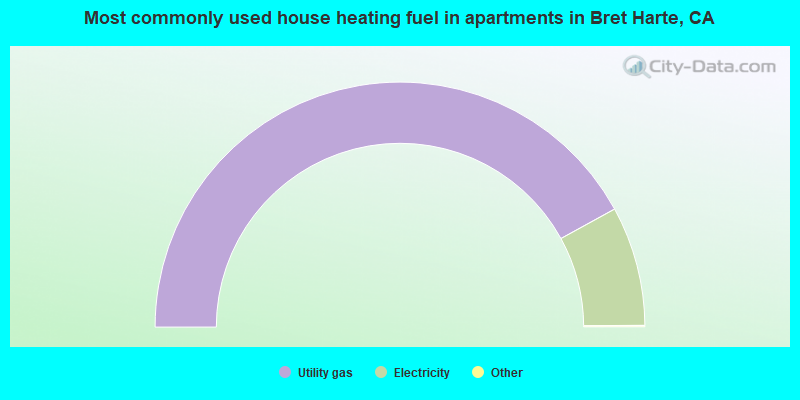
- 84.2%Utility gas
- 15.8%Electricity
Private vs. public school enrollment:
| Here: | 2.0% |
| California: | 10.5% |
| Here: | 2.0% |
| California: | 8.5% |
| Here: | 0.0% |
| California: | 15.9% |


