Brinnon, WA (Washington) Houses and Residents
| Brinnon: | $319,035 |
| Washington: | $569,500 |
Mean price in 2022:
Detached houses: $679,781
Here: $679,781 State: $734,307 Mobile homes: $450,307
Here: $450,307 State: $218,362
Total population: 797 (Urban population: 0, Rural population: 831 (4 farm, 827 nonfarm))
Houses: 1,016 (449 occupied: 391 owner occupied, 58 renter occupied)
| % of renters here: | 13% |
| State: | 36% |
Housing density: 103 houses/condos per square mile
Median price asked for vacant for-sale houses and condos in 2022: $1,898,544.
Median contract rent in 2022: $872 (lower quartile is $624, upper quartile is $910)
Median rent asked for vacant for-rent units in 2022: $872
Median gross rent in Brinnon, WA in 2022: $1,009
Housing units in Brinnon with a mortgage: 209 (2 second mortgage, 0 home equity loan, 2 both second mortgage and home equity loan)
Houses without a mortgage: 17
Median household income for houses/condos with a mortgage: $66,640
Median household income for apartments without a mortgage: $56,231
Median monthly housing costs: $773
Compare current foreclosures near Brinnon, WA:
| Photo | Address | Area | Beds / Baths | Price | Details |
|---|---|---|---|---|---|

|
#1
Duckabush Rd
Brinnon, WA 98320
|
840 sq. feet
|
1 baths 1 beds |
show details | |

|
#2
Hanford Ave
Bremerton, WA 98310
|
1,346 sq. feet
|
1 baths 3 beds |
show details | |

|
#3
Shorewood Dr Apt
Bremerton, WA 98312
|
965 sq. feet
|
1 baths 2 beds |
show details | |

|
#4
NE Valley Oak Dr
Bremerton, WA 98311
|
1,568 sq. feet
|
2 baths 3 beds |
show details | |

|
#5
Old Military Rd NE
Poulsbo, WA 98370
|
1,456 sq. feet
|
2 baths 3 beds |
show details | |

|
#6
Morgan Rd NW
Bremerton, WA 98312
|
976 sq. feet
|
1 baths 2 beds |
show details | |

|
#7
State Highway 303 NE
Bremerton, WA 98311
|
1,397 sq. feet
|
1 baths 3 beds |
show details | |

|
#8
6th St
Bremerton, WA 98312
|
1,296 sq. feet
|
2 baths 1 beds |
show details | |

|
#9
Poindexter Ave W
Bremerton, WA 98312
|
1,126 sq. feet
|
1 baths 3 beds |
show details | |

|
#10
NE Echo Dr
Bremerton, WA 98311
|
1,068 sq. feet
|
1 baths 3 beds |
show details |
| Photo | Address | Area | Beds / Baths | Price | Details |
|---|---|---|---|---|---|

|
#11
Concord Ln NE Ste B202
Bremerton, WA 98311
|
- sq. feet
|
2 baths 2 beds |
show details | |

|
#12
Taft Ave
Bremerton, WA 98312
|
1,753 sq. feet
|
1 baths 3 beds |
show details | |

|
#13
Houston Ave
Bremerton, WA 98312
|
864 sq. feet
|
2 baths 4 beds |
show details | |

|
#14
1st Ave W
Bremerton, WA 98312
|
1,782 sq. feet
|
2 baths 3 beds |
show details | |

|
#15
Ogle Rd NE
Poulsbo, WA 98370
|
1,010 sq. feet
|
1 baths 3 beds |
show details | |

|
#16
NE Rogaland Ct
Poulsbo, WA 98370
|
1,512 sq. feet
|
2 baths 3 beds |
show details | |

|
#17
NE Dusty Rd
Belfair, WA 98528
|
1,128 sq. feet
|
1 baths 3 beds |
show details | |

|
#18
NE Old Belfair Hwy
Belfair, WA 98528
|
1,650 sq. feet
|
2 baths 3 beds |
show details | |

|
#19
Wembly Ave NE
Bremerton, WA 98311
|
1,456 sq. feet
|
1 baths 3 beds |
show details | |

|
#20
NE Fontaine Way
Poulsbo, WA 98370
|
1,682 sq. feet
|
3 baths 4 beds |
show details |
| Photo | Address | Area | Beds / Baths | Price | Details |
|---|---|---|---|---|---|

|
#21
Burwell St
Bremerton, WA 98337
|
1,770 sq. feet
|
1 baths 3 beds |
show details | |

|
#22
Anderson Hill Rd SW
Port Orchard, WA 98367
|
1,454 sq. feet
|
1 baths 4 beds |
show details | |

|
#23
9th St
Bremerton, WA 98337
|
776 sq. feet
|
1 baths 2 beds |
show details | |

|
#24
8th St
Bremerton, WA 98337
|
1,308 sq. feet
|
1 baths 3 beds |
show details | |

|
#25
Aegean Blvd NE
Bremerton, WA 98311
|
1,960 sq. feet
|
2 baths 4 beds |
show details | |

|
#26
Walnut St
Bremerton, WA 98310
|
- sq. feet
|
2 baths 4 beds |
show details | |

|
#27
5th St
Bremerton, WA 98337
|
950 sq. feet
|
1 baths 2 beds |
show details | |

|
#28
NE Trudi Ct
Bremerton, WA 98310
|
1,340 sq. feet
|
2 baths 4 beds |
show details | |

|
#29
NE Admiral Dr
Belfair, WA 98528
|
2,363 sq. feet
|
3 baths 4 beds |
show details | |

|
#30
Sandy Hook Rd NE
Poulsbo, WA 98370
|
3,007 sq. feet
|
3 baths 3 beds |
show details |
| Photo | Address | Area | Beds / Baths | Price | Details |
|---|---|---|---|---|---|

|
#31
NE Conifer Dr
Bremerton, WA 98311
|
920 sq. feet
|
1 baths 3 beds |
show details | |

|
#32
Bloomington Ave
Bremerton, WA 98312
|
1,656 sq. feet
|
1 baths 4 beds |
show details | |

|
#33
NW Holmberg St
Bremerton, WA 98311
|
1,460 sq. feet
|
1 baths 3 beds |
show details | |

|
#34
Brygman St
Bremerton, WA 98312
|
2,132 sq. feet
|
3 baths 3 beds |
show details | |

|
#35
Carr Blvd
Bremerton, WA 98312
|
1,270 sq. feet
|
1 baths 3 beds |
show details | |

|
#36
Sirocco Cir NW
Silverdale, WA 98383
|
1,842 sq. feet
|
2 baths 3 beds |
show details | |

|
#37
Clear Creek Rd NW
Poulsbo, WA 98370
|
2,676 sq. feet
|
2 baths 4 beds |
show details | |

|
#38
NW Anderson Hill Rd
Silverdale, WA 98383
|
1,633 sq. feet
|
2 baths 3 beds |
show details | |

|
#39
NE Vaughn Milton Loop
Poulsbo, WA 98370
|
1,168 sq. feet
|
2 baths 3 beds |
show details | |

|
#40
NW Holmberg St
Bremerton, WA 98311
|
1,460 sq. feet
|
1 baths 3 beds |
show details |
| Photo | Address | Area | Beds / Baths | Price | Details |
|---|---|---|---|---|---|

|
#41
13th St
Bremerton, WA 98337
|
1,216 sq. feet
|
1 baths 3 beds |
show details | |

|
#42
13th St
Bremerton, WA 98337
|
1,216 sq. feet
|
1 baths 3 beds |
show details | |

|
#43
9th St
Bremerton, WA 98337
|
794 sq. feet
|
1 baths 2 beds |
show details | |

|
#44
4th St
Bremerton, WA 98337
|
984 sq. feet
|
1 baths 2 beds |
show details | |

|
#45
Avellana Cir NW
Silverdale, WA 98383
|
1,452 sq. feet
|
2 baths 3 beds |
show details | |

|
#46
NE Arta Ct
Bremerton, WA 98311
|
1,758 sq. feet
|
2 baths 3 beds |
show details | |

|
#47
Clover Blossom Ln NE
Bremerton, WA 98311
|
1,540 sq. feet
|
2 baths 2 beds |
show details | |

|
#48
Bue Rund Loop NE
Poulsbo, WA 98370
|
2,206 sq. feet
|
2 baths 3 beds |
show details | |

|
#49
Leeway Ave NW
Silverdale, WA 98383
|
2,436 sq. feet
|
2 baths 3 beds |
show details | |

|
Check over 1 million property listings on Foreclosure.com!
|
browse all offers | |||

Latest news about housing in Brinnon, WA collected exclusively by city-data.com from local newspapers, TV, and radio stations

 | Washington State relocation questions (55 replies) |
| Washington Weather - Daily Weather pics and reports! (2580 replies) |
| Homebuyers beware: Redfin reports Seattle is beyond a seller’s market (75 replies) |
| Sammamish home - too good to be true?? (38 replies) |
| Help! We are moving on wing and a prayer to the Seattle area (107 replies) |
| Moving to Forks, Washington--need some help. (195 replies) |

Median year apartment built: 1980
Household type by relationship:
Households: 885- Male householders: 217 (51 living alone), Female householders: 223 (110 living alone)
242 spouses (242 opposite-sex spouses), 15 unmarried partners, (15 opposite-sex unmarried partners), 147 children (147 natural, 0 adopted, 0 stepchildren), 16 grandchildren, 0 brothers or sisters, 0 parents, 0 foster children, 9 other relatives, 13 non-relatives
Size of family households: 167 2-persons, 68 3-persons, 20 4-persons, 3 6-persons.
Size of nonfamily households: 171 1-person, 23 2-persons.
32 married couples with children.
10 single-parent households (0 men, 10 women).
95.8% of residents of Brinnon speak English at home.
2.9% of residents speak Spanish at home (68% speak English very well, 32% speak English not well).
2.3% of residents speak other Indo-European language at home (100% speak English very well).
0.2% of residents speak Asian or Pacific Island language at home (100% speak English very well).
Foreign born population: 19 (2.1%)
(15.8% of them are naturalized citizens)
| Here: | 5.2 |
| State: | 6.5 |
| Here: | 3.7 |
| State: | 3.9 |

- Bedrooms in owner-occupied houses and condos in Brinnon, Washington
- 12no bedroom
- 661 bedroom
- 1942 bedrooms
- 1133 bedrooms
- 64 bedrooms
- 05+ bedrooms

- Bedrooms in renter-occupied apartments in Brinnon, Washington
- 4no bedroom
- 131 bedroom
- 302 bedrooms
- 113 bedrooms
- 04 bedrooms
- 05+ bedrooms

- Cars and other vehicles available in Brinnon in owner-occupied houses/condos
- 8no vehicle
- 1341 vehicle
- 1692 vehicles
- 683 vehicles
- 44 vehicles
- 85+ vehicles

- Cars and other vehicles available in Brinnon in renter-occupied apartments
- 0no vehicle
- 321 vehicle
- 142 vehicles
- 73 vehicles
- 54 vehicles
- 05+ vehicles

- Rooms in owner-occupied houses in Brinnon, Washington
- 121 room
- 262 rooms
- 433 rooms
- 594 rooms
- 835 rooms
- 996 rooms
- 247 rooms
- 308 rooms
- 169+ rooms

- Rooms in renter-occupied apartments in Brinnon, Washington
- 41 room
- 02 rooms
- 173 rooms
- 274 rooms
- 85 rooms
- 36 rooms
- 07 rooms
- 08 rooms
- 09+ rooms


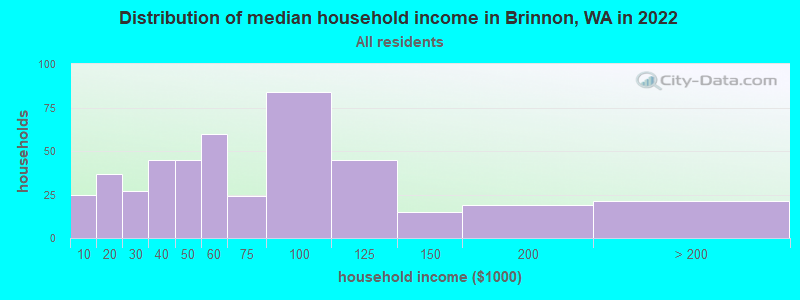
Brinnon, WA household income distribution

- 25Less than $10,000
- 37$10,000 to $19,999
- 27$20,000 to $29,999
- 45$30,000 to $39,999
- 45$40,000 to $49,999
- 60$50,000 to $59,999
- 24$60,000 to $74,999
- 84$75,000 to $99,999
- 45$100,000 to $124,999
- 15$125,000 to $149,999
- 19$150,000 to $199,999
- 21$200,000 or more
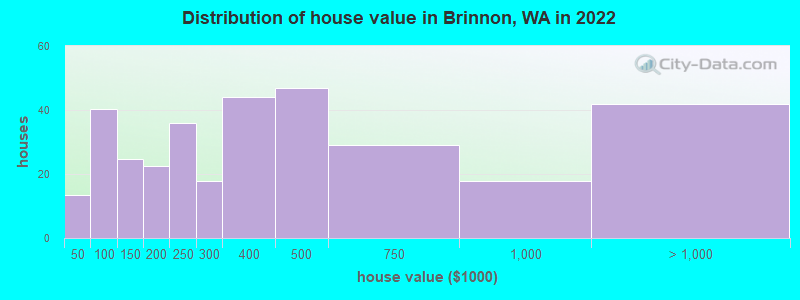
Home value of owner - occupied houses in 2022 in Brinnon, WA
-
- 4Less than $10,000
- 2$10,000 to $14,999
- 3$15,000 to $19,999
- 2$25,000 to $29,999
- 17$50,000 to $59,999
- 15$70,000 to $79,999
- 3$80,000 to $89,999
- 4$90,000 to $99,999
- 7$100,000 to $124,999
- 16$125,000 to $149,999
- 12$150,000 to $174,999
- 10$175,000 to $199,999
- 36$200,000 to $249,999
- 17$250,000 to $299,999
- 43$300,000 to $399,999
- 46$400,000 to $499,999
- 29$500,000 to $749,999
- 17$750,000 to $999,999
- 13$1,000,000 to $1,499,999
- 6$1,500,000 to $1,999,999
- 21$2,000,000 or more
Rent paid by renters in 2022 in Brinnon, WA
-
- 3$300 to $349
- 6$550 to $599
- 2$650 to $699
- 24$800 to $899
- 5$900 to $999
- 5$1,250 to $1,499
- 3$1,500 to $1,999


Percentage of workers working in this county: 55.6%
Number of people working at home: 41 (17.2% of all workers)
Travel time to work (commute)
- Less than 5 minutes: 0
- 5 to 9 minutes: 16
- 10 to 14 minutes: 24
- 15 to 19 minutes: 14
- 20 to 24 minutes: 3
- 25 to 29 minutes: 5
- 30 to 34 minutes: 20
- 35 to 39 minutes: 0
- 40 to 44 minutes: 14
- 45 to 59 minutes: 25
- 60 to 89 minutes: 23
- 90 or more minutes: 39
Means of transportation to work:
- Drove a car alone: 137 (63.4%)
- Carpooled: 42 (19.4%)
- Bus or trolley bus: 2 (0.9%)
- Walked: 17 (7.9%)
- Other means: 5 (2.3%)
- Worked at home: 13 (6.0%)

- Unemployment by race in 2022
- Unemployment rate for White non-Hispanic residents
- 3.7%Males
- 6.4%Females
- Unemployment rate for American Indian and Alaska Native residents
- 100.0%Males
- Unemployment rate for Hispanic or Latino residents
- 100.0%Males

- Year of entry for the foreign-born population in Brinnon, Washington
- 02010 or later
- 02000 to 2009
- 01990 to 1999
- 01980 to 1989
- 01970 to 1979
- 30Before 1970

First ancestries reported:
- English: 80 (21.0%)
- Irish: 64 (16.8%)
- German: 46 (12.1%)
- Italian: 24 (6.3%)
- Scottish: 13 (3.4%)
- Iranian: 12 (3.2%)
- European: 11 (2.9%)
- Norwegian: 11 (2.9%)
- French: 10 (2.6%)
- Portuguese: 10 (2.6%)
- Scotch-Irish: 10 (2.6%)
- American: 4 (1.1%)
- Czech: 4 (1.1%)
- Dutch: 4 (1.1%)
- Danish: 3 (0.8%)
- Welsh: 3 (0.8%)
Most common places of birth for foreign-born residents (%):
| Brinnon: | 63.2% (12) |
| Washington: | 0.9% (10,499) |
| Brinnon: | 26.3% (5) |
| Washington: | 4.1% (47,238) |
Place of birth for U.S.-born residents:
- This state: 317
- Other state: 531
- Northeast: 7
- Midwest: 87
- South: 35
- West: 401
91.0% of Brinnon residents lived in the same house 1 years ago.
Out of people who lived in different houses, 24.5% lived in this county.
Out of people who lived in different counties, 100.0% lived in Washington.
| Brinnon: | 91.0% |
| State average: | 85.2% |
Education attainment for males 25 years and older:
- No schooling: 0
- Nursery to 4th grade: 0
- 5th and 6th grade: 0
- 7th and 8th grade: 0
- 9th grade: 0
- 10th grade: 0
- 11th grade: 4
- 12th grade, no diploma: 4
- High school graduate (or equivalency): 110
- Less than 1 year of college: 100
- Some college more than 1 year, no degree: 78
- Associate degree: 58
- Bachelor's degree: 29
- Master's degree: 31
- Professional school degree: 0
- Doctorate degree: 0

Education attainment for females 25 years and older:
- No schooling: 0
- Nursery to 4th grade: 0
- 5th and 6th grade: 0
- 7th and 8th grade: 0
- 9th grade: 0
- 10th grade: 0
- 11th grade: 22
- 12th grade, no diploma: 4
- High school graduate (or equivalency): 125
- Less than 1 year of college: 14
- Some college more than 1 year, no degree: 66
- Associate degree: 77
- Bachelor's degree: 32
- Master's degree: 31
- Professional school degree: 9
- Doctorate degree: 3


Housing units in structures:
- One, detached: 684
- Two: 23
- Mobile homes: 290
- Boats, RVs, vans, etc.: 18
Median worth of mobile homes: $276,367
Housing units lacking complete kitchen facilities in 2022: 3.2%
House/condo owner moved in on average 12 years ago
Renter moved in on average 6 years ago


- 65.7%Electricity
- 16.1%Wood
- 11.6%Bottled, tank, or LP gas
- 3.4%Utility gas
- 3.2%No fuel used
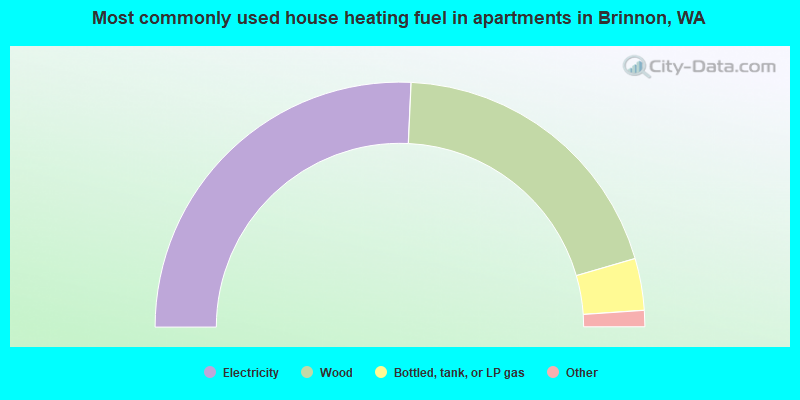
- 52.6%Electricity
- 40.4%Wood
- 7.0%Bottled, tank, or LP gas
Private vs. public school enrollment:
| Here: | 0.0% |
| Washington: | 12.4% |
| Here: | 0.0% |
| Washington: | 9.2% |
| Here: | 0.0% |
| Washington: | 16.5% |


