Brookside Village, TX (Texas) Houses and Residents
| Brookside Village: | $304,185 |
| Texas: | $275,400 |
Mean price in 2022:
Detached houses: $402,307
Here: $402,307 State: $369,058
Total population: 1,569 (All urban)
Houses: 573 (470 occupied: 437 owner occupied, 32 renter occupied)
| % of renters here: | 7% |
| State: | 38% |
Housing density: 272 houses/condos per square mile
Median price asked for vacant for-sale houses and condos in 2022: $754,556.
Median contract rent in 2022: $955 (lower quartile is $910, upper quartile is $1,379)
Median rent asked for vacant for-rent units in 2022: $889
Median gross rent in Brookside Village, TX in 2022: $1,152
Housing units in Brookside Village with a mortgage: 245 (0 second mortgage, 0 home equity loan, 0 both second mortgage and home equity loan)
Houses without a mortgage: 0
Median household income for houses/condos with a mortgage: $111,860
Median household income for apartments without a mortgage: $72,150
Median monthly housing costs: $1,476
Compare current foreclosures near Brookside Village, TX:
| Photo | Address | Area | Beds / Baths | Price | Details |
|---|---|---|---|---|---|

|
#1
Creekview Dr
La Porte, TX 77571
|
2,986 sq. feet
|
2 baths 3 beds |
$169,900
|
show details |

|
#2
W Antone Cir
Houston, TX 77071
|
1,932 sq. feet
|
2 baths 4 beds |
$284,900
|
show details |

|
#3
Briarhurst Dr Apt 35
Houston, TX 77057
|
1,092 sq. feet
|
2 baths 2 beds |
$174,900
|
show details |

|
#4
County Road 557
Alvin, TX 77511
|
1,791 sq. feet
|
2 baths 3 beds |
$282,900
|
show details |

|
#5
Stonefair Ln
Houston, TX 77075
|
2,594 sq. feet
|
3 baths 4 beds |
$291,200
|
show details |

|
#6
Meadowview Dr
Missouri City, TX 77459
|
1,845 sq. feet
|
2 baths 3 beds |
$284,900
|
show details |

|
#7
Belmark St
Houston, TX 77033
|
1,325 sq. feet
|
2 baths 3 beds |
show details | |

|
#8
Arvana St
Houston, TX 77034
|
1,128 sq. feet
|
2 baths 4 beds |
show details | |

|
#9
Black Forest Ln
Rosharon, TX 77583
|
- sq. feet
|
2 baths 4 beds |
show details | |

|
#10
Mount Conness Lane
Rosharon, TX 77583
|
- sq. feet
|
2 baths 4 beds |
show details |
| Photo | Address | Area | Beds / Baths | Price | Details |
|---|---|---|---|---|---|

|
#11
Souris Valley Ct
Houston, TX 77085
|
- sq. feet
|
2 baths 4 beds |
show details | |

|
#12
Sageberry Dr
Houston, TX 77089
|
1,956 sq. feet
|
2 baths 3 beds |
show details | |

|
#13
Kelsey Trail Ln
Houston, TX 77047
|
2,721 sq. feet
|
2 baths 4 beds |
show details | |

|
#14
Wildfire St
League City, TX 77573
|
1,375 sq. feet
|
2 baths 3 beds |
show details | |

|
#15
Kerr St
Houston, TX 77029
|
1,350 sq. feet
|
2 baths 3 beds |
show details | |

|
#16
Bringhurst St
Houston, TX 77020
|
- sq. feet
|
2 baths 2 beds |
show details | |

|
#17
Crow Valley Dr # 706
Missouri City, TX 77459
|
2,052 sq. feet
|
2 baths 4 beds |
show details | |

|
#18
Hillcroft St
Houston, TX 77096
|
2,207 sq. feet
|
2 baths 3 beds |
show details | |

|
#19
Labelle Ln
Houston, TX 77015
|
1,453 sq. feet
|
2 baths 3 beds |
show details | |

|
#20
Peach Mill Ln
Dickinson, TX 77539
|
- sq. feet
|
3 baths 4 beds |
show details |
| Photo | Address | Area | Beds / Baths | Price | Details |
|---|---|---|---|---|---|

|
#21
Village Lake Dr
Missouri City, TX 77459
|
2,392 sq. feet
|
2 baths 4 beds |
show details | |

|
#22
Fairgreen Ln
Houston, TX 77048
|
1,045 sq. feet
|
2 baths 3 beds |
show details | |

|
#23
Bonham Oaks Ln
Houston, TX 77047
|
1,703 sq. feet
|
2 baths 3 beds |
show details | |

|
#24
Ney St
Houston, TX 77034
|
1,240 sq. feet
|
1 baths 3 beds |
show details | |

|
#25
Pine Mill Ct
Pearland, TX 77584
|
3,196 sq. feet
|
4 baths 4 beds |
show details | |

|
#26
Melbourne St
Houston, TX 77022
|
1,705 sq. feet
|
2 baths 4 beds |
show details | |

|
#27
Ridge Rd
Manvel, TX 77578
|
2,243 sq. feet
|
2 baths 3 beds |
show details | |

|
#28
Cindy Ln
Houston, TX 77008
|
1,692 sq. feet
|
2 baths 2 beds |
show details | |

|
#29
Mclean Rd
Pearland, TX 77584
|
1,956 sq. feet
|
2 baths 3 beds |
show details | |

|
#30
Coronation Dr
Houston, TX 77034
|
4,058 sq. feet
|
3 baths 3 beds |
show details |
| Photo | Address | Area | Beds / Baths | Price | Details |
|---|---|---|---|---|---|

|
#31
Mesquite Dr
La Porte, TX 77571
|
2,119 sq. feet
|
3 baths 4 beds |
show details | |

|
#32
Emerald Castle Dr
Rosharon, TX 77583
|
- sq. feet
|
2 baths 3 beds |
show details | |

|
#33
Brimridge Ln
Houston, TX 77048
|
1,457 sq. feet
|
2 baths 3 beds |
show details | |

|
#34
Sage Rd Apt 1403
Houston, TX 77056
|
1,095 sq. feet
|
2 baths 2 beds |
show details | |

|
#35
Alderson St
Houston, TX 77015
|
- sq. feet
|
3 baths 3 beds |
show details | |

|
#36
Raven Ridge Dr
Houston, TX 77053
|
1,419 sq. feet
|
2 baths 3 beds |
show details | |

|
#37
Fountain St
Houston, TX 77051
|
2,390 sq. feet
|
4 baths 4 beds |
show details | |

|
#38
Irene St
Deer Park, TX 77536
|
1,578 sq. feet
|
1 baths 3 beds |
show details | |

|
#39
Sagebud Ln
Houston, TX 77089
|
1,830 sq. feet
|
2 baths 3 beds |
show details | |

|
#40
Hubble Drive
Rosharon, TX 77583
|
- sq. feet
|
3 baths 4 beds |
show details |
| Photo | Address | Area | Beds / Baths | Price | Details |
|---|---|---|---|---|---|

|
#41
Pickerton Dr
Deer Park, TX 77536
|
1,654 sq. feet
|
2 baths 3 beds |
show details | |

|
#42
Durham Manor Ln
Houston, TX 77075
|
2,312 sq. feet
|
3 baths 5 beds |
show details | |

|
#43
Pilgrims Point Dr
Webster, TX 77598
|
1,708 sq. feet
|
2 baths 3 beds |
show details | |

|
#44
Sunrise Harbor Ln
Pearland, TX 77584
|
3,346 sq. feet
|
3 baths 4 beds |
show details | |

|
#45
Regal Oaks Bend Ln
Houston, TX 77047
|
1,206 sq. feet
|
2 baths 3 beds |
show details | |

|
#46
N Brompton Dr
Pearland, TX 77584
|
1,106 sq. feet
|
2 baths 2 beds |
show details | |

|
#47
Sageaspen Ln
Houston, TX 77089
|
2,436 sq. feet
|
2 baths 3 beds |
show details | |

|
#48
Peninsulas Dr
Missouri City, TX 77459
|
3,863 sq. feet
|
3 baths 4 beds |
show details | |

|
#49
Sydnor St
Houston, TX 77020
|
1,426 sq. feet
|
2 baths 3 beds |
show details | |

|
Check over 1 million property listings on Foreclosure.com!
|
browse all offers | |||


 | North Frisco, TX./Field's Project & PGA Frisco HQ (94 replies) |
| Cheap good apartments in houston area (21 replies) |
| League City vs Pearland vs Friendswood (13 replies) |
| Moving this summer to Houston (10 replies) |
| Relocating to Houston (14 replies) |

Median year apartment built: 2012
Household type by relationship:
Households: 1,406- Male householders: 274 (36 living alone), Female householders: 188 (26 living alone)
310 spouses (304 opposite-sex spouses), 33 unmarried partners, (33 opposite-sex unmarried partners), 432 children (392 natural, 0 adopted, 39 stepchildren), 45 grandchildren, 7 brothers or sisters, 43 parents, 3 foster children, 18 other relatives, 48 non-relatives
Size of family households: 162 2-persons, 65 3-persons, 114 4-persons, 10 5-persons, 13 6-persons, 18 7-or-more-persons.
Size of nonfamily households: 65 1-person, 27 2-persons.
162 married couples with children.
10 single-parent households (10 men, 0 women).
69.8% of residents of Brookside Village speak English at home.
28.8% of residents speak Spanish at home (80% speak English very well, 16% speak English well, 4% speak English not well).
1.4% of residents speak other Indo-European language at home (84% speak English very well, 16% speak English well).
0.4% of residents speak other language at home (100% speak English well).
Foreign born population: 158 (11.2%)
(50.6% of them are naturalized citizens)
| Here: | 6.3 |
| State: | 6.3 |
| Here: | 4.1 |
| State: | 4.0 |

- Bedrooms in owner-occupied houses and condos in Brookside Village, Texas
- 16no bedroom
- 71 bedroom
- 272 bedrooms
- 2283 bedrooms
- 1424 bedrooms
- 175+ bedrooms

- Bedrooms in renter-occupied apartments in Brookside Village, Texas
- 0no bedroom
- 01 bedroom
- 272 bedrooms
- 53 bedrooms
- 04 bedrooms
- 05+ bedrooms

- Cars and other vehicles available in Brookside Village in owner-occupied houses/condos
- 7no vehicle
- 501 vehicle
- 1802 vehicles
- 773 vehicles
- 824 vehicles
- 415+ vehicles

- Cars and other vehicles available in Brookside Village in renter-occupied apartments
- 0no vehicle
- 161 vehicle
- 172 vehicles
- 03 vehicles
- 04 vehicles
- 05+ vehicles

- Rooms in owner-occupied houses in Brookside Village, Texas
- 121 room
- 02 rooms
- 43 rooms
- 464 rooms
- 645 rooms
- 1036 rooms
- 767 rooms
- 378 rooms
- 969+ rooms

- Rooms in renter-occupied apartments in Brookside Village, Texas
- 01 room
- 02 rooms
- 03 rooms
- 274 rooms
- 35 rooms
- 06 rooms
- 07 rooms
- 28 rooms
- 09+ rooms


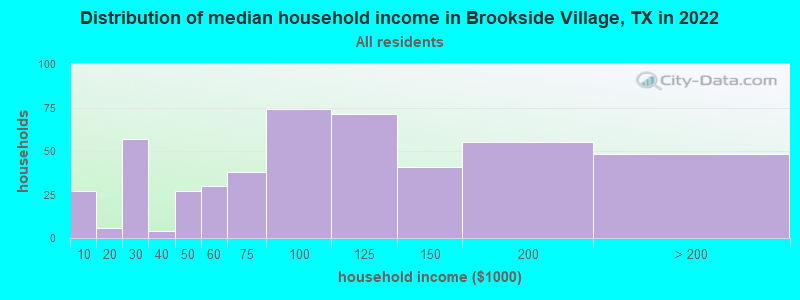
Brookside Village, TX household income distribution

- 27Less than $10,000
- 6$10,000 to $19,999
- 57$20,000 to $29,999
- 4$30,000 to $39,999
- 27$40,000 to $49,999
- 30$50,000 to $59,999
- 38$60,000 to $74,999
- 74$75,000 to $99,999
- 71$100,000 to $124,999
- 41$125,000 to $149,999
- 55$150,000 to $199,999
- 48$200,000 or more
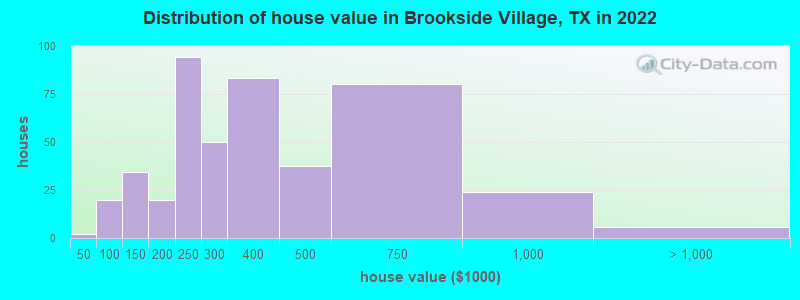
Home value of owner - occupied houses in 2022 in Brookside Village, TX
-
- 1$10,000 to $14,999
- 2$50,000 to $59,999
- 4$70,000 to $79,999
- 11$80,000 to $89,999
- 1$90,000 to $99,999
- 23$100,000 to $124,999
- 11$125,000 to $149,999
- 20$150,000 to $174,999
- 94$200,000 to $249,999
- 50$250,000 to $299,999
- 83$300,000 to $399,999
- 37$400,000 to $499,999
- 80$500,000 to $749,999
- 24$750,000 to $999,999
- 3$1,000,000 to $1,499,999
- 2$2,000,000 or more
Rent paid by renters in 2022 in Brookside Village, TX
-
- 3$800 to $899
- 12$900 to $999
- 12$1,250 to $1,499
- 2No cash rent


Percentage of workers working in this county: 50.4%
Number of people working at home: 108 (15.9% of all workers)
Travel time to work (commute)
- Less than 5 minutes: 2
- 5 to 9 minutes: 38
- 10 to 14 minutes: 55
- 15 to 19 minutes: 130
- 20 to 24 minutes: 66
- 25 to 29 minutes: 21
- 30 to 34 minutes: 97
- 35 to 39 minutes: 2
- 40 to 44 minutes: 58
- 45 to 59 minutes: 40
- 60 to 89 minutes: 58
- 90 or more minutes: 15
Means of transportation to work:
- Drove a car alone: 682 (75.4%)
- Carpooled: 173 (19.1%)
- Bicycle: 12 (1.3%)
- Walked: 22 (2.4%)
- Worked at home: 15 (1.7%)

- Unemployment by race in 2022
- Unemployment rate for White non-Hispanic residents
- 2.9%Males
- 7.8%Females
- Unemployment rate for Black residents
- 39.9%Males
- Unemployment rate for two or more race residents
- 9.4%Females
- Unemployment rate for Hispanic or Latino residents
- 7.8%Females

- Year of entry for the foreign-born population in Brookside Village, Texas
- 72010 or later
- 452000 to 2009
- 481990 to 1999
- 651980 to 1989
- 381970 to 1979
- 48Before 1970

First ancestries reported:
- German: 64 (9.1%)
- English: 28 (4.0%)
- Scottish: 21 (3.0%)
- American: 18 (2.6%)
- European: 17 (2.4%)
- Irish: 14 (2.0%)
- Cajun: 8 (1.1%)
- Italian: 2 (0.3%)
- African: 2 (0.3%)
- Swiss: 2 (0.3%)
- British: 1 (0.1%)
Most common places of birth for foreign-born residents (%):
| Brookside Village: | 61.0% (100) |
| Texas: | 48.4% (2,411,723) |
| Brookside Village: | 9.1% (15) |
| Texas: | 1.8% (87,382) |
| Brookside Village: | 9.1% (15) |
| Texas: | 4.5% (224,455) |
| Brookside Village: | 7.9% (13) |
| Texas: | 1.5% (72,413) |
| Brookside Village: | 5.5% (9) |
| Texas: | 1.3% (62,978) |
| Brookside Village: | 1.8% (3) |
| Texas: | 0.2% (7,897) |
| Brookside Village: | 1.8% (3) |
| Texas: | 0.1% (5,523) |
Place of birth for U.S.-born residents:
- This state: 1,035
- Other state: 213
- Northeast: 26
- Midwest: 26
- South: 90
- West: 61
90.9% of Brookside Village residents lived in the same house 1 years ago.
Out of people who lived in different houses, 21.9% lived in this county.
Out of people who lived in different counties, 51.2% lived in Texas.
| Brookside Village: | 90.9% |
| State average: | 85.7% |
Education attainment for males 25 years and older:
- No schooling: 12
- Nursery to 4th grade: 0
- 5th and 6th grade: 18
- 7th and 8th grade: 10
- 9th grade: 11
- 10th grade: 3
- 11th grade: 3
- 12th grade, no diploma: 0
- High school graduate (or equivalency): 143
- Less than 1 year of college: 82
- Some college more than 1 year, no degree: 86
- Associate degree: 14
- Bachelor's degree: 75
- Master's degree: 11
- Professional school degree: 12
- Doctorate degree: 1

Education attainment for females 25 years and older:
- No schooling: 12
- Nursery to 4th grade: 0
- 5th and 6th grade: 0
- 7th and 8th grade: 0
- 9th grade: 15
- 10th grade: 28
- 11th grade: 2
- 12th grade, no diploma: 14
- High school graduate (or equivalency): 252
- Less than 1 year of college: 40
- Some college more than 1 year, no degree: 63
- Associate degree: 17
- Bachelor's degree: 92
- Master's degree: 25
- Professional school degree: 9
- Doctorate degree: 0


Housing units in structures:
- One, detached: 561
- Mobile homes: 12
Housing units lacking complete kitchen facilities in 2022: 7.7%
House/condo owner moved in on average 12 years ago
Renter moved in on average -1 years ago

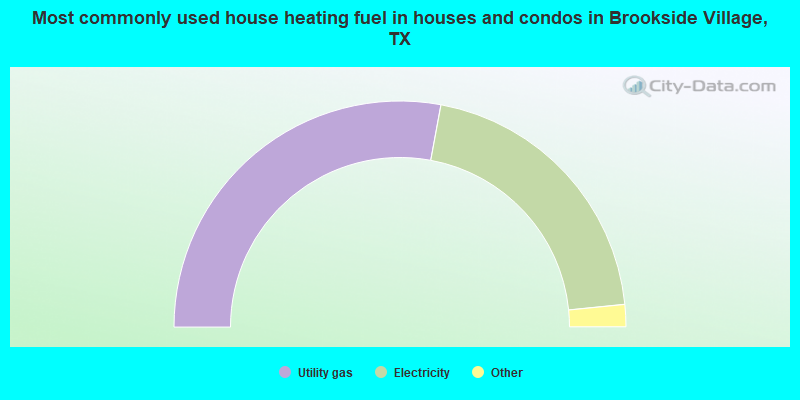
- 56.0%Utility gas
- 41.1%Electricity
- 2.4%Bottled, tank, or LP gas
- 0.5%Other fuel
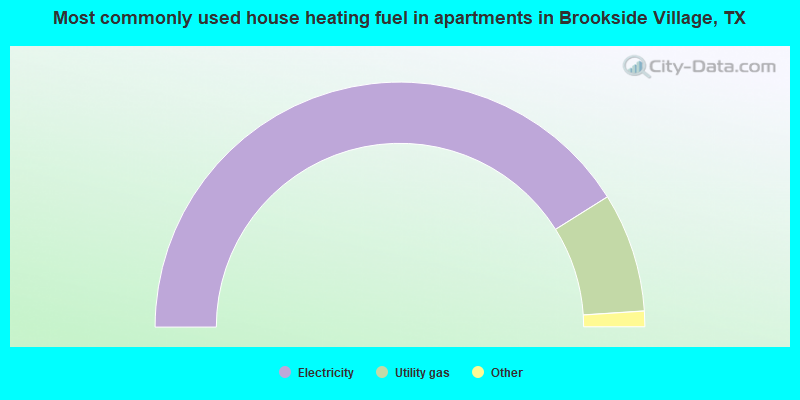
- 83.9%Electricity
- 16.1%Utility gas
Private vs. public school enrollment:
| Here: | 15.6% |
| Texas: | 8.8% |
| Here: | 11.6% |
| Texas: | 8.0% |
| Here: | 18.2% |
| Texas: | 16.2% |


