Bruce, MS (Mississippi) Houses and Residents
| Bruce: | $74,578 |
| Mississippi: | $162,500 |
Mean price in 2022:
Detached houses: $104,567
Here: $104,567 State: $226,494 Mobile homes: $25,825
Here: $25,825 State: $73,695
Total population: 1,912 (Urban population: 0, Rural population: 2,011 (7 farm, 2,004 nonfarm))
Houses: 951 (734 occupied: 333 owner occupied, 408 renter occupied)
| % of renters here: | 55% |
| State: | 30% |
Housing density: 371 houses/condos per square mile
Median price asked for vacant for-sale houses and condos in 2022: $286,469.
Median contract rent in 2022: $421 (lower quartile is $260, upper quartile is $551)
Median rent asked for vacant for-rent units in 2022: $491
Median gross rent in Bruce, MS in 2022: $557
Housing units in Bruce with a mortgage: 110 (0 second mortgage, 0 home equity loan, 0 both second mortgage and home equity loan)
Houses without a mortgage: 5
Median household income for houses/condos with a mortgage: $55,207
Median household income for apartments without a mortgage: $31,166
Median monthly housing costs: $515
Compare current foreclosures near Bruce, MS:
| Photo | Address | Area | Beds / Baths | Price | Details |
|---|---|---|---|---|---|

|
#1
County Road 133
Bruce, MS 38915
|
1,124 sq. feet
|
- baths 3 beds |
show details | |

|
#2
Hasting St
Bruce, MS 38915
|
1,479 sq. feet
|
- baths 2 beds |
show details | |

|
#3
N Mcsweyn Pl
Bruce, MS 38915
|
- sq. feet
|
- baths - beds |
show details | |

|
#4
Annette St
Bruce, MS 38915
|
- sq. feet
|
- baths - beds |
show details | |

|
#5
Cook St
Bruce, MS 38915
|
- sq. feet
|
- baths - beds |
show details | |

|
#6
Cook St
Bruce, MS 38915
|
- sq. feet
|
- baths - beds |
show details | |

|
#7
Highway 9 N
Bruce, MS 38915
|
- sq. feet
|
- baths - beds |
show details | |

|
#8
Lincoln St
Bruce, MS 38915
|
- sq. feet
|
- baths - beds |
show details | |

|
#9
Lincoln St
Bruce, MS 38915
|
- sq. feet
|
- baths - beds |
show details | |

|
#10
County Road 235
Bruce, MS 38915
|
- sq. feet
|
- baths - beds |
show details |
| Photo | Address | Area | Beds / Baths | Price | Details |
|---|---|---|---|---|---|

|
#11
Highway 9 S
Randolph, MS 38864
|
1,942 sq. feet
|
2 baths 3 beds |
$59,900
|
show details |

|
#12
W Veterans Ave
Calhoun City, MS 38916
|
- sq. feet
|
4 baths 4 beds |
$425,000
|
show details |

|
#13
Underwood Dr
Derma, MS 38839
|
- sq. feet
|
- baths - beds |
$49,900
|
show details |

|
#14
County Road 430
Paris, MS 38949
|
1,784 sq. feet
|
1 baths - beds |
show details | |

|
#15
County Road 462
Vardaman, MS 38878
|
1,656 sq. feet
|
- baths 4 beds |
show details | |

|
#16
Highway 341 S
Vardaman, MS 38878
|
1,075 sq. feet
|
- baths 2 beds |
show details | |

|
#17
County Road 20
Houston, MS 38851
|
1,373 sq. feet
|
- baths 4 beds |
show details | |

|
#18
County Road 39
Houston, MS 38851
|
2,320 sq. feet
|
- baths - beds |
show details | |

|
#19
Slim Ln
Randolph, MS 38864
|
- sq. feet
|
- baths - beds |
show details | |

|
#20
County Road 328
Big Creek, MS 38914
|
- sq. feet
|
- baths - beds |
show details |
| Photo | Address | Area | Beds / Baths | Price | Details |
|---|---|---|---|---|---|

|
#21
Hill Ave # B-5
Vardaman, MS 38878
|
- sq. feet
|
- baths - beds |
show details | |

|
#22
County Road 464
Vardaman, MS 38878
|
1,568 sq. feet
|
- baths - beds |
show details | |

|
#23
Highway 9 W
Banner, MS 38913
|
1,581 sq. feet
|
- baths - beds |
show details | |

|
#24
County Road 284
Water Valley, MS 38965
|
- sq. feet
|
- baths - beds |
show details | |

|
#25
Nabors Cir
Vardaman, MS 38878
|
2,016 sq. feet
|
- baths - beds |
show details | |

|
#26
County Road 124
Water Valley, MS 38965
|
- sq. feet
|
- baths - beds |
show details | |

|
#27
County Road 95
Water Valley, MS 38965
|
- sq. feet
|
- baths - beds |
show details | |

|
#28
Hwy 9 South
Randolph, MS 38864
|
- sq. feet
|
- baths - beds |
show details | |

|
#29
County Road 82
Coffeeville, MS 38922
|
- sq. feet
|
- baths - beds |
show details | |

|
#30
Holmes Dr
Vardaman, MS 38878
|
- sq. feet
|
- baths - beds |
show details |
| Photo | Address | Area | Beds / Baths | Price | Details |
|---|---|---|---|---|---|

|
#31
County Road 134
Derma, MS 38839
|
- sq. feet
|
- baths - beds |
show details | |

|
#32
Highway 32 E
Houlka, MS 38850
|
- sq. feet
|
- baths - beds |
show details | |

|
#33
Church Hill Dr
Calhoun City, MS 38916
|
- sq. feet
|
- baths - beds |
show details | |

|
#34
County Road 100
Pittsboro, MS 38951
|
- sq. feet
|
- baths - beds |
show details | |

|
#35
County Road 300
Pittsboro, MS 38951
|
- sq. feet
|
- baths - beds |
show details | |

|
#36
County Road 408
Calhoun City, MS 38916
|
- sq. feet
|
- baths - beds |
show details | |

|
#37
County Road 433
Vardaman, MS 38878
|
- sq. feet
|
- baths - beds |
show details | |

|
#38
32 Hwy East
Houlka, MS 38850
|
- sq. feet
|
- baths - beds |
show details | |

|
#39
Highway 341 N
Houlka, MS 38850
|
- sq. feet
|
- baths - beds |
show details | |

|
#40
Highway 9 W
Banner, MS 38913
|
- sq. feet
|
- baths - beds |
show details |
| Photo | Address | Area | Beds / Baths | Price | Details |
|---|---|---|---|---|---|

|
#41
County Road 311
Calhoun City, MS 38916
|
- sq. feet
|
- baths - beds |
show details | |

|
#42
Parkview Dr
Calhoun City, MS 38916
|
- sq. feet
|
- baths - beds |
show details | |

|
#43
Williams Dr # 16
Calhoun City, MS 38916
|
- sq. feet
|
- baths - beds |
show details | |

|
#44
S Monroe St
Calhoun City, MS 38916
|
- sq. feet
|
- baths - beds |
show details | |

|
#45
County Road 308
Calhoun City, MS 38916
|
- sq. feet
|
- baths - beds |
show details | |

|
#46
W Veterans Blvd
Calhoun City, MS 38916
|
- sq. feet
|
- baths - beds |
show details | |

|
#47
Stewart St
Calhoun City, MS 38916
|
- sq. feet
|
- baths - beds |
show details | |

|
#48
Highway 330
Coffeeville, MS 38922
|
- sq. feet
|
- baths - beds |
show details | |

|
#49
County Road 159
Houlka, MS 38850
|
- sq. feet
|
- baths - beds |
show details | |

|
Check over 1 million property listings on Foreclosure.com!
|
browse all offers | |||

Latest news about housing in Bruce, MS collected exclusively by city-data.com from local newspapers, TV, and radio stations

 | Not just Friday, but Sunday, too, is 'Hell Day', in Madison? (26 replies) |
| A Different sort of Hardware (14 replies) |
| What do Mississippians Think of Californians? (180 replies) |
| Confused about...SOUTH Jackson area (18 replies) |
| Ole Miss for Graduate School. (74 replies) |
| Is the Southern Accent discriminated against? (13 replies) |

Median year apartment built: 1975
Household type by relationship:
Households: 1,513- Male householders: 201 (139 living alone), Female householders: 518 (226 living alone)
193 spouses (193 opposite-sex spouses), 17 unmarried partners, (17 opposite-sex unmarried partners), 453 children (447 natural, 0 adopted, 5 stepchildren), 64 grandchildren, 1 brothers or sisters, 0 parents, 0 foster children, 5 other relatives, 25 non-relatives
- In group quarters: 29
Size of family households: 134 2-persons, 99 3-persons, 100 4-persons, 6 5-persons, 11 6-persons.
Size of nonfamily households: 383 1-person, 9 2-persons.
186 married couples with children.
160 single-parent households (22 men, 138 women).
100.1% of residents of Bruce speak English at home.
| Here: | 5.8 |
| State: | 6.3 |
| Here: | 4.2 |
| State: | 4.8 |

- Bedrooms in owner-occupied houses and condos in Bruce, Mississippi
- 0no bedroom
- 01 bedroom
- 292 bedrooms
- 1933 bedrooms
- 1054 bedrooms
- 75+ bedrooms

- Bedrooms in renter-occupied apartments in Bruce, Mississippi
- 15no bedroom
- 681 bedroom
- 2322 bedrooms
- 823 bedrooms
- 114 bedrooms
- 05+ bedrooms

- Cars and other vehicles available in Bruce in owner-occupied houses/condos
- 14no vehicle
- 1251 vehicle
- 1632 vehicles
- 253 vehicles
- 04 vehicles
- 75+ vehicles

- Cars and other vehicles available in Bruce in renter-occupied apartments
- 112no vehicle
- 1621 vehicle
- 1042 vehicles
- 313 vehicles
- 04 vehicles
- 05+ vehicles

- Rooms in owner-occupied houses in Bruce, Mississippi
- 01 room
- 02 rooms
- 03 rooms
- 454 rooms
- 1115 rooms
- 386 rooms
- 607 rooms
- 388 rooms
- 429+ rooms

- Rooms in renter-occupied apartments in Bruce, Mississippi
- 151 room
- 102 rooms
- 483 rooms
- 2054 rooms
- 805 rooms
- 346 rooms
- 77 rooms
- 98 rooms
- 09+ rooms


Bruce, MS household income distribution

- 69Less than $10,000
- 195$10,000 to $19,999
- 103$20,000 to $29,999
- 70$30,000 to $39,999
- 68$40,000 to $49,999
- 46$50,000 to $59,999
- 86$60,000 to $74,999
- 61$75,000 to $99,999
- 21$100,000 to $124,999
- 8$125,000 to $149,999
- 3$150,000 to $199,999
- 18$200,000 or more

Home value of owner - occupied houses in 2022 in Bruce, MS
-
- 17Less than $10,000
- 4$20,000 to $24,999
- 20$25,000 to $29,999
- 16$30,000 to $34,999
- 10$35,000 to $39,999
- 34$40,000 to $49,999
- 28$50,000 to $59,999
- 33$60,000 to $69,999
- 8$80,000 to $89,999
- 6$90,000 to $99,999
- 63$100,000 to $124,999
- 37$125,000 to $149,999
- 11$175,000 to $199,999
- 2$200,000 to $249,999
- 3$250,000 to $299,999
- 16$300,000 to $399,999

Rent paid by renters in 2022 in Bruce, MS
-
- 12Less than $100
- 19$100 to $149
- 20$150 to $199
- 29$200 to $249
- 15$250 to $299
- 19$300 to $349
- 44$350 to $399
- 48$400 to $449
- 47$450 to $499
- 26$500 to $549
- 42$550 to $599
- 8$600 to $649
- 7$650 to $699
- 7$800 to $899
- 36No cash rent

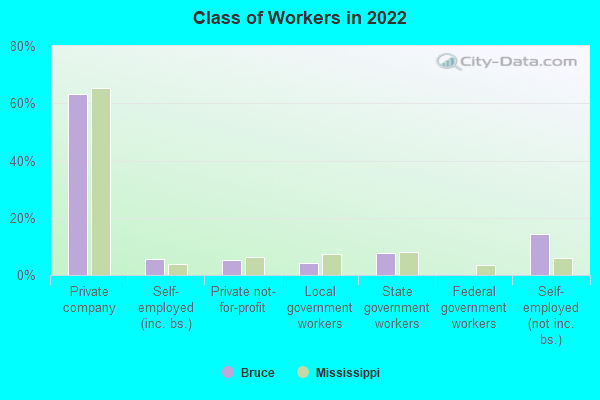
Percentage of workers working in this county: 56.1%
Number of people working at home: 26 (5.1% of all workers)
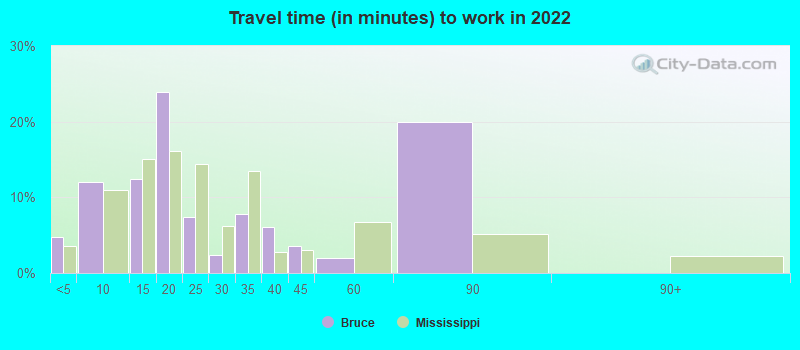
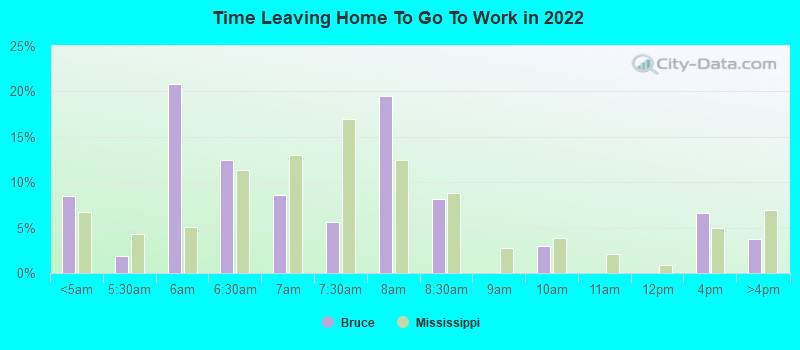
Travel time to work (commute)
- Less than 5 minutes: 82
- 5 to 9 minutes: 61
- 10 to 14 minutes: 24
- 15 to 19 minutes: 51
- 20 to 24 minutes: 18
- 25 to 29 minutes: 0
- 30 to 34 minutes: 34
- 35 to 39 minutes: 11
- 40 to 44 minutes: 64
- 45 to 59 minutes: 65
- 60 to 89 minutes: 87
- 90 or more minutes: 0
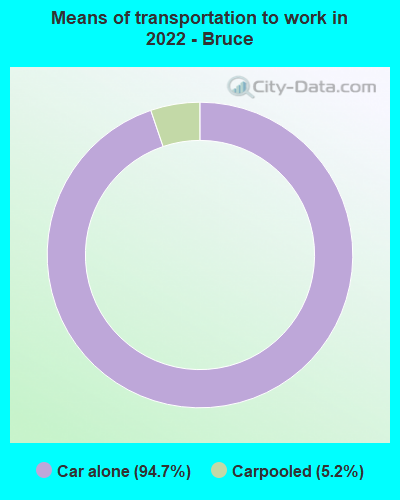
Means of transportation to work:
- Drove a car alone: 1,252 (91.2%)
- Carpooled: 76 (5.5%)
- Walked: 1 (0.1%)
- Worked at home: 26 (1.9%)
- Unemployment by race in 2022
- Unemployment rate for White non-Hispanic residents
- 11.5%Males

- Year of entry for the foreign-born population in Bruce, Mississippi
- 301995 to March 2000
- 21990 to 1994
- 01985 to 1989
- 01980 to 1984
- 01975 to 1979
- 01970 to 1974
- 01965 to 1969
- 0Before 1965

First ancestries reported:
- American: 260 (22.0%)
- English: 188 (15.9%)
- German: 20 (1.7%)
- Welsh: 4 (0.3%)
- Italian: 3 (0.3%)
- Scotch-Irish: 2 (0.2%)
Most common places of birth for foreign-born residents (%):
| Bruce: | 78.1% (25) |
| Mississippi: | 0.6% (235) |
| Bruce: | 15.6% (5) |
| Mississippi: | 0.4% (174) |
| Bruce: | 6.2% (2) |
| Mississippi: | 23.8% (9,484) |
Place of birth for U.S.-born residents:
- This state: 1,366
- Other state: 137
- Northeast: 0
- Midwest: 17
- South: 61
- West: 61
94.2% of Bruce residents lived in the same house 1 years ago.
Out of people who lived in different houses, 32.1% lived in this county.
Out of people who lived in different counties, 100.0% lived in Mississippi.
| Bruce: | 94.2% |
| State average: | 88.9% |
Education attainment for males 25 years and older:
- No schooling: 0
- Nursery to 4th grade: 0
- 5th and 6th grade: 4
- 7th and 8th grade: 0
- 9th grade: 28
- 10th grade: 5
- 11th grade: 20
- 12th grade, no diploma: 3
- High school graduate (or equivalency): 216
- Less than 1 year of college: 23
- Some college more than 1 year, no degree: 68
- Associate degree: 46
- Bachelor's degree: 50
- Master's degree: 8
- Professional school degree: 0
- Doctorate degree: 9

Education attainment for females 25 years and older:
- No schooling: 2
- Nursery to 4th grade: 10
- 5th and 6th grade: 0
- 7th and 8th grade: 24
- 9th grade: 0
- 10th grade: 3
- 11th grade: 26
- 12th grade, no diploma: 19
- High school graduate (or equivalency): 162
- Less than 1 year of college: 2
- Some college more than 1 year, no degree: 116
- Associate degree: 51
- Bachelor's degree: 98
- Master's degree: 29
- Professional school degree: 0
- Doctorate degree: 0


Housing units in structures:
- One, detached: 652
- One, attached: 49
- Two: 110
- 3 or 4: 63
- 5 to 9: 20
- 10 to 19: 7
- 20 to 49: 13
- Mobile homes: 34
Housing units lacking complete kitchen facilities in 2022: 4.3%
House/condo owner moved in on average 24 years ago
Renter moved in on average 7 years ago


- 49.1%Utility gas
- 46.3%Electricity
- 3.4%Bottled, tank, or LP gas
- 1.2%Wood

- 54.9%Electricity
- 45.1%Utility gas
Private vs. public school enrollment:
| Here: | 6.8% |
| Mississippi: | 16.1% |
| Here: | 9.8% |
| Mississippi: | 14.6% |
| Here: | 0.0% |
| Mississippi: | 12.8% |


