Brushy Creek, SC (South Carolina) Houses and Residents
| Brushy Creek: | $315,534 |
| South Carolina: | $254,600 |
Total population: 21,300 (Urban population: 9,978, Rural population: 9,687 (72 farm, 9,615 nonfarm))
Houses: 7,744 (7,232 occupied: 6,285 owner occupied, 947 renter occupied)
| % of renters here: | 13% |
| State: | 28% |
Housing density: 114 houses/condos per square mile
Median price asked for vacant for-sale houses and condos in 2022 in this county: $272,098.
Median contract rent in 2022: $697 (lower quartile is $597, upper quartile is $902)
Median rent asked for vacant for-rent units in 2022: $726
Median gross rent in Brushy Creek, SC in 2022: $914
Housing units in Brushy Creek with a mortgage: 3,307 (536 second mortgage, 405 home equity loan, 0 both second mortgage and home equity loan)
Houses without a mortgage: 1,211
Compare current foreclosures near Brushy Creek, SC:
| Photo | Address | Area | Beds / Baths | Price | Details |
|---|---|---|---|---|---|

|
#1
Parsons Rd
Fountain Inn, SC 29644
|
2,857 sq. feet
|
3 baths 5 beds |
$445,000
|
show details |

|
#2
Blue Ridge Ave
Belton, SC 29627
|
1,568 sq. feet
|
2 baths 3 beds |
$184,900
|
show details |

|
#3
Blue Heron Cir
Simpsonville, SC 29680
|
2,096 sq. feet
|
2 baths 3 beds |
$320,000
|
show details |

|
#4
Oak Dr
Greenville, SC 29611
|
1,003 sq. feet
|
1 baths 3 beds |
show details | |

|
#5
Lucille Ave
Greenville, SC 29605
|
384 sq. feet
|
1 baths 2 beds |
show details | |

|
#6
Coventry Ln
Greenville, SC 29609
|
1,737 sq. feet
|
1 baths 3 beds |
show details | |

|
#7
S Plainview Dr
Greenville, SC 29611
|
1,550 sq. feet
|
2 baths 3 beds |
show details | |

|
#8
Runnymeade Rd
Pickens, SC 29671
|
1,410 sq. feet
|
2 baths 3 beds |
show details | |

|
#9
Jadewood Dr
Williamston, SC 29697
|
1,995 sq. feet
|
2 baths 3 beds |
show details | |

|
#10
Zion Church Rd
Easley, SC 29642
|
987 sq. feet
|
2 baths 2 beds |
show details |
| Photo | Address | Area | Beds / Baths | Price | Details |
|---|---|---|---|---|---|

|
#11
S Green St
Williamston, SC 29697
|
1,557 sq. feet
|
2 baths 3 beds |
show details | |

|
#12
N Charles Dr
Greenville, SC 29605
|
- sq. feet
|
2 baths 3 beds |
show details | |

|
#13
Harris Bridge Rd
Anderson, SC 29621
|
2,618 sq. feet
|
3 baths 3 beds |
show details | |

|
#14
Garrison Rd
Simpsonville, SC 29681
|
- sq. feet
|
3 baths 4 beds |
show details | |

|
#15
Ashington Dr
Simpsonville, SC 29680
|
3,190 sq. feet
|
3 baths 5 beds |
show details | |

|
#16
W Lee Rd
Taylors, SC 29687
|
1,199 sq. feet
|
2 baths 3 beds |
show details | |

|
#17
Saddlemount Ln
Simpsonville, SC 29680
|
1,202 sq. feet
|
2 baths 3 beds |
show details | |

|
#18
Skipping Stone Ct
Simpsonville, SC 29681
|
2,857 sq. feet
|
2 baths 4 beds |
show details | |

|
#19
Faris Cir
Greenville, SC 29605
|
2,391 sq. feet
|
2 baths 4 beds |
show details | |

|
#20
Rusty Ct
Simpsonville, SC 29680
|
2,000 sq. feet
|
2 baths 3 beds |
show details |
| Photo | Address | Area | Beds / Baths | Price | Details |
|---|---|---|---|---|---|

|
#21
E Hills Dr
Greer, SC 29650
|
1,768 sq. feet
|
2 baths 3 beds |
show details | |

|
#22
Lily St
Greenville, SC 29617
|
1,512 sq. feet
|
1 baths 3 beds |
show details | |

|
#23
Cagle St
Greenville, SC 29601
|
960 sq. feet
|
1 baths 3 beds |
show details | |

|
#24
W Beattie St
Liberty, SC 29657
|
832 sq. feet
|
1 baths 2 beds |
show details | |

|
#25
Overton Ave
Greenville, SC 29617
|
1,932 sq. feet
|
2 baths 3 beds |
show details | |

|
#26
Standing Springs Rd
Greenville, SC 29605
|
2,234 sq. feet
|
2 baths 3 beds |
show details | |

|
#27
Glen Martin Ln
Piedmont, SC 29673
|
1,352 sq. feet
|
2 baths 3 beds |
show details | |

|
#28
Sanders Rd
Central, SC 29630
|
1,025 sq. feet
|
1 baths 3 beds |
show details | |

|
#29
Fieldstone Pl
Greenville, SC 29615
|
2,324 sq. feet
|
3 baths 5 beds |
show details | |

|
#30
Bivens St
Pickens, SC 29671
|
1,126 sq. feet
|
1 baths 3 beds |
show details |
| Photo | Address | Area | Beds / Baths | Price | Details |
|---|---|---|---|---|---|

|
#31
Great Oaks Way
Simpsonville, SC 29680
|
1,143 sq. feet
|
2 baths 3 beds |
show details | |

|
#32
Kavanagh Ct
Greenville, SC 29611
|
1,510 sq. feet
|
2 baths 3 beds |
show details | |

|
#33
3rd St
Greenville, SC 29611
|
1,372 sq. feet
|
3 baths 5 beds |
show details | |

|
#34
Heritage Club Dr
Greenville, SC 29615
|
1,572 sq. feet
|
2 baths 2 beds |
show details | |

|
#35
Barley Barn Ct
Greenville, SC 29607
|
2,086 sq. feet
|
2 baths 3 beds |
show details | |

|
#36
Watson Ave
Greenville, SC 29601
|
1,575 sq. feet
|
2 baths 3 beds |
show details | |

|
#37
Bates Rd
Liberty, SC 29657
|
1,680 sq. feet
|
2 baths 3 beds |
show details | |

|
#38
Brookhaven Way
Simpsonville, SC 29681
|
1,594 sq. feet
|
2 baths 3 beds |
show details | |

|
#39
Green Fern Dr
Greenville, SC 29611
|
2,116 sq. feet
|
2 baths 3 beds |
show details | |

|
#40
Hedgepath St
Liberty, SC 29657
|
952 sq. feet
|
1 baths 2 beds |
show details |
| Photo | Address | Area | Beds / Baths | Price | Details |
|---|---|---|---|---|---|

|
#41
Robertson Rd
Taylors, SC 29687
|
2,468 sq. feet
|
2 baths 3 beds |
show details | |

|
#42
Cheyenne Dr
Simpsonville, SC 29680
|
1,162 sq. feet
|
2 baths 3 beds |
show details | |

|
#43
Cherrylane Dr
Greenville, SC 29617
|
1,316 sq. feet
|
2 baths 3 beds |
show details | |

|
#44
Apa Way
Greenville, SC 29611
|
1,320 sq. feet
|
2 baths 3 beds |
show details | |

|
#45
Stonehaven Dr
Greenville, SC 29607
|
4,273 sq. feet
|
2 baths 4 beds |
show details | |

|
#46
Hunts Bridge Rd
Easley, SC 29640
|
1,530 sq. feet
|
2 baths 3 beds |
show details | |

|
#47
E Beattie St
Liberty, SC 29657
|
832 sq. feet
|
1 baths 2 beds |
show details | |

|
#48
Saint Johns St
Simpsonville, SC 29680
|
1,859 sq. feet
|
2 baths 3 beds |
show details | |

|
#49
Parkdale Dr
Greenville, SC 29611
|
1,299 sq. feet
|
2 baths 3 beds |
show details | |

|
Check over 1 million property listings on Foreclosure.com!
|
browse all offers | |||

Household type by relationship:
Households: 184,362- In family households: 158,545 (35,075 male householders, 16,847 female householders)
37,725 spouses, 53,108 children (48,665 natural, 1,359 adopted, 3,084 stepchildren), 5,481 grandchildren, 1,620 brothers or sisters, 1,577 parents, foster children, 2,210 other relatives, 3,937 non-relatives
- In nonfamily households: 25,817 (10,006 male householders (8,208 living alone)), 11,901 female householders (10,518 living alone)), 3,910 nonrelatives
- In group quarters: 2,764 (1,617 institutionalized population)
25,827 married couples with children.
10,161 single-parent households (2,300 men, 7,861 women).
96.8% of residents of Brushy Creek speak English at home.
1.5% of residents speak Spanish at home (47% speak English very well, 16% speak English well, 36% speak English not well).
1.4% of residents speak other Indo-European language at home (78% speak English very well, 8% speak English well, 14% speak English not well).
0.1% of residents speak Asian or Pacific Island language at home (70% speak English very well, 30% speak English well).
0.2% of residents speak other language at home (60% speak English very well, 23% speak English well, 17% speak English not well).
Foreign born population: 758 (3.0%)
(79.7% of them are naturalized citizens)
| Here: | 7.7 |
| State: | 6.4 |
| Here: | 4.3 |
| State: | 4.5 |

- Bedrooms in owner-occupied houses and condos in Brushy Creek, South Carolina
- 16no bedroom
- 631 bedroom
- 1,0082 bedrooms
- 4,0633 bedrooms
- 9964 bedrooms
- 1395+ bedrooms

- Bedrooms in renter-occupied apartments in Brushy Creek, South Carolina
- 19no bedroom
- 891 bedroom
- 4632 bedrooms
- 3003 bedrooms
- 674 bedrooms
- 95+ bedrooms

- Cars and other vehicles available in Brushy Creek in owner-occupied houses/condos
- 149no vehicle
- 1,1371 vehicle
- 3,1112 vehicles
- 1,3273 vehicles
- 4344 vehicles
- 1275+ vehicles

- Cars and other vehicles available in Brushy Creek in renter-occupied apartments
- 96no vehicle
- 4161 vehicle
- 3032 vehicles
- 1023 vehicles
- 214 vehicles
- 95+ vehicles

- Rooms in owner-occupied houses in Brushy Creek, South Carolina
- 01 room
- 232 rooms
- 693 rooms
- 5994 rooms
- 1,3855 rooms
- 1,6486 rooms
- 1,2067 rooms
- 7308 rooms
- 6259+ rooms

- Rooms in renter-occupied apartments in Brushy Creek, South Carolina
- 191 room
- 332 rooms
- 653 rooms
- 3244 rooms
- 2365 rooms
- 1596 rooms
- 797 rooms
- 138 rooms
- 199+ rooms


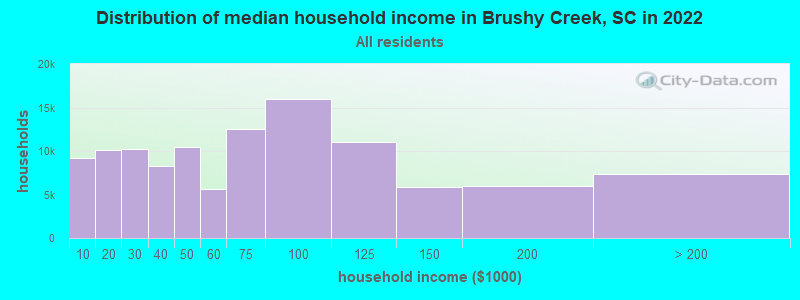
Brushy Creek, SC household income distribution

- 9,184Less than $10,000
- 10,068$10,000 to $19,999
- 10,264$20,000 to $29,999
- 8,321$30,000 to $39,999
- 10,494$40,000 to $49,999
- 5,679$50,000 to $59,999
- 12,509$60,000 to $74,999
- 15,963$75,000 to $99,999
- 11,014$100,000 to $124,999
- 5,874$125,000 to $149,999
- 5,968$150,000 to $199,999
- 7,301$200,000 or more
Percentage of workers working in this county: 24.2%
Number of people working at home: 879 (7.1% of all workers)
Travel time to work (commute)
- Less than 5 minutes: 291
- 5 to 9 minutes: 749
- 10 to 14 minutes: 735
- 15 to 19 minutes: 1,667
- 20 to 24 minutes: 2,131
- 25 to 29 minutes: 1,012
- 30 to 34 minutes: 1,821
- 35 to 39 minutes: 276
- 40 to 44 minutes: 261
- 45 to 59 minutes: 364
- 60 to 89 minutes: 168
- 90 or more minutes: 226
Means of transportation to work:
- Drove a car alone: 8,577 (86.7%)
- Carpooled: 1,035 (10.5%)
- Walked: 72 (0.7%)
- Other means: 17 (0.2%)
- Worked at home: 195 (2.0%)


- Year of entry for the foreign-born population in Brushy Creek, South Carolina
- 271995 to March 2000
- 441990 to 1994
- 651985 to 1989
- 81980 to 1984
- 241975 to 1979
- 191970 to 1974
- 151965 to 1969
- 50Before 1965
Most common places of birth for foreign-born residents (%):
| Brushy Creek: | 15.5% (39) |
| South Carolina: | 4.4% (5,130) |
| Brushy Creek: | 13.5% (34) |
| South Carolina: | 27.3% (31,719) |
| Brushy Creek: | 10.3% (26) |
| South Carolina: | 4.4% (5,108) |
| Brushy Creek: | 10.3% (26) |
| South Carolina: | 4.8% (5,512) |
| Brushy Creek: | 6.0% (15) |
| South Carolina: | 1.0% (1,130) |
| Brushy Creek: | 4.8% (12) |
| South Carolina: | 6.8% (7,873) |
| Brushy Creek: | 4.8% (12) |
| South Carolina: | 1.0% (1,145) |
| Brushy Creek: | 4.4% (11) |
| South Carolina: | 0.3% (381) |
| Brushy Creek: | 4.4% (11) |
| South Carolina: | 0.3% (298) |
| Brushy Creek: | 3.6% (9) |
| South Carolina: | 0.8% (906) |
| Brushy Creek: | 3.2% (8) |
| South Carolina: | 0.5% (555) |
| Brushy Creek: | 2.8% (7) |
| South Carolina: | 5.9% (6,890) |
| Brushy Creek: | 2.8% (7) |
| South Carolina: | 0.9% (1,082) |
| Brushy Creek: | 2.8% (7) |
| South Carolina: | 0.4% (425) |
| Brushy Creek: | 2.4% (6) |
| South Carolina: | 0.7% (795) |
| Brushy Creek: | 2.4% (6) |
| South Carolina: | 1.8% (2,125) |
| Brushy Creek: | 2.4% (6) |
| South Carolina: | 0.5% (585) |
| Brushy Creek: | 2.0% (5) |
| South Carolina: | 1.3% (1,526) |
| Brushy Creek: | 2.0% (5) |
| South Carolina: | 0.3% (295) |
Place of birth for U.S.-born residents:
- This state: 13,483
- Other state: 5,777
- Northeast: 992
- Midwest: 1,080
- South: 3,430
- West: 275
59% of Brushy Creek residents lived in the same house 5 years ago.
Out of people who lived in different houses, 33% lived in this county.
Out of people who lived in different counties, 71% lived in South Carolina.
Education attainment for males 25 years and older:
- No schooling: 32
- Nursery to 4th grade: 5
- 5th and 6th grade: 86
- 7th and 8th grade: 235
- 9th grade: 170
- 10th grade: 265
- 11th grade: 182
- 12th grade, no diploma: 156
- High school graduate (or equivalency): 1,886
- Less than 1 year of college: 484
- Some college more than 1 year, no degree: 923
- Associate degree: 475
- Bachelor's degree: 1,101
- Master's degree: 243
- Professional school degree: 49
- Doctorate degree: 38

Education attainment for females 25 years and older:
- No schooling: 0
- Nursery to 4th grade: 31
- 5th and 6th grade: 70
- 7th and 8th grade: 308
- 9th grade: 196
- 10th grade: 220
- 11th grade: 180
- 12th grade, no diploma: 243
- High school graduate (or equivalency): 2,267
- Less than 1 year of college: 499
- Some college more than 1 year, no degree: 897
- Associate degree: 645
- Bachelor's degree: 862
- Master's degree: 283
- Professional school degree: 18
- Doctorate degree: 6


Housing units in structures:
- One, detached: 5,560
- One, attached: 59
- Two: 67
- 3 or 4: 35
- 5 to 9: 32
- 10 to 19: 13
- 20 to 49: 30
- 50 or more: 12
- Mobile homes: 1,936
Median worth of mobile homes: $64,405
Housing units lacking complete kitchen facilities: 0.3%

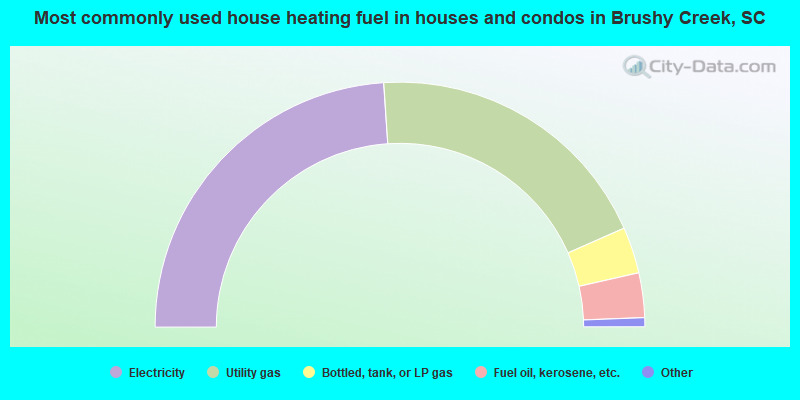
- 47.9%Electricity
- 38.9%Utility gas
- 6.1%Bottled, tank, or LP gas
- 5.9%Fuel oil, kerosene, etc.
- 0.9%Wood
- 0.4%No fuel used
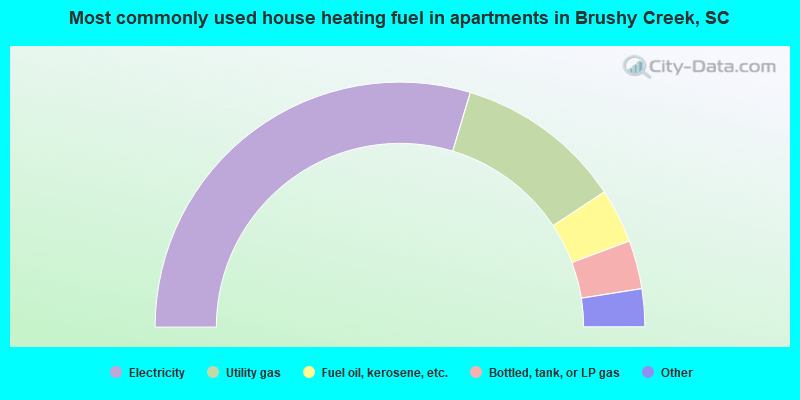
- 59.3%Electricity
- 22.1%Utility gas
- 7.2%Fuel oil, kerosene, etc.
- 6.4%Bottled, tank, or LP gas
- 2.3%Wood
- 1.9%No fuel used
- 0.7%Solar energy
Private vs. public school enrollment:
| Here: | 9.6% |
| South Carolina: | 9.2% |
| Here: | 5.9% |
| South Carolina: | 8.1% |
| Here: | 21.6% |
| South Carolina: | 20.3% |


