Brushy Creek, TX (Texas) Houses and Residents
| Brushy Creek: | $524,799 |
| Texas: | $275,400 |
Total population: 21,764 (Urban population: 15,728, Rural population: 170 (all nonfarm))
Houses: 8,608 (8,426 occupied: 6,423 owner occupied, 2,143 renter occupied)
| % of renters here: | 25% |
| State: | 38% |
Housing density: 988 houses/condos per square mile
Median price asked for vacant for-sale houses and condos in 2022: $1,678,629.
Median contract rent in 2022: $1,945 (lower quartile is $1,617, upper quartile is over $2,000)
Median rent asked for vacant for-rent units in 2022: $760
Median gross rent in Brushy Creek, TX in 2022: over $2,000
Housing units in Brushy Creek with a mortgage: 3,987 (220 second mortgage, 9 home equity loan, 175 both second mortgage and home equity loan)
Houses without a mortgage: 36
Median household income for houses/condos with a mortgage: $165,715
Median household income for apartments without a mortgage: $116,372
Median monthly housing costs: $1,983
Compare current foreclosures near Brushy Creek, TX:
| Photo | Address | Area | Beds / Baths | Price | Details |
|---|---|---|---|---|---|

|
#1
N Redondo Dr
Austin, TX 78721
|
972 sq. feet
|
1 baths 3 beds |
$339,900
|
show details |

|
#2
Buttercup Creek Blvd Unit 602
Cedar Park, TX 78613
|
1,336 sq. feet
|
2 baths 3 beds |
show details | |

|
#3
Countryside Ct
Georgetown, TX 78626
|
2,016 sq. feet
|
2 baths 4 beds |
show details | |

|
#4
Dove Haven Dr
Pflugerville, TX 78660
|
1,346 sq. feet
|
2 baths 3 beds |
show details | |

|
#5
Alamar Walk
Leander, TX 78641
|
1,927 sq. feet
|
2 baths 4 beds |
show details | |

|
#6
Strata Rd
Manor, TX 78653
|
1,735 sq. feet
|
2 baths 4 beds |
show details | |

|
#7
Syrah Court
Leander, TX 78641
|
1,985 sq. feet
|
2 baths 4 beds |
show details | |

|
#8
Stevenage Dr
Pflugerville, TX 78660
|
2,800 sq. feet
|
2 baths 4 beds |
show details | |

|
#9
Tolcarne Dr
Hutto, TX 78634
|
1,626 sq. feet
|
2 baths 4 beds |
show details | |

|
#10
Rosano St
Round Rock, TX 78665
|
2,846 sq. feet
|
4 baths 4 beds |
show details |
| Photo | Address | Area | Beds / Baths | Price | Details |
|---|---|---|---|---|---|

|
#11
Raintree Path
Round Rock, TX 78664
|
2,052 sq. feet
|
2 baths 4 beds |
show details | |

|
#12
Liberton Ln
Austin, TX 78754
|
- sq. feet
|
2 baths 3 beds |
show details | |

|
#13
Ritter Dr
Cedar Park, TX 78613
|
2,712 sq. feet
|
2 baths 3 beds |
show details | |

|
#14
S West Dr
Leander, TX 78641
|
1,163 sq. feet
|
2 baths 3 beds |
show details | |

|
#15
Hilltop Dr
Leander, TX 78641
|
1,274 sq. feet
|
2 baths 3 beds |
show details | |

|
#16
Exposition Blvd
Austin, TX 78703
|
2,156 sq. feet
|
2 baths 3 beds |
show details | |

|
#17
Shiraz Loop
Round Rock, TX 78665
|
2,820 sq. feet
|
3 baths 4 beds |
show details | |

|
#18
Rambollet Ter
Round Rock, TX 78681
|
2,274 sq. feet
|
3 baths 4 beds |
show details | |

|
#19
Malaga Hills Dr
Round Rock, TX 78681
|
2,686 sq. feet
|
3 baths 4 beds |
show details | |

|
#20
Pablo Way
Round Rock, TX 78665
|
2,761 sq. feet
|
3 baths 4 beds |
show details |
| Photo | Address | Area | Beds / Baths | Price | Details |
|---|---|---|---|---|---|

|
#21
Marysol Trl
Cedar Park, TX 78613
|
3,297 sq. feet
|
2 baths - beds |
show details | |

|
#22
Quail Cir
Hutto, TX 78634
|
1,336 sq. feet
|
2 baths - beds |
show details | |

|
#23
Brownsboro Ct
Manor, TX 78653
|
1,611 sq. feet
|
2 baths - beds |
show details | |

|
#24
Howerington Cir
Austin, TX 78724
|
870 sq. feet
|
1 baths - beds |
show details | |

|
#25
Musselman Ct
Hutto, TX 78634
|
1,232 sq. feet
|
2 baths - beds |
show details | |

|
#26
Copperhead Dr
Round Rock, TX 78664
|
1,929 sq. feet
|
2 baths - beds |
show details | |

|
#27
Speidel Dr
Pflugerville, TX 78660
|
3,381 sq. feet
|
3 baths - beds |
show details | |

|
#28
Jennifer Ln
Round Rock, TX 78665
|
1,860 sq. feet
|
2 baths - beds |
show details | |

|
#29
Payton Falls Dr
Austin, TX 78754
|
2,828 sq. feet
|
2 baths - beds |
show details | |

|
#30
Nicole Cv
Round Rock, TX 78664
|
2,284 sq. feet
|
2 baths - beds |
show details |
| Photo | Address | Area | Beds / Baths | Price | Details |
|---|---|---|---|---|---|

|
#31
Hansford Dr
Austin, TX 78753
|
1,401 sq. feet
|
2 baths - beds |
show details | |

|
#32
Alden Dr
Austin, TX 78758
|
1,214 sq. feet
|
2 baths - beds |
show details | |

|
#33
Simbrah Dr
Cedar Park, TX 78613
|
2,006 sq. feet
|
2 baths - beds |
show details | |

|
#34
Pyreneese Dr
Austin, TX 78759
|
1,604 sq. feet
|
2 baths - beds |
show details | |

|
#35
Marin Cv
Leander, TX 78641
|
2,079 sq. feet
|
2 baths - beds |
show details | |

|
#36
Trail Of The Woods
Austin, TX 78734
|
4,267 sq. feet
|
3 baths - beds |
show details | |

|
#37
Watson Way
Pflugerville, TX 78660
|
1,733 sq. feet
|
2 baths - beds |
show details | |

|
#38
N Interstate 35 # 1109
Georgetown, TX 78628
|
1,809 sq. feet
|
1 baths - beds |
show details | |

|
#39
Romeo Dr
Cedar Park, TX 78613
|
2,518 sq. feet
|
2 baths - beds |
show details | |

|
#40
Barcelona Dr
Austin, TX 78752
|
2,096 sq. feet
|
2 baths - beds |
show details |
| Photo | Address | Area | Beds / Baths | Price | Details |
|---|---|---|---|---|---|

|
#41
Butler Way
Round Rock, TX 78665
|
1,928 sq. feet
|
2 baths - beds |
show details | |

|
#42
Mancuso Bnd
Cedar Park, TX 78613
|
2,424 sq. feet
|
2 baths - beds |
show details | |

|
#43
Brentwood Dr
Leander, TX 78641
|
2,228 sq. feet
|
2 baths - beds |
show details | |

|
#44
Golden Oaks Dr
Georgetown, TX 78628
|
2,107 sq. feet
|
2 baths - beds |
show details | |

|
#45
Stephanie Lee Ln
Austin, TX 78753
|
1,748 sq. feet
|
2 baths - beds |
show details | |

|
#46
N Pauley Dr
Hutto, TX 78634
|
1,685 sq. feet
|
2 baths - beds |
show details | |

|
#47
Kenneys Way # 1213
Round Rock, TX 78665
|
1,344 sq. feet
|
2 baths - beds |
show details | |

|
#48
Laguna Cv
Hutto, TX 78634
|
2,078 sq. feet
|
2 baths - beds |
show details | |

|
#49
Cordova Dr
Austin, TX 78759
|
2,307 sq. feet
|
2 baths - beds |
show details | |

|
Check over 1 million property listings on Foreclosure.com!
|
browse all offers | |||


Median year apartment built: 2001
Household type by relationship:
Households: 24,231- Male householders: 4,534 (865 living alone), Female householders: 3,763 (632 living alone)
5,635 spouses (5,596 opposite-sex spouses), 358 unmarried partners, (358 opposite-sex unmarried partners), 8,546 children (7,931 natural, 245 adopted, 369 stepchildren), 191 grandchildren, 183 brothers or sisters, 294 parents, 31 foster children, 306 other relatives, 354 non-relatives
- In group quarters: 29
Size of family households: 2,027 2-persons, 1,481 3-persons, 2,071 4-persons, 764 5-persons, 124 6-persons, 25 7-or-more-persons.
Size of nonfamily households: 1,645 1-person, 311 2-persons, 10 4-persons.
5,845 married couples with children.
658 single-parent households (123 men, 535 women).
73.1% of residents of Brushy Creek speak English at home.
11.0% of residents speak Spanish at home (78% speak English very well, 16% speak English well, 5% speak English not well).
5.1% of residents speak other Indo-European language at home (91% speak English very well, 6% speak English well, 2% speak English not well, 1% don't speak English at all).
9.5% of residents speak Asian or Pacific Island language at home (65% speak English very well, 20% speak English well, 13% speak English not well, 1% don't speak English at all).
0.7% of residents speak other language at home (100% speak English very well).
Foreign born population: 4,608 (19.0%)
(56.1% of them are naturalized citizens)
| Here: | 7.1 |
| State: | 6.3 |
| Here: | 4.3 |
| State: | 4.0 |
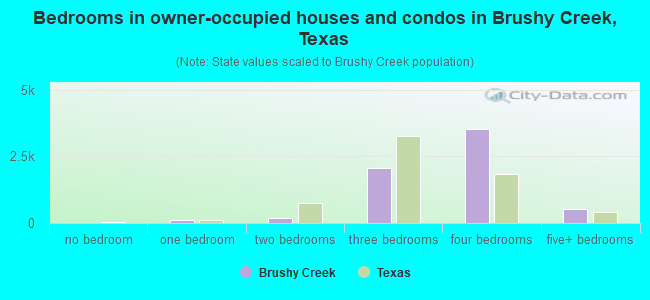
- Bedrooms in owner-occupied houses and condos in Brushy Creek, Texas
- 0no bedroom
- 1041 bedroom
- 1842 bedrooms
- 2,0663 bedrooms
- 3,5334 bedrooms
- 5375+ bedrooms
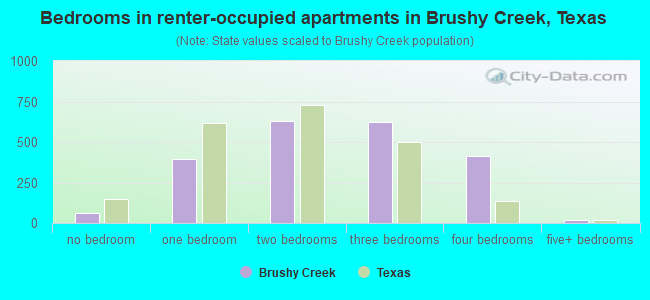
- Bedrooms in renter-occupied apartments in Brushy Creek, Texas
- 59no bedroom
- 3961 bedroom
- 6292 bedrooms
- 6233 bedrooms
- 4144 bedrooms
- 215+ bedrooms
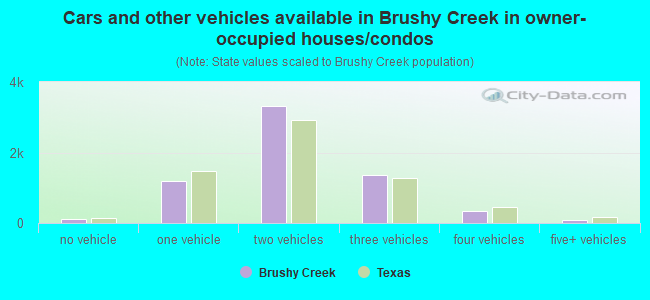
- Cars and other vehicles available in Brushy Creek in owner-occupied houses/condos
- 116no vehicle
- 1,1901 vehicle
- 3,3252 vehicles
- 1,3563 vehicles
- 3464 vehicles
- 915+ vehicles
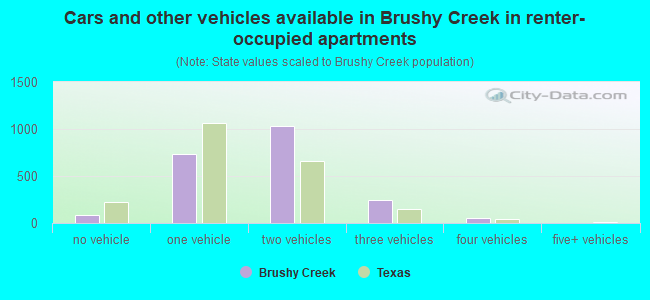
- Cars and other vehicles available in Brushy Creek in renter-occupied apartments
- 89no vehicle
- 7381 vehicle
- 1,0272 vehicles
- 2413 vehicles
- 484 vehicles
- 05+ vehicles
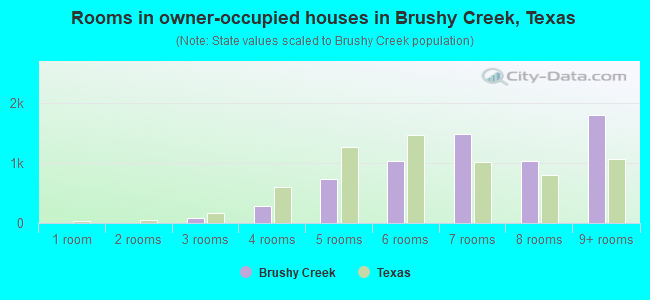
- Rooms in owner-occupied houses in Brushy Creek, Texas
- 01 room
- 02 rooms
- 753 rooms
- 2784 rooms
- 7385 rooms
- 1,0356 rooms
- 1,4757 rooms
- 1,0288 rooms
- 1,7949+ rooms
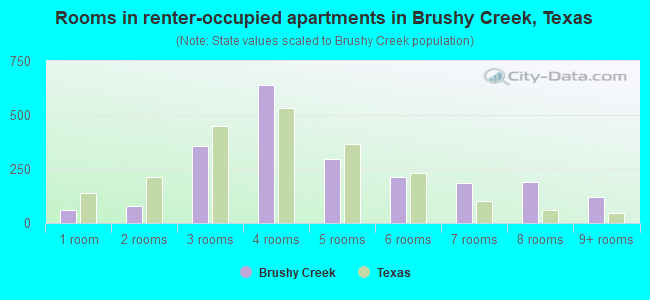
- Rooms in renter-occupied apartments in Brushy Creek, Texas
- 591 room
- 802 rooms
- 3573 rooms
- 6394 rooms
- 2975 rooms
- 2136 rooms
- 1857 rooms
- 1928 rooms
- 1209+ rooms
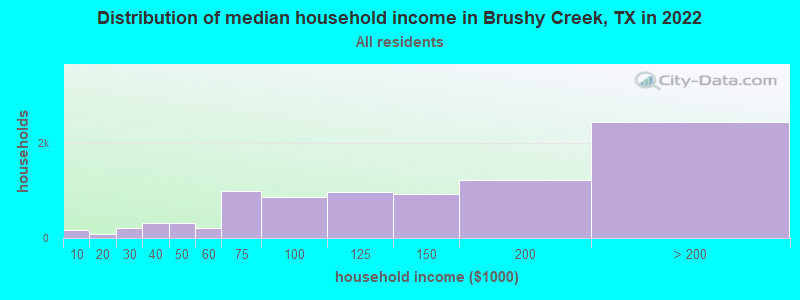
Brushy Creek, TX household income distribution

- 175Less than $10,000
- 93$10,000 to $19,999
- 218$20,000 to $29,999
- 309$30,000 to $39,999
- 314$40,000 to $49,999
- 202$50,000 to $59,999
- 984$60,000 to $74,999
- 855$75,000 to $99,999
- 959$100,000 to $124,999
- 921$125,000 to $149,999
- 1,222$150,000 to $199,999
- 2,437$200,000 or more
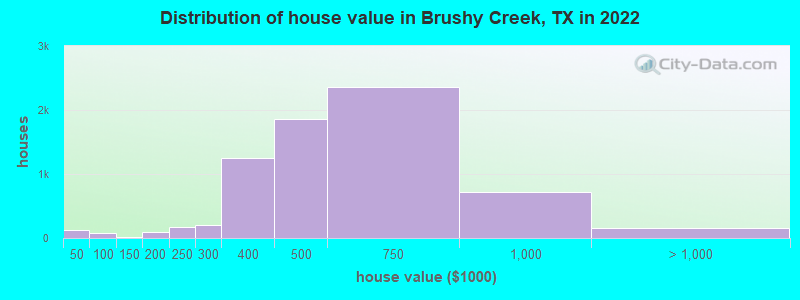
Home value of owner - occupied houses in 2022 in Brushy Creek, TX
-
- 27Less than $10,000
- 78$15,000 to $19,999
- 11$35,000 to $39,999
- 34$50,000 to $59,999
- 27$60,000 to $69,999
- 9$80,000 to $89,999
- 9$100,000 to $124,999
- 4$125,000 to $149,999
- 53$150,000 to $174,999
- 43$175,000 to $199,999
- 177$200,000 to $249,999
- 201$250,000 to $299,999
- 1,246$300,000 to $399,999
- 1,852$400,000 to $499,999
- 2,355$500,000 to $749,999
- 721$750,000 to $999,999
- 151$1,000,000 to $1,499,999
- 12$1,500,000 to $1,999,999
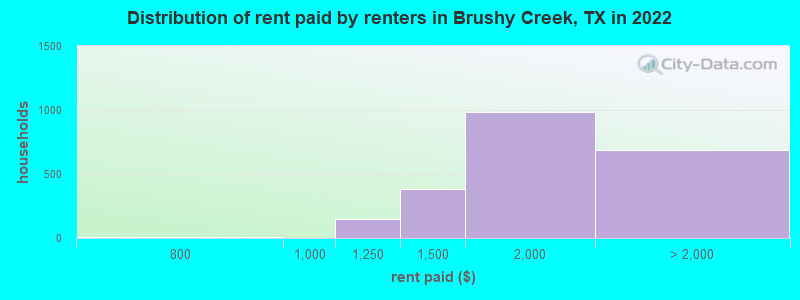
Rent paid by renters in 2022 in Brushy Creek, TX
-
- 6$600 to $649
- 10$750 to $799
- 151$1,000 to $1,249
- 381$1,250 to $1,499
- 985$1,500 to $1,999
- 438$2,000 to $2,499
- 107$2,500 to $2,999
- 88$3,000 to $3,499
- 50No cash rent
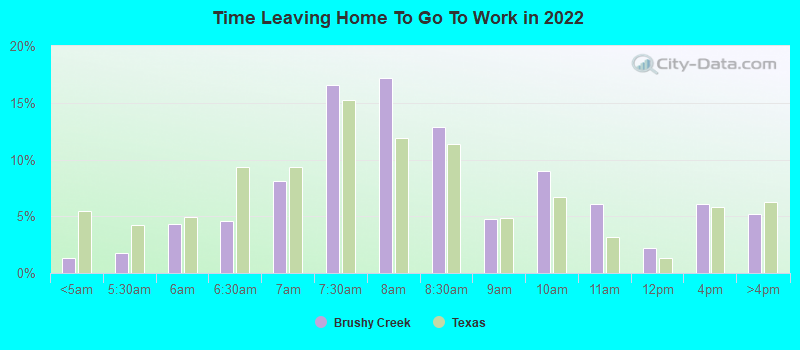
Percentage of workers working in this county: 62.4%
Number of people working at home: 4,251 (31.9% of all workers)
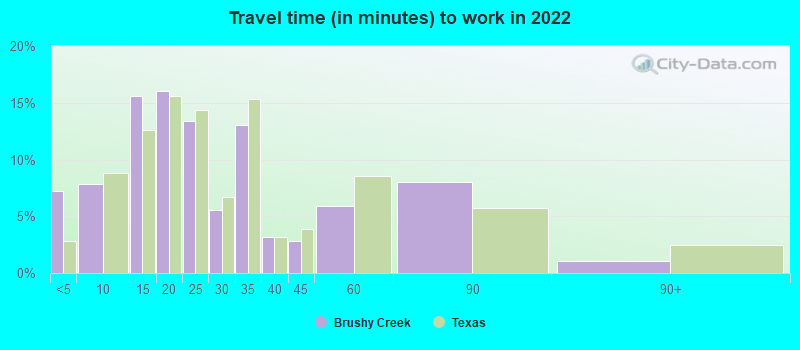
Travel time to work (commute)
- Less than 5 minutes: 217
- 5 to 9 minutes: 429
- 10 to 14 minutes: 1,129
- 15 to 19 minutes: 1,370
- 20 to 24 minutes: 2,095
- 25 to 29 minutes: 699
- 30 to 34 minutes: 1,551
- 35 to 39 minutes: 272
- 40 to 44 minutes: 210
- 45 to 59 minutes: 1,097
- 60 to 89 minutes: 251
- 90 or more minutes: 29
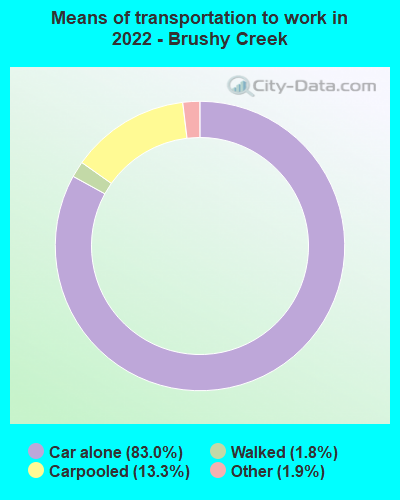
Means of transportation to work:
- Drove a car alone: 2,492 (37.9%)
- Carpooled: 325 (4.9%)
- Taxi: 76 (1.2%)
- Walked: 68 (1.0%)
- Worked at home: 4,251 (64.6%)
- Unemployment by race in 2022
- Unemployment rate for White non-Hispanic residents
- 3.2%Males
- 1.9%Females
- Unemployment rate for Black residents
- 2.1%Males
- 1.3%Females
- Unemployment rate for Asian residents
- 0.4%Males
- 0.9%Females
- Unemployment rate for other race residents
- 8.2%Females
- Unemployment rate for two or more race residents
- 2.1%Males
- 2.6%Females
- Unemployment rate for Hispanic or Latino residents
- 1.6%Males
- 2.1%Females
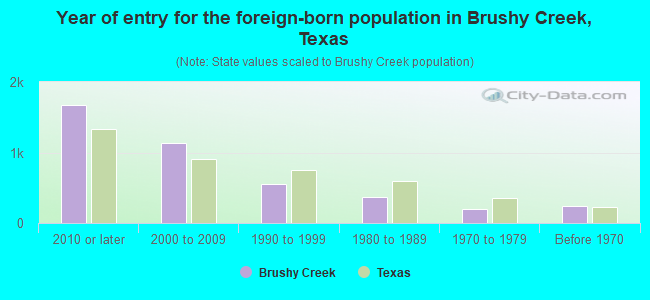
- Year of entry for the foreign-born population in Brushy Creek, Texas
- 1,6782010 or later
- 1,1382000 to 2009
- 5581990 to 1999
- 3621980 to 1989
- 2001970 to 1979
- 239Before 1970
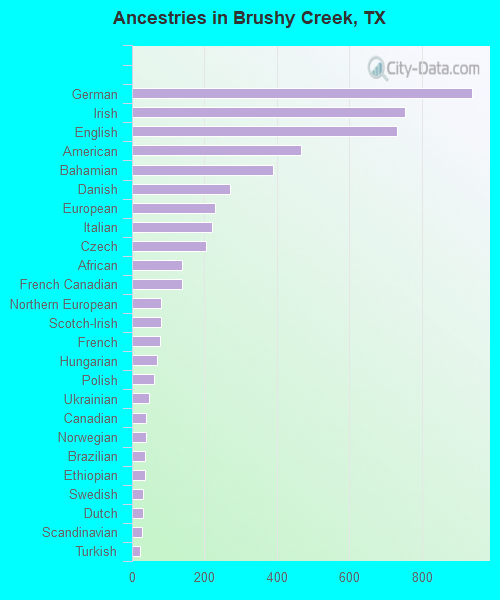
First ancestries reported:
- German: 938 (8.5%)
- Irish: 752 (6.8%)
- English: 731 (6.6%)
- American: 465 (4.2%)
- Bahamian: 390 (3.5%)
- Danish: 270 (2.5%)
- European: 228 (2.1%)
- Italian: 220 (2.0%)
- Czech: 204 (1.9%)
- African: 137 (1.2%)
- French Canadian: 137 (1.2%)
- Northern European: 81 (0.7%)
- Scotch-Irish: 80 (0.7%)
- French: 76 (0.7%)
- Hungarian: 68 (0.6%)
- Polish: 62 (0.6%)
- Ukrainian: 47 (0.4%)
- Canadian: 39 (0.4%)
- Norwegian: 39 (0.4%)
- Brazilian: 37 (0.3%)
- Ethiopian: 36 (0.3%)
- Swedish: 31 (0.3%)
- Dutch: 30 (0.3%)
- Scandinavian: 28 (0.3%)
- Turkish: 21 (0.2%)
- Slovak: 19 (0.2%)
- Swiss: 19 (0.2%)
- Russian: 16 (0.1%)
- Lebanese: 13 (0.1%)
- Kenyan: 12 (0.1%)
- British: 11 (0.1%)
- Nigerian: 10 (0.09%)
- Jamaican: 8 (0.07%)
- Finnish: 6 (0.05%)
- Scottish: 6 (0.05%)
- Welsh: 6 (0.05%)
Most common places of birth for foreign-born residents (%):
| Brushy Creek: | 27.0% (1,022) |
| Texas: | 6.1% (306,347) |
| Brushy Creek: | 19.8% (748) |
| Texas: | 48.4% (2,411,723) |
| Brushy Creek: | 8.6% (324) |
| Texas: | 1.2% (60,172) |
| Brushy Creek: | 8.5% (322) |
| Texas: | 2.3% (115,558) |
| Brushy Creek: | 4.3% (163) |
| Texas: | 0.3% (16,549) |
| Brushy Creek: | 3.9% (148) |
| Texas: | 1.1% (55,371) |
| Brushy Creek: | 3.6% (136) |
| Texas: | 0.5% (24,723) |
| Brushy Creek: | 2.9% (110) |
| Texas: | 0.6% (27,844) |
| Brushy Creek: | 2.2% (84) |
| Texas: | 3.7% (184,770) |
| Brushy Creek: | 2.1% (78) |
| Texas: | 1.9% (96,110) |
| Brushy Creek: | 2.0% (77) |
| Texas: | 0.0% (1,963) |
| Brushy Creek: | 2.0% (76) |
| Texas: | 0.1% (3,178) |
Place of birth for U.S.-born residents:
- This state: 10,631
- Other state: 8,527
- Northeast: 1,985
- Midwest: 2,174
- South: 2,001
- West: 2,427
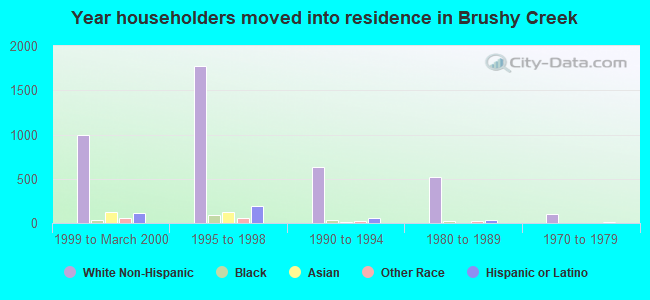
85.0% of Brushy Creek residents lived in the same house 1 years ago.
Out of people who lived in different houses, 34.1% lived in this county.
Out of people who lived in different counties, 37.9% lived in Texas.
| Brushy Creek: | 85.0% |
| State average: | 85.7% |
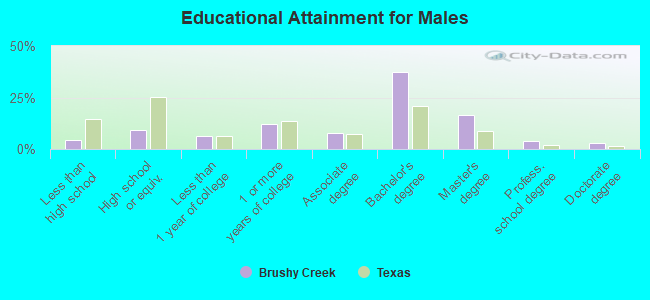
Education attainment for males 25 years and older:
- No schooling: 37
- Nursery to 4th grade: 60
- 5th and 6th grade: 81
- 7th and 8th grade: 0
- 9th grade: 22
- 10th grade: 0
- 11th grade: 16
- 12th grade, no diploma: 130
- High school graduate (or equivalency): 773
- Less than 1 year of college: 507
- Some college more than 1 year, no degree: 997
- Associate degree: 628
- Bachelor's degree: 3,131
- Master's degree: 1,378
- Professional school degree: 310
- Doctorate degree: 252
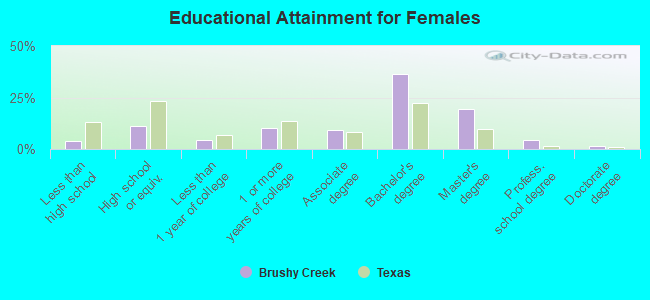
Education attainment for females 25 years and older:
- No schooling: 68
- Nursery to 4th grade: 92
- 5th and 6th grade: 58
- 7th and 8th grade: 0
- 9th grade: 0
- 10th grade: 11
- 11th grade: 1
- 12th grade, no diploma: 67
- High school graduate (or equivalency): 897
- Less than 1 year of college: 341
- Some college more than 1 year, no degree: 808
- Associate degree: 744
- Bachelor's degree: 2,905
- Master's degree: 1,535
- Professional school degree: 333
- Doctorate degree: 122
Housing units in structures:
- One, detached: 7,113
- One, attached: 115
- Two: 25
- 3 or 4: 256
- 5 to 9: 327
- 10 to 19: 282
- 20 to 49: 351
- 50 or more: 126
- Mobile homes: 8
Housing units lacking complete kitchen facilities in 2022: 1.8%
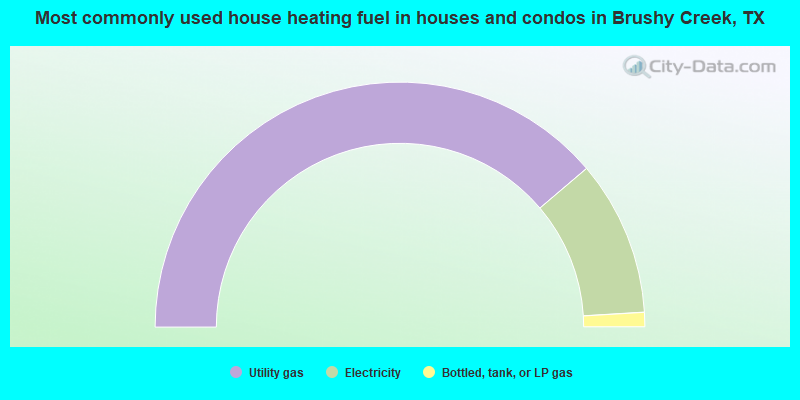
- 77.5%Utility gas
- 20.5%Electricity
- 1.9%Bottled, tank, or LP gas
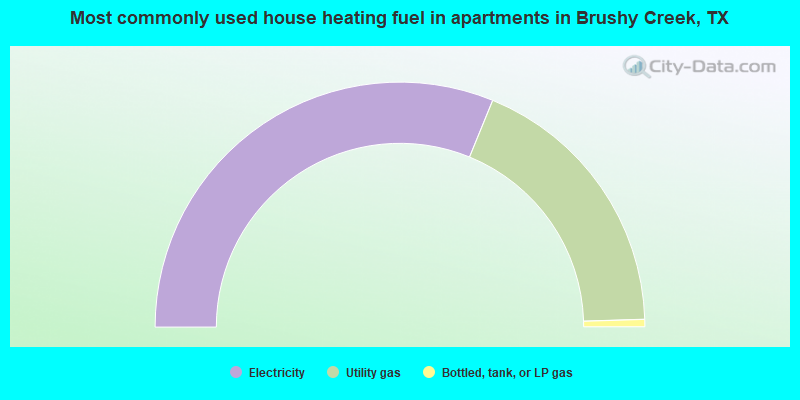
- 62.3%Electricity
- 36.6%Utility gas
- 1.0%Bottled, tank, or LP gas
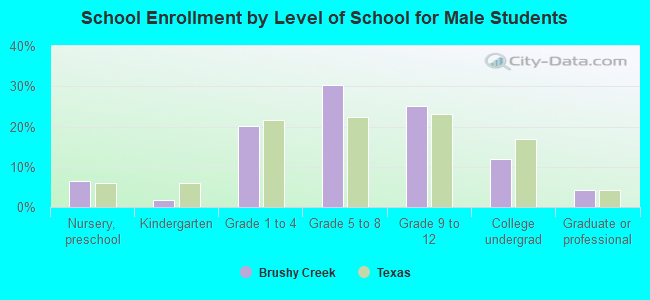
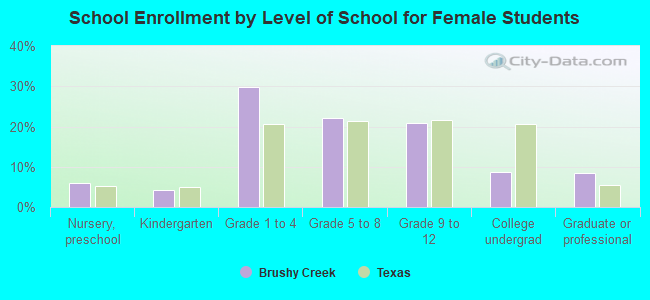
Private vs. public school enrollment:
| Here: | 5.3% |
| Texas: | 8.8% |
| Here: | 5.8% |
| Texas: | 8.0% |
| Here: | 1.8% |
| Texas: | 16.2% |