Burbank, WA (Washington) Houses and Residents
| Burbank: | $340,689 |
| Washington: | $569,500 |
Total population: 3,291 (Urban population: 1,305, Rural population: 2,089 (89 farm, 2,000 nonfarm))
Houses: 1,190 (1,144 occupied: 1,016 owner occupied, 132 renter occupied)
| % of renters here: | 11% |
| State: | 36% |
Housing density: 90 houses/condos per square mile
Median price asked for vacant for-sale houses and condos in 2022 in this county: $258,554.
Median contract rent in 2022: $864 (lower quartile is $711, upper quartile is $958)
Median rent asked for vacant for-rent units in 2022: $1,495
Median gross rent in Burbank, WA in 2022: $1,002
Housing units in Burbank with a mortgage: 591 (17 second mortgage, 0 home equity loan, 18 both second mortgage and home equity loan)
Houses without a mortgage: 11
Median household income for houses/condos with a mortgage: $112,414
Median household income for apartments without a mortgage: $63,550
Median monthly housing costs: $1,331
Compare current foreclosures near Burbank, WA:
| Photo | Address | Area | Beds / Baths | Price | Details |
|---|---|---|---|---|---|

|
#1
Largent Rd
Burbank, WA 99323
|
1,440 sq. feet
|
2 baths 3 beds |
show details | |

|
#2
Lake Rd
Burbank, WA 99323
|
2,125 sq. feet
|
3 baths 4 beds |
show details | |

|
#3
Tuttle Ln
Burbank, WA 99323
|
2,928 sq. feet
|
3 baths 4 beds |
show details | |

|
#4
Largent Rd
Burbank, WA 99323
|
1,344 sq. feet
|
2 baths 3 beds |
show details | |

|
#5
W Highway 12
Burbank, WA 99323
|
- sq. feet
|
- baths - beds |
show details | |

|
#6
E Foster Wells Rd
Pasco, WA 99301
|
- sq. feet
|
2 baths 3 beds |
show details | |

|
#7
Blalock Ct
Richland, WA 99352
|
2,524 sq. feet
|
3 baths 4 beds |
show details | |

|
#8
W Margaret St
Pasco, WA 99301
|
1,072 sq. feet
|
1 baths 2 beds |
show details | |

|
#9
E 36th Ave
Kennewick, WA 99337
|
2,032 sq. feet
|
2 baths 3 beds |
show details | |

|
#10
W 4th Pl
Kennewick, WA 99336
|
2,375 sq. feet
|
3 baths 4 beds |
show details |
| Photo | Address | Area | Beds / Baths | Price | Details |
|---|---|---|---|---|---|

|
#11
W 21st Pl
Kennewick, WA 99337
|
1,250 sq. feet
|
2 baths 3 beds |
show details | |

|
#12
NW Commons Dr
Pasco, WA 99301
|
- sq. feet
|
2 baths 4 beds |
show details | |

|
#13
S Hawthorne St
Kennewick, WA 99336
|
1,820 sq. feet
|
2 baths 3 beds |
show details | |

|
#14
W Ella St
Pasco, WA 99301
|
2,068 sq. feet
|
3 baths 3 beds |
show details | |

|
#15
W 35th Ct
Kennewick, WA 99337
|
- sq. feet
|
3 baths 4 beds |
show details | |

|
#16
W Metaline Pl
Kennewick, WA 99336
|
2,034 sq. feet
|
1 baths 5 beds |
show details | |

|
#17
S Fir St
Kennewick, WA 99336
|
793 sq. feet
|
1 baths 3 beds |
show details | |

|
#18
W 24th Ave
Kennewick, WA 99337
|
1,394 sq. feet
|
2 baths 3 beds |
show details | |

|
#19
Ronan St
Pasco, WA 99301
|
- sq. feet
|
2 baths 3 beds |
show details | |

|
#20
Humphreys St
Richland, WA 99352
|
1,200 sq. feet
|
1 baths 3 beds |
show details |
| Photo | Address | Area | Beds / Baths | Price | Details |
|---|---|---|---|---|---|

|
#21
Summit View Dr
Kennewick, WA 99338
|
4,100 sq. feet
|
3 baths 4 beds |
show details | |

|
#22
Hudson Ave
Richland, WA 99354
|
2,460 sq. feet
|
2 baths 4 beds |
show details | |

|
#23
E Bowles Rd
Kennewick, WA 99337
|
- sq. feet
|
1 baths 3 beds |
show details | |

|
#24
Clearview Rd
Pasco, WA 99301
|
1,803 sq. feet
|
2 baths 3 beds |
show details | |

|
#25
Anza Borrego Ct
Pasco, WA 99301
|
1,818 sq. feet
|
2 baths 3 beds |
show details | |

|
#26
Quail Rd
Pasco, WA 99301
|
1,620 sq. feet
|
2 baths 2 beds |
show details | |

|
#27
Torbett St
Richland, WA 99354
|
1,914 sq. feet
|
1 baths 3 beds |
show details | |

|
#28
Shasta Ave
Richland, WA 99354
|
3,521 sq. feet
|
2 baths 3 beds |
show details | |

|
#29
Kalahari Dr
Pasco, WA 99301
|
1,144 sq. feet
|
2 baths 3 beds |
show details | |

|
#30
Saguaro Dr
Pasco, WA 99301
|
1,429 sq. feet
|
2 baths 3 beds |
show details |
| Photo | Address | Area | Beds / Baths | Price | Details |
|---|---|---|---|---|---|

|
#31
N Volland St
Kennewick, WA 99336
|
1,269 sq. feet
|
1 baths 3 beds |
show details | |

|
#32
W Imnaha Ave
Kennewick, WA 99336
|
1,910 sq. feet
|
2 baths 3 beds |
show details | |

|
#33
W 5th Ave
Kennewick, WA 99336
|
1,368 sq. feet
|
2 baths 3 beds |
show details | |

|
#34
Perkins Ave
Richland, WA 99354
|
961 sq. feet
|
1 baths 3 beds |
show details | |

|
#35
Cedar Ave
Richland, WA 99354
|
1,200 sq. feet
|
1 baths 3 beds |
show details | |

|
#36
W Richardson Rd
Pasco, WA 99301
|
1,570 sq. feet
|
3 baths 3 beds |
show details | |

|
#37
Hayes Ln
Pasco, WA 99301
|
1,930 sq. feet
|
2 baths 4 beds |
show details | |

|
#38
Mojave Dr
Pasco, WA 99301
|
1,717 sq. feet
|
2 baths 3 beds |
show details | |

|
#39
Desert Dr
Pasco, WA 99301
|
1,728 sq. feet
|
2 baths 3 beds |
show details | |

|
#40
S Reed St
Kennewick, WA 99336
|
1,469 sq. feet
|
2 baths 3 beds |
show details |
| Photo | Address | Area | Beds / Baths | Price | Details |
|---|---|---|---|---|---|

|
#41
N Neel St
Kennewick, WA 99336
|
1,378 sq. feet
|
2 baths 3 beds |
show details | |

|
#42
W 20th Ave
Kennewick, WA 99338
|
1,249 sq. feet
|
2 baths 3 beds |
show details | |

|
#43
W 16th Pl # A
Kennewick, WA 99338
|
2,068 sq. feet
|
2 baths 4 beds |
show details | |

|
#44
Symons St
Richland, WA 99354
|
2,128 sq. feet
|
2 baths 4 beds |
show details | |

|
#45
N Road 50
Pasco, WA 99301
|
1,728 sq. feet
|
2 baths 3 beds |
show details | |

|
#46
W Metaline Pl
Kennewick, WA 99336
|
1,764 sq. feet
|
2 baths 4 beds |
show details | |

|
#47
S Irby Loop
Kennewick, WA 99337
|
2,548 sq. feet
|
2 baths 3 beds |
show details | |

|
#48
N Kellogg St
Kennewick, WA 99336
|
1,608 sq. feet
|
2 baths 4 beds |
show details | |

|
#49
Janet Rd
Pasco, WA 99301
|
1,207 sq. feet
|
1 baths 3 beds |
show details | |

|
Check over 1 million property listings on Foreclosure.com!
|
browse all offers | |||

Latest news about housing in Burbank, WA collected exclusively by city-data.com from local newspapers, TV, and radio stations

 | Availability of rental homes in mid-2010? (7 replies) |
| Looking for more pros and cons on a WA move from AK (18 replies) |
| Tri-Cities approaching 300K (78 replies) |
| Apartments near Tri-Cities regional airport, help. (9 replies) |
| Tri-Cities vs Boise (40 replies) |
| Riverpointe Apts? (11 replies) |

Median year apartment built: 1978
Household type by relationship:
Households: 3,425- Male householders: 608 (151 living alone), Female householders: 516 (64 living alone)
744 spouses (744 opposite-sex spouses), 37 unmarried partners, (32 opposite-sex unmarried partners), 1,378 children (1,218 natural, 87 adopted, 72 stepchildren), 0 grandchildren, 32 brothers or sisters, 36 parents, 9 foster children, 18 other relatives, 44 non-relatives
Size of family households: 375 2-persons, 193 3-persons, 166 4-persons, 100 5-persons, 26 6-persons, 24 7-or-more-persons.
Size of nonfamily households: 228 1-person, 23 2-persons.
775 married couples with children.
237 single-parent households (11 men, 226 women).
81.6% of residents of Burbank speak English at home.
18.5% of residents speak Spanish at home (20% speak English very well, 55% speak English well, 8% speak English not well, 17% don't speak English at all).
0.3% of residents speak other Indo-European language at home (100% speak English very well).
Foreign born population: 175 (5.1%)
(42.3% of them are naturalized citizens)
| Here: | 6.1 |
| State: | 6.5 |
| Here: | 4.6 |
| State: | 3.9 |

- Bedrooms in owner-occupied houses and condos in Burbank, Washington
- 4no bedroom
- 01 bedroom
- 1862 bedrooms
- 5773 bedrooms
- 1924 bedrooms
- 575+ bedrooms

- Bedrooms in renter-occupied apartments in Burbank, Washington
- 0no bedroom
- 321 bedroom
- 62 bedrooms
- 863 bedrooms
- 84 bedrooms
- 05+ bedrooms

- Cars and other vehicles available in Burbank in owner-occupied houses/condos
- 0no vehicle
- 861 vehicle
- 3062 vehicles
- 3263 vehicles
- 1794 vehicles
- 1205+ vehicles

- Cars and other vehicles available in Burbank in renter-occupied apartments
- 18no vehicle
- 871 vehicle
- 82 vehicles
- 63 vehicles
- 134 vehicles
- 05+ vehicles

- Rooms in owner-occupied houses in Burbank, Washington
- 01 room
- 42 rooms
- 553 rooms
- 374 rooms
- 2615 rooms
- 2696 rooms
- 1637 rooms
- 908 rooms
- 1379+ rooms

- Rooms in renter-occupied apartments in Burbank, Washington
- 01 room
- 182 rooms
- 03 rooms
- 454 rooms
- 135 rooms
- 486 rooms
- 07 rooms
- 88 rooms
- 09+ rooms


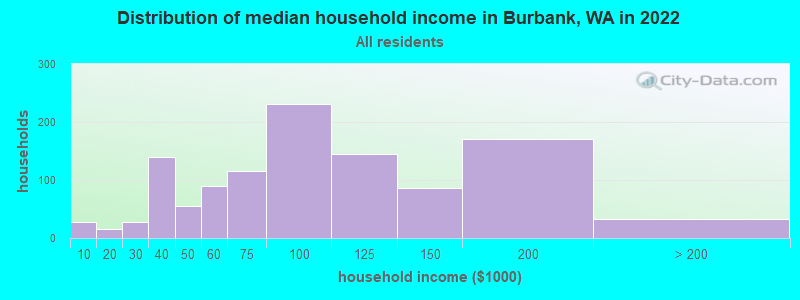
Burbank, WA household income distribution

- 28Less than $10,000
- 15$10,000 to $19,999
- 27$20,000 to $29,999
- 139$30,000 to $39,999
- 55$40,000 to $49,999
- 90$50,000 to $59,999
- 116$60,000 to $74,999
- 231$75,000 to $99,999
- 145$100,000 to $124,999
- 86$125,000 to $149,999
- 171$150,000 to $199,999
- 32$200,000 or more
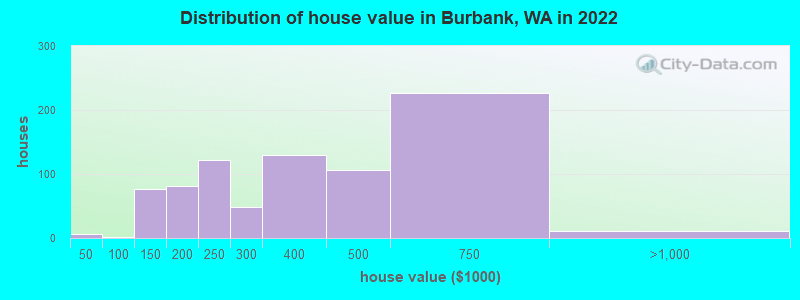
Home value of owner - occupied houses in 2022 in Burbank, WA
-
- 5$30,000 to $34,999
- 1$50,000 to $59,999
- 60$100,000 to $124,999
- 16$125,000 to $149,999
- 27$150,000 to $174,999
- 53$175,000 to $199,999
- 122$200,000 to $249,999
- 48$250,000 to $299,999
- 128$300,000 to $399,999
- 106$400,000 to $499,999
- 226$500,000 to $749,999
- 11$750,000 to $999,999
Rent paid by renters in 2022 in Burbank, WA
-
- 15$300 to $349
- 9$500 to $549
- 6$600 to $649
- 23$700 to $749
- 6$800 to $899
- 51$900 to $999


Percentage of workers working in this county: 31.0%
Number of people working at home: 120 (8.9% of all workers)
Travel time to work (commute)
- Less than 5 minutes: 17
- 5 to 9 minutes: 106
- 10 to 14 minutes: 138
- 15 to 19 minutes: 118
- 20 to 24 minutes: 337
- 25 to 29 minutes: 159
- 30 to 34 minutes: 139
- 35 to 39 minutes: 42
- 40 to 44 minutes: 20
- 45 to 59 minutes: 41
- 60 to 89 minutes: 60
- 90 or more minutes: 15
Means of transportation to work:
- Drove a car alone: 1,303 (84.0%)
- Carpooled: 129 (8.3%)
- Bus or trolley bus: 9 (0.6%)
- Walked: 30 (1.9%)
- Other means: 29 (1.9%)
- Worked at home: 51 (3.3%)

- Unemployment by race in 2022
- Unemployment rate for White non-Hispanic residents
- 5.6%Males
- 8.5%Females
- Unemployment rate for other race residents
- 13.0%Males
- Unemployment rate for two or more race residents
- 60.4%Males
- Unemployment rate for Hispanic or Latino residents
- 43.8%Males

- Year of entry for the foreign-born population in Burbank, Washington
- 422010 or later
- 312000 to 2009
- 131990 to 1999
- 581980 to 1989
- 381970 to 1979
- 30Before 1970

First ancestries reported:
- American: 225 (11.6%)
- European: 178 (9.2%)
- German: 134 (6.9%)
- Norwegian: 122 (6.3%)
- English: 63 (3.3%)
- Scottish: 61 (3.2%)
- Irish: 50 (2.6%)
- French Canadian: 42 (2.2%)
- Haitian: 36 (1.9%)
- Portuguese: 35 (1.8%)
- Scandinavian: 29 (1.5%)
- Italian: 28 (1.4%)
- Finnish: 24 (1.2%)
- Scotch-Irish: 23 (1.2%)
- Swedish: 13 (0.7%)
- Swiss: 12 (0.6%)
- Welsh: 12 (0.6%)
- Croatian: 11 (0.6%)
- Hungarian: 5 (0.3%)
Most common places of birth for foreign-born residents (%):
| Burbank: | 62.9% (110) |
| Washington: | 21.1% (241,655) |
| Burbank: | 17.7% (31) |
| Washington: | 4.1% (47,238) |
| Burbank: | 6.3% (11) |
| Washington: | 1.2% (13,855) |
| Burbank: | 4.0% (7) |
| Washington: | 0.7% (8,049) |
| Burbank: | 3.4% (6) |
| Washington: | 0.3% (3,180) |
Place of birth for U.S.-born residents:
- This state: 2,154
- Other state: 980
- Northeast: 30
- Midwest: 168
- South: 88
- West: 694
91.3% of Burbank residents lived in the same house 1 years ago.
Out of people who lived in different houses, 14.7% lived in this county.
Out of people who lived in different counties, 100.0% lived in Washington.
| Burbank: | 91.3% |
| State average: | 85.2% |
Education attainment for males 25 years and older:
- No schooling: 0
- Nursery to 4th grade: 0
- 5th and 6th grade: 64
- 7th and 8th grade: 0
- 9th grade: 0
- 10th grade: 0
- 11th grade: 27
- 12th grade, no diploma: 7
- High school graduate (or equivalency): 458
- Less than 1 year of college: 118
- Some college more than 1 year, no degree: 175
- Associate degree: 103
- Bachelor's degree: 124
- Master's degree: 8
- Professional school degree: 7
- Doctorate degree: 12

Education attainment for females 25 years and older:
- No schooling: 0
- Nursery to 4th grade: 0
- 5th and 6th grade: 45
- 7th and 8th grade: 0
- 9th grade: 0
- 10th grade: 0
- 11th grade: 0
- 12th grade, no diploma: 0
- High school graduate (or equivalency): 357
- Less than 1 year of college: 33
- Some college more than 1 year, no degree: 133
- Associate degree: 62
- Bachelor's degree: 189
- Master's degree: 39
- Professional school degree: 52
- Doctorate degree: 0


Housing units in structures:
- One, detached: 878
- One, attached: 11
- Two: 17
- Mobile homes: 283
Median worth of mobile homes: $191,033
Housing units lacking complete kitchen facilities in 2022: 2.2%
House/condo owner moved in on average 10 years ago
Renter moved in on average 3 years ago

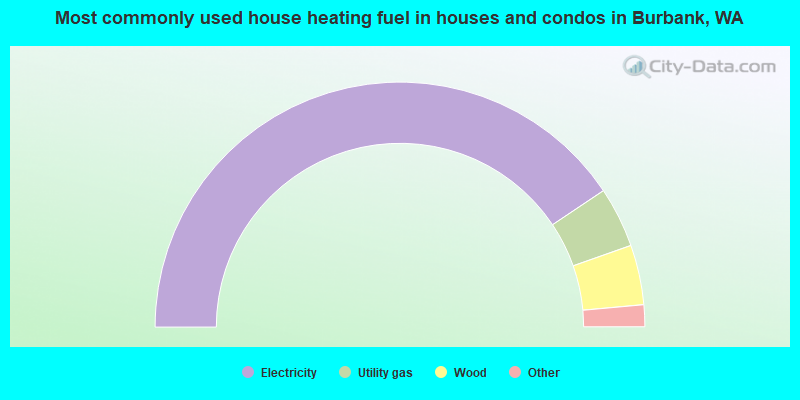
- 81.3%Electricity
- 8.0%Utility gas
- 7.9%Wood
- 1.1%Bottled, tank, or LP gas
- 1.0%Other fuel
- 0.6%No fuel used
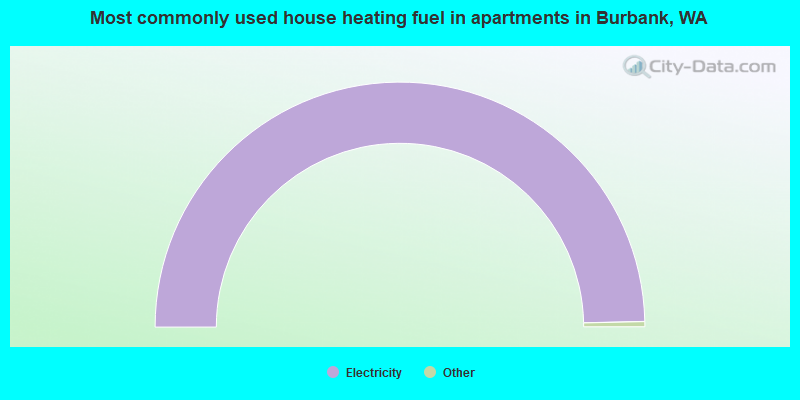
- 100.0%Electricity
Private vs. public school enrollment:
| Here: | 10.7% |
| Washington: | 12.4% |
| Here: | 9.7% |
| Washington: | 9.2% |
| Here: | 6.3% |
| Washington: | 16.5% |


