Burien, WA (Washington) Houses and Residents
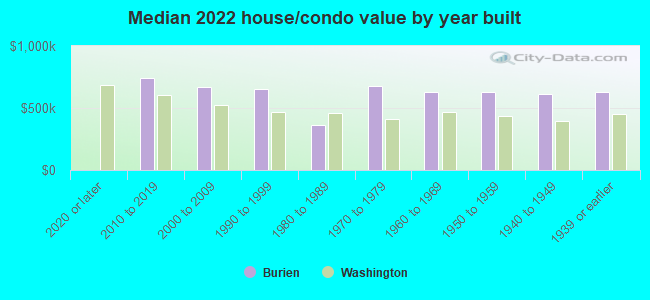
| Burien: | $641,413 |
| Washington: | $569,500 |
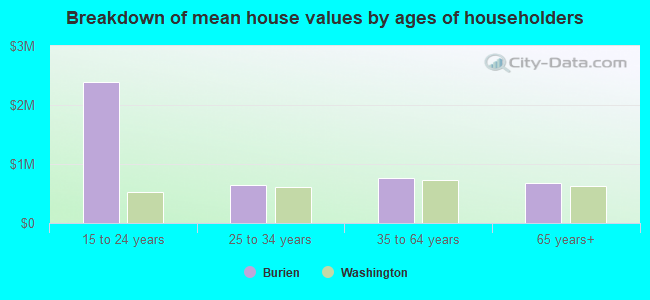
Mean price in 2022:
Detached houses: $776,036
Here: $776,036 State: $734,307 Townhouses or other attached units: $672,160
Here: $672,160 State: $657,697 In 2-unit structures: $735,925
Here: $735,925 State: $534,634 In 5-or-more-unit structures: $282,234
Here: $282,234 State: $503,183 Mobile homes: $360,936
Here: $360,936 State: $218,362
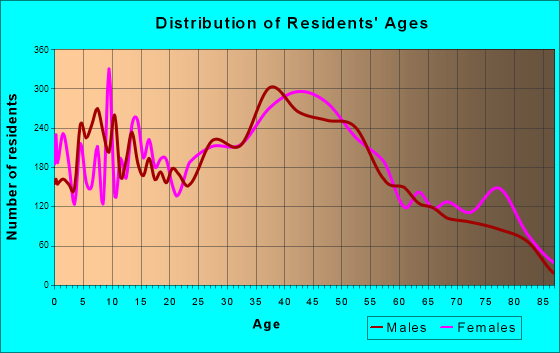
Total population: 50,188 (Urban population: 31,744, Rural population: 0)
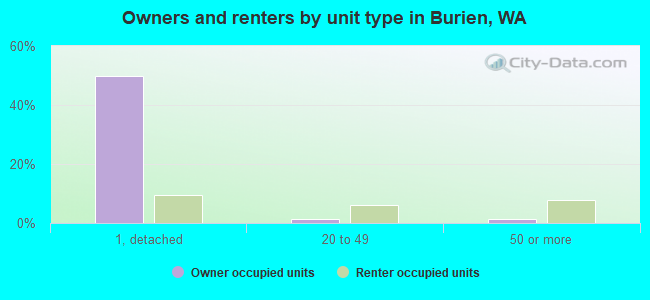
Houses: 21,809 (20,556 occupied: 11,634 owner occupied, 8,893 renter occupied)
| % of renters here: | 43% |
| State: | 36% |
Housing density: 2,933 houses/condos per square mile
Median price asked for vacant for-sale houses and condos in 2022 in this county: $843,880.
Median contract rent in 2022: $1,441 (lower quartile is $1,107, upper quartile is $1,881)
Median rent asked for vacant for-rent units in 2022: $1,651
Median gross rent in Burien, WA in 2022: $1,621
Housing units in Burien with a mortgage: 7,727 (781 second mortgage, 8 home equity loan, 697 both second mortgage and home equity loan)
Houses without a mortgage: 211
Median household income for houses/condos with a mortgage: $149,995
Median household income for apartments without a mortgage: $83,317
Median monthly housing costs: $1,753
Compare current foreclosures near Burien, WA:
| Photo | Address | Area | Beds / Baths | Price | Details |
|---|---|---|---|---|---|

|
#1
1st Ave S # 806
Seattle, WA 98104
|
806 sq. feet
|
1 baths 1 beds |
show details | |

|
#2
57th Ave S Unit B104
Seattle, WA 98178
|
572 sq. feet
|
1 baths 1 beds |
show details | |

|
#3
42nd Ave S Apt 101
Kent, WA 98032
|
995 sq. feet
|
2 baths 2 beds |
show details | |

|
#4
SW 148th St
Seattle, WA 98166
|
1,030 sq. feet
|
1 baths 3 beds |
show details | |

|
#5
S 182nd St
Seattle, WA 98188
|
1,168 sq. feet
|
2 baths 3 beds |
show details | |

|
#6
1st Ave NE
Seattle, WA 98115
|
1,110 sq. feet
|
1 baths 4 beds |
show details | |

|
#7
Burwell St
Bremerton, WA 98337
|
1,770 sq. feet
|
1 baths 3 beds |
show details | |

|
#8
SE 266th St
Kent, WA 98042
|
920 sq. feet
|
1 baths 3 beds |
show details | |

|
#9
SW Wycoff Rd
Port Orchard, WA 98367
|
2,256 sq. feet
|
2 baths 3 beds |
show details | |

|
#10
N Tyler St
Tacoma, WA 98406
|
1,460 sq. feet
|
2 baths 3 beds |
show details |
| Photo | Address | Area | Beds / Baths | Price | Details |
|---|---|---|---|---|---|

|
#11
S 170th St
Seattle, WA 98188
|
2,650 sq. feet
|
2 baths 5 beds |
show details | |

|
#12
SE 170th St
Renton, WA 98058
|
960 sq. feet
|
1 baths 3 beds |
show details | |

|
#13
S 240th Pl
Kent, WA 98030
|
- sq. feet
|
3 baths 4 beds |
show details | |

|
#14
97th Ave NW
Gig Harbor, WA 98329
|
1,518 sq. feet
|
1 baths 2 beds |
show details | |

|
#15
S 36th Pl
Renton, WA 98055
|
- sq. feet
|
2 baths 4 beds |
show details | |

|
#16
19th Ave S
Seattle, WA 98168
|
2,420 sq. feet
|
2 baths 2 beds |
show details | |

|
#17
S Trafton St
Tacoma, WA 98405
|
1,160 sq. feet
|
2 baths 3 beds |
show details | |

|
#18
55th St SE
Auburn, WA 98092
|
2,680 sq. feet
|
3 baths 4 beds |
show details | |

|
#19
Anderson Hill Rd SW
Port Orchard, WA 98367
|
1,454 sq. feet
|
1 baths 4 beds |
show details | |

|
#20
39th Ave W
Seattle, WA 98199
|
2,800 sq. feet
|
2 baths 3 beds |
show details |
| Photo | Address | Area | Beds / Baths | Price | Details |
|---|---|---|---|---|---|

|
#21
Browns Point Blvd
Tacoma, WA 98422
|
2,847 sq. feet
|
3 baths 4 beds |
show details | |

|
#22
SW 109th St
Seattle, WA 98146
|
2,410 sq. feet
|
1 baths 4 beds |
show details | |

|
#23
19th Street Ct E
Puyallup, WA 98372
|
960 sq. feet
|
1 baths 3 beds |
show details | |

|
#24
115th Ct SE
Renton, WA 98056
|
2,970 sq. feet
|
2 baths 4 beds |
show details | |

|
#25
NW 59th St
Seattle, WA 98107
|
1,110 sq. feet
|
1 baths 3 beds |
show details | |

|
#26
Bent Tree Ln
Pacific, WA 98047
|
1,810 sq. feet
|
2 baths 3 beds |
show details | |

|
#27
S 7th St
Tacoma, WA 98405
|
1,092 sq. feet
|
1 baths 2 beds |
show details | |

|
#28
Pacific Ave S
Pacific, WA 98047
|
1,000 sq. feet
|
1 baths 3 beds |
show details | |

|
#29
230th Way SE
Sammamish, WA 98075
|
3,036 sq. feet
|
3 baths 4 beds |
show details | |

|
#30
SW 100th St
Seattle, WA 98146
|
2,130 sq. feet
|
1 baths 5 beds |
show details |
| Photo | Address | Area | Beds / Baths | Price | Details |
|---|---|---|---|---|---|

|
#31
Aegean Blvd NE
Bremerton, WA 98311
|
1,960 sq. feet
|
2 baths 4 beds |
show details | |

|
#32
SW Oak Rd
Port Orchard, WA 98367
|
1,360 sq. feet
|
1 baths 3 beds |
show details | |

|
#33
NE 5th St
Renton, WA 98056
|
1,930 sq. feet
|
2 baths 3 beds |
show details | |

|
#34
S 241st St
Kent, WA 98030
|
1,840 sq. feet
|
2 baths 4 beds |
show details | |

|
#35
NE 88th St
Seattle, WA 98115
|
2,200 sq. feet
|
2 baths 3 beds |
show details | |

|
#36
41st Ave SW
Seattle, WA 98116
|
1,420 sq. feet
|
1 baths 2 beds |
show details | |

|
#37
SE 24th Way
Sammamish, WA 98075
|
770 sq. feet
|
1 baths 2 beds |
show details | |

|
#38
Puget Blvd SW
Seattle, WA 98106
|
1,820 sq. feet
|
1 baths 3 beds |
show details | |

|
#39
SE 278th Pl
Kent, WA 98030
|
2,478 sq. feet
|
2 baths 4 beds |
show details | |

|
#40
51st Ave NE
Seattle, WA 98115
|
2,450 sq. feet
|
2 baths 4 beds |
show details |
| Photo | Address | Area | Beds / Baths | Price | Details |
|---|---|---|---|---|---|

|
#41
S 239th St
Kent, WA 98032
|
2,210 sq. feet
|
1 baths 4 beds |
show details | |

|
#42
S Donovan St
Seattle, WA 98108
|
1,450 sq. feet
|
2 baths 4 beds |
show details | |

|
#43
SE 185th St
Renton, WA 98058
|
2,830 sq. feet
|
2 baths 3 beds |
show details | |

|
#44
S 18th St
Renton, WA 98055
|
2,680 sq. feet
|
1 baths 4 beds |
show details | |

|
#45
S 316th St
Auburn, WA 98001
|
2,010 sq. feet
|
2 baths 5 beds |
show details | |

|
#46
16th Ave SW
Seattle, WA 98106
|
970 sq. feet
|
1 baths 3 beds |
show details | |

|
#47
Wildwood Blvd SW
Issaquah, WA 98027
|
1,590 sq. feet
|
2 baths 3 beds |
show details | |

|
#48
13th Ave NW
Seattle, WA 98117
|
1,490 sq. feet
|
2 baths 3 beds |
show details | |

|
#49
19th Ave SW
Federal Way, WA 98023
|
1,600 sq. feet
|
2 baths 3 beds |
show details | |

|
Check over 1 million property listings on Foreclosure.com!
|
browse all offers | |||

Latest news about housing in Burien, WA collected exclusively by city-data.com from local newspapers, TV, and radio stations


Median year apartment built: 1975
Household type by relationship:
Households: 51,788- Male householders: 10,274 (3,213 living alone), Female householders: 9,738 (2,860 living alone)
8,275 spouses (8,107 opposite-sex spouses), 2,274 unmarried partners, (2,072 opposite-sex unmarried partners), 13,589 children (12,824 natural, 91 adopted, 673 stepchildren), 1,112 grandchildren, 724 brothers or sisters, 1,456 parents, 65 foster children, 1,409 other relatives, 2,287 non-relatives
- In group quarters: 580
Size of family households: 4,807 2-persons, 3,268 3-persons, 2,162 4-persons, 965 5-persons, 276 6-persons, 411 7-or-more-persons.
Size of nonfamily households: 6,531 1-person, 1,704 2-persons, 170 3-persons, 143 4-persons, 16 5-persons.
5,897 married couples with children.
3,449 single-parent households (773 men, 2,676 women).
66.5% of residents of Burien speak English at home.
16.8% of residents speak Spanish at home (43% speak English very well, 23% speak English well, 26% speak English not well, 8% don't speak English at all).
3.4% of residents speak other Indo-European language at home (71% speak English very well, 22% speak English well, 5% speak English not well, 2% don't speak English at all).
10.0% of residents speak Asian or Pacific Island language at home (45% speak English very well, 21% speak English well, 24% speak English not well, 9% don't speak English at all).
3.2% of residents speak other language at home (62% speak English very well, 14% speak English well, 12% speak English not well, 12% don't speak English at all).
Foreign born population: 12,738 (24.6%)
(48.3% of them are naturalized citizens)
| Here: | 6.3 |
| State: | 6.5 |
| Here: | 3.9 |
| State: | 3.9 |
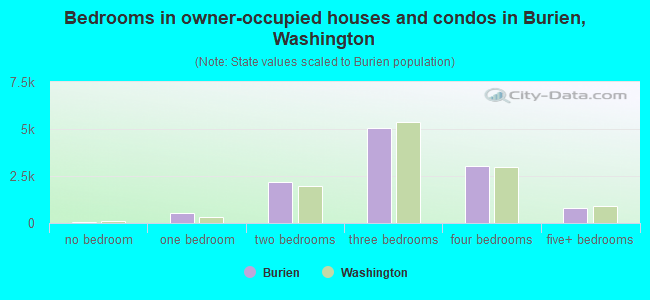
- Bedrooms in owner-occupied houses and condos in Burien, Washington
- 57no bedroom
- 5061 bedroom
- 2,1762 bedrooms
- 5,0673 bedrooms
- 3,0524 bedrooms
- 7765+ bedrooms
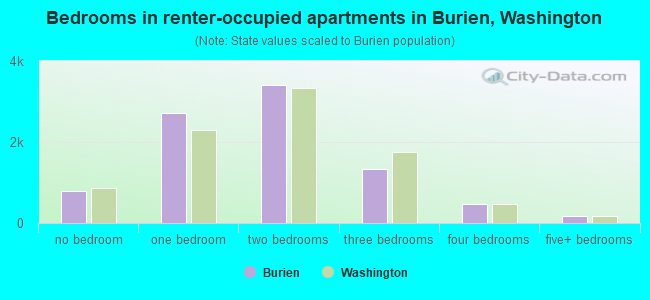
- Bedrooms in renter-occupied apartments in Burien, Washington
- 797no bedroom
- 2,7251 bedroom
- 3,4162 bedrooms
- 1,3263 bedrooms
- 4664 bedrooms
- 1635+ bedrooms
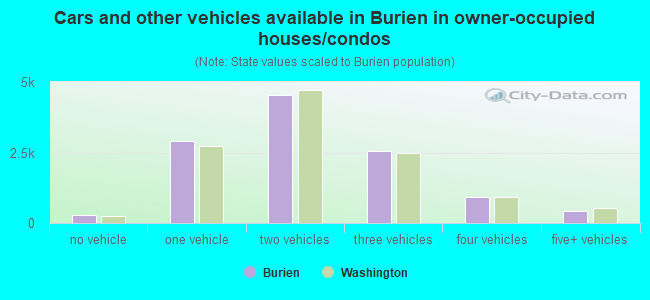
- Cars and other vehicles available in Burien in owner-occupied houses/condos
- 288no vehicle
- 2,9041 vehicle
- 4,5442 vehicles
- 2,5503 vehicles
- 9284 vehicles
- 4205+ vehicles
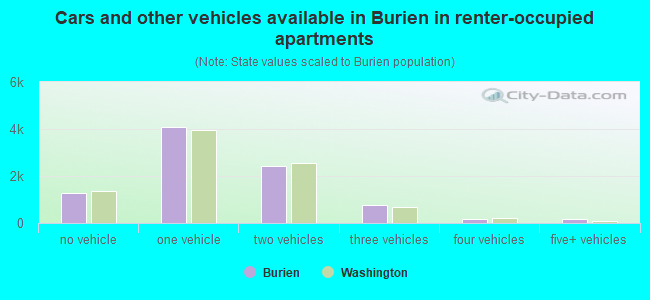
- Cars and other vehicles available in Burien in renter-occupied apartments
- 1,262no vehicle
- 4,0941 vehicle
- 2,4342 vehicles
- 7783 vehicles
- 1594 vehicles
- 1675+ vehicles
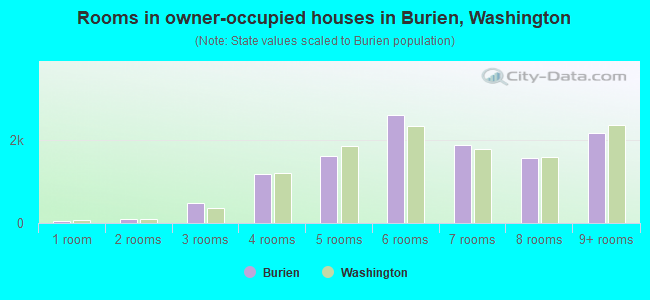
- Rooms in owner-occupied houses in Burien, Washington
- 471 room
- 972 rooms
- 4823 rooms
- 1,1894 rooms
- 1,6075 rooms
- 2,5976 rooms
- 1,8867 rooms
- 1,5548 rooms
- 2,1749+ rooms
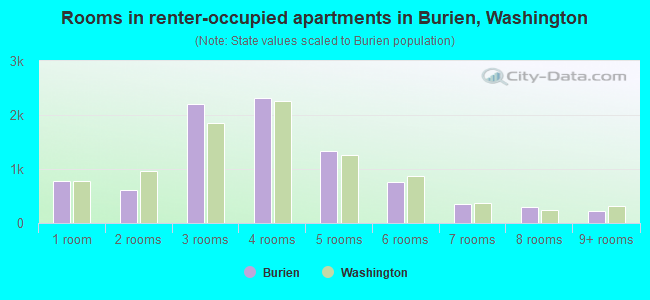
- Rooms in renter-occupied apartments in Burien, Washington
- 7761 room
- 6102 rooms
- 2,2053 rooms
- 2,3174 rooms
- 1,3425 rooms
- 7656 rooms
- 3597 rooms
- 2908 rooms
- 2319+ rooms
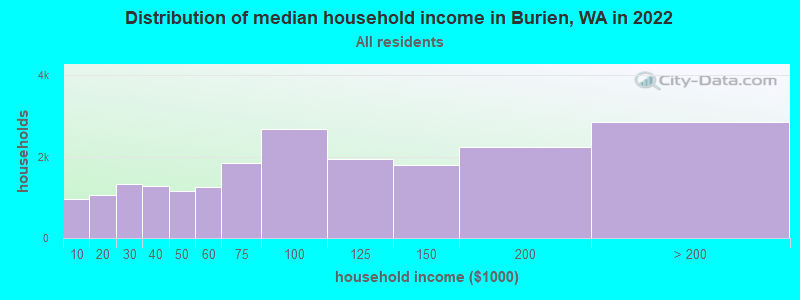
Burien, WA household income distribution

- 961Less than $10,000
- 1,064$10,000 to $19,999
- 1,335$20,000 to $29,999
- 1,287$30,000 to $39,999
- 1,164$40,000 to $49,999
- 1,249$50,000 to $59,999
- 1,839$60,000 to $74,999
- 2,676$75,000 to $99,999
- 1,938$100,000 to $124,999
- 1,785$125,000 to $149,999
- 2,230$150,000 to $199,999
- 2,848$200,000 or more
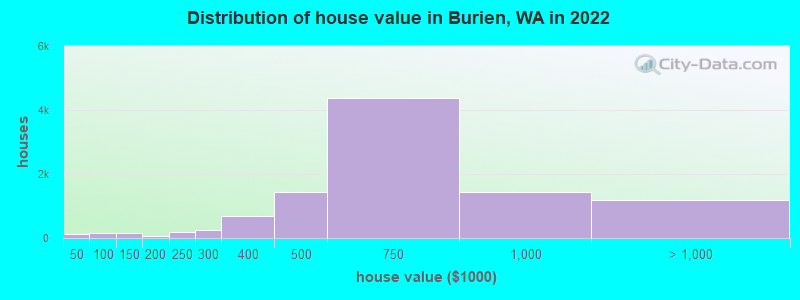
Home value of owner - occupied houses in 2022 in Burien, WA
-
- 39Less than $10,000
- 3$10,000 to $14,999
- 8$15,000 to $19,999
- 6$20,000 to $24,999
- 10$25,000 to $29,999
- 14$30,000 to $34,999
- 40$40,000 to $49,999
- 43$50,000 to $59,999
- 14$60,000 to $69,999
- 20$80,000 to $89,999
- 29$90,000 to $99,999
- 95$100,000 to $124,999
- 53$125,000 to $149,999
- 9$150,000 to $174,999
- 61$175,000 to $199,999
- 195$200,000 to $249,999
- 265$250,000 to $299,999
- 688$300,000 to $399,999
- 1,428$400,000 to $499,999
- 4,364$500,000 to $749,999
- 1,424$750,000 to $999,999
- 754$1,000,000 to $1,499,999
- 136$1,500,000 to $1,999,999
- 284$2,000,000 or more
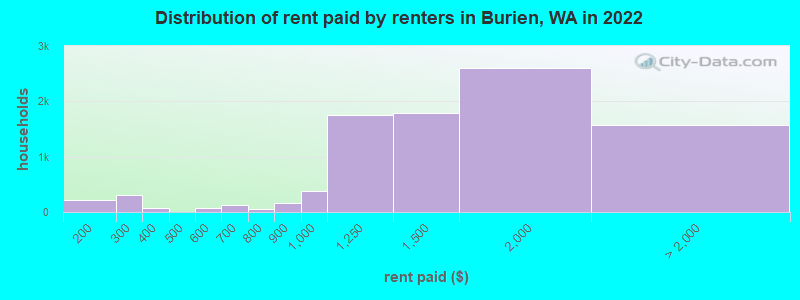
Rent paid by renters in 2022 in Burien, WA
-
- 214$150 to $199
- 236$200 to $249
- 69$250 to $299
- 57$300 to $349
- 22$350 to $399
- 63$500 to $549
- 17$550 to $599
- 71$600 to $649
- 54$650 to $699
- 56$700 to $749
- 4$750 to $799
- 159$800 to $899
- 386$900 to $999
- 1,758$1,000 to $1,249
- 1,796$1,250 to $1,499
- 2,606$1,500 to $1,999
- 836$2,000 to $2,499
- 327$2,500 to $2,999
- 128$3,000 to $3,499
- 145$3,500 or more
- 139No cash rent
Percentage of workers working in this county: 95.5%
Number of people working at home: 5,007 (18.5% of all workers)
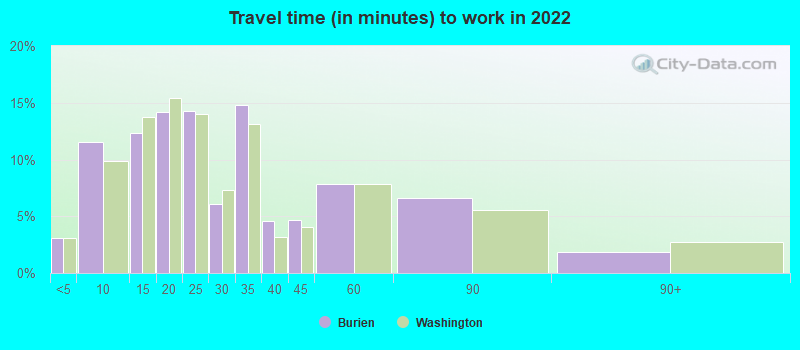
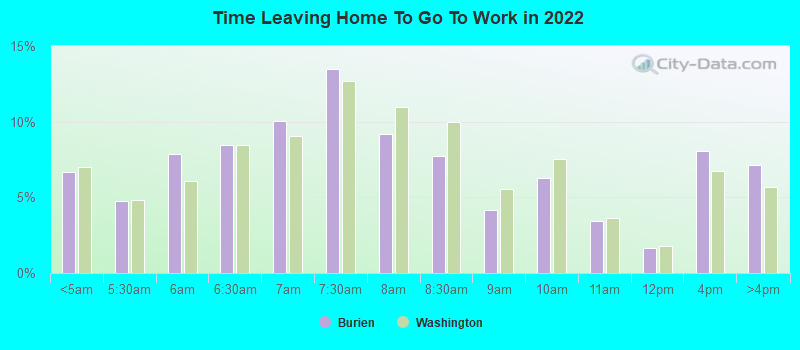
Travel time to work (commute)
- Less than 5 minutes: 417
- 5 to 9 minutes: 1,804
- 10 to 14 minutes: 2,379
- 15 to 19 minutes: 3,059
- 20 to 24 minutes: 3,370
- 25 to 29 minutes: 1,422
- 30 to 34 minutes: 3,291
- 35 to 39 minutes: 694
- 40 to 44 minutes: 1,297
- 45 to 59 minutes: 1,759
- 60 to 89 minutes: 1,220
- 90 or more minutes: 302
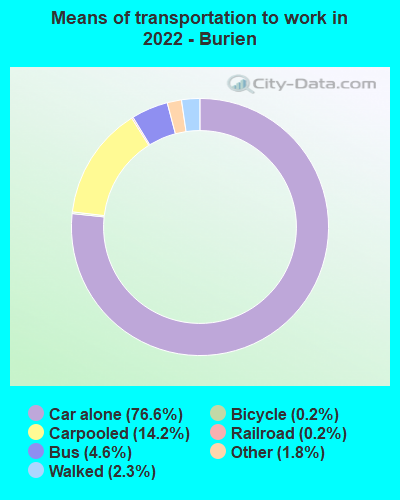
Means of transportation to work:
- Drove a car alone: 9,954 (57.9%)
- Carpooled: 1,774 (10.3%)
- Bus: 368 (2.1%)
- Long-distance train or commuter rail: 5 (0.0%)
- Light rail, streetcar or trolley: 38 (0.2%)
- Taxi: 209 (1.2%)
- Bicycle: 23 (0.1%)
- Walked: 262 (1.5%)
- Worked at home: 5,007 (29.1%)
- Unemployment by race in 2022
- Unemployment rate for White non-Hispanic residents
- 4.5%Males
- 5.0%Females
- Unemployment rate for Black residents
- 1.5%Males
- 6.9%Females
- Unemployment rate for Asian residents
- 6.4%Males
- 5.3%Females
- Unemployment rate for other race residents
- 0.6%Males
- 1.6%Females
- Unemployment rate for two or more race residents
- 2.8%Males
- 0.7%Females
- Unemployment rate for Hispanic or Latino residents
- 1.7%Males
- 1.0%Females
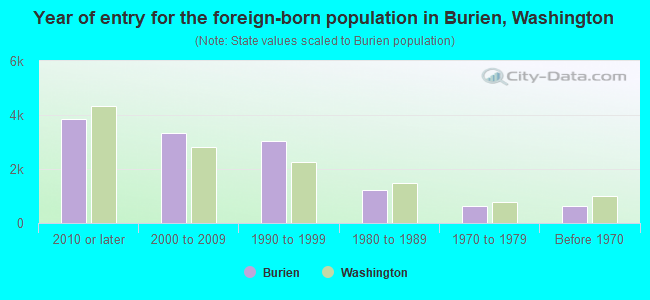
- Year of entry for the foreign-born population in Burien, Washington
- 3,8432010 or later
- 3,3162000 to 2009
- 3,0421990 to 1999
- 1,2321980 to 1989
- 6241970 to 1979
- 632Before 1970
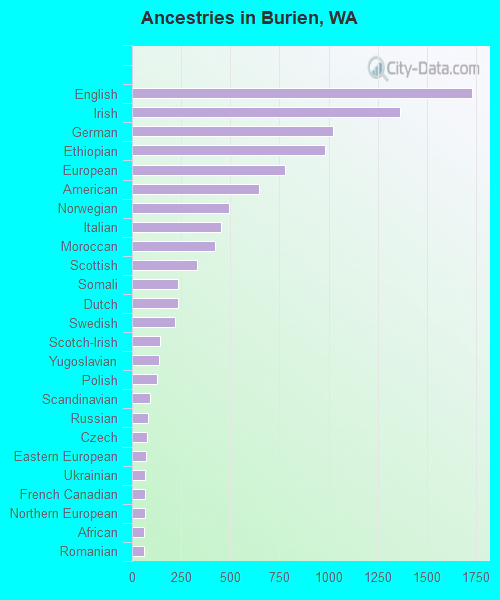
First ancestries reported:
- English: 1,730 (6.7%)
- Irish: 1,364 (5.3%)
- German: 1,025 (4.0%)
- Ethiopian: 980 (3.8%)
- European: 777 (3.0%)
- American: 645 (2.5%)
- Norwegian: 492 (1.9%)
- Italian: 454 (1.8%)
- Moroccan: 423 (1.6%)
- Scottish: 330 (1.3%)
- Somali: 236 (0.9%)
- Dutch: 233 (0.9%)
- Swedish: 219 (0.9%)
- Scotch-Irish: 144 (0.6%)
- Yugoslavian: 135 (0.5%)
- Polish: 128 (0.5%)
- Scandinavian: 93 (0.4%)
- Russian: 82 (0.3%)
- Czech: 77 (0.3%)
- Eastern European: 69 (0.3%)
- Ukrainian: 68 (0.3%)
- French Canadian: 68 (0.3%)
- Northern European: 68 (0.3%)
- African: 63 (0.2%)
- Romanian: 63 (0.2%)
- Iranian: 63 (0.2%)
- Portuguese: 49 (0.2%)
- Afghan: 49 (0.2%)
- Danish: 44 (0.2%)
- Arab: 38 (0.1%)
- British: 36 (0.1%)
- Slovene: 36 (0.1%)
- Nigerian: 33 (0.1%)
- Croatian: 31 (0.1%)
- Belgian: 30 (0.1%)
- Austrian: 29 (0.1%)
- Greek: 26 (0.1%)
- Belizean: 22 (0.09%)
- Bulgarian: 21 (0.08%)
- Australian: 21 (0.08%)
- French: 14 (0.05%)
- Hungarian: 14 (0.05%)
- Lithuanian: 13 (0.05%)
- Slovak: 11 (0.04%)
- Icelander: 10 (0.04%)
- Finnish: 9 (0.03%)
- Canadian: 9 (0.03%)
- Kenyan: 8 (0.03%)
- Armenian: 8 (0.03%)
- Pennsylvania German: 3 (0.01%)
Most common places of birth for foreign-born residents (%):
| Burien: | 23.0% (2,930) |
| Washington: | 21.1% (241,655) |
| Burien: | 18.5% (2,358) |
| Washington: | 5.4% (62,003) |
| Burien: | 10.9% (1,388) |
| Washington: | 0.6% (6,500) |
| Burien: | 7.6% (972) |
| Washington: | 6.3% (71,661) |
| Burien: | 4.4% (566) |
| Washington: | 1.2% (13,855) |
| Burien: | 3.9% (503) |
| Washington: | 1.6% (17,938) |
| Burien: | 3.8% (487) |
| Washington: | 1.0% (10,993) |
| Burien: | 3.0% (384) |
| Washington: | 1.2% (13,745) |
| Burien: | 2.1% (271) |
| Washington: | 8.9% (101,353) |
| Burien: | 2.1% (263) |
| Washington: | 0.2% (1,755) |
| Burien: | 1.8% (228) |
| Washington: | 4.3% (48,886) |
| Burien: | 1.5% (196) |
| Washington: | 7.4% (84,470) |
Place of birth for U.S.-born residents:
- This state: 24,437
- Other state: 13,553
- Northeast: 1,406
- Midwest: 3,678
- South: 2,439
- West: 6,050
86.0% of Burien residents lived in the same house 1 years ago.
Out of people who lived in different houses, 43.1% lived in this county.
Out of people who lived in different counties, 36.5% lived in Washington.
| Burien: | 86.0% |
| State average: | 85.2% |
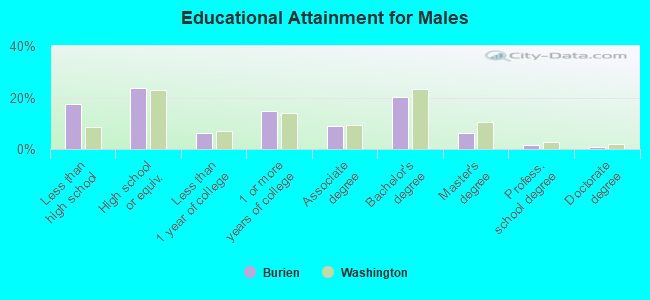
Education attainment for males 25 years and older:
- No schooling: 639
- Nursery to 4th grade: 288
- 5th and 6th grade: 461
- 7th and 8th grade: 430
- 9th grade: 585
- 10th grade: 145
- 11th grade: 109
- 12th grade, no diploma: 639
- High school graduate (or equivalency): 4,437
- Less than 1 year of college: 1,159
- Some college more than 1 year, no degree: 2,794
- Associate degree: 1,674
- Bachelor's degree: 3,790
- Master's degree: 1,154
- Professional school degree: 288
- Doctorate degree: 138
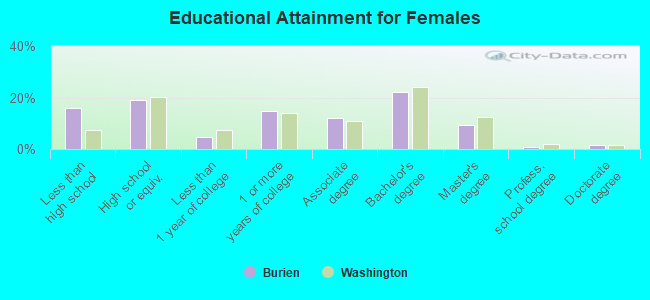
Education attainment for females 25 years and older:
- No schooling: 786
- Nursery to 4th grade: 265
- 5th and 6th grade: 435
- 7th and 8th grade: 258
- 9th grade: 217
- 10th grade: 288
- 11th grade: 291
- 12th grade, no diploma: 313
- High school graduate (or equivalency): 3,451
- Less than 1 year of college: 874
- Some college more than 1 year, no degree: 2,627
- Associate degree: 2,181
- Bachelor's degree: 3,957
- Master's degree: 1,670
- Professional school degree: 143
- Doctorate degree: 247
Housing units in structures:
- One, detached: 12,989
- One, attached: 370
- Two: 273
- 3 or 4: 743
- 5 to 9: 1,775
- 10 to 19: 2,064
- 20 to 49: 1,717
- 50 or more: 1,695
- Mobile homes: 178
Median worth of mobile homes: $332,526
Housing units lacking complete kitchen facilities in 2022: 1.2%
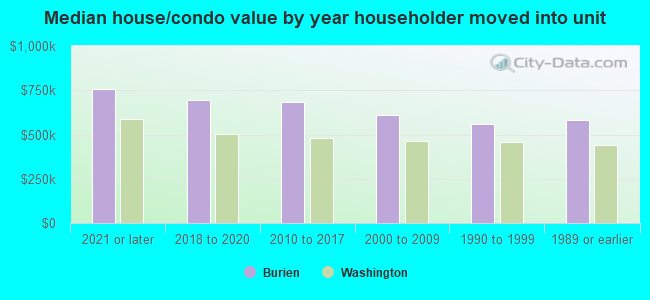
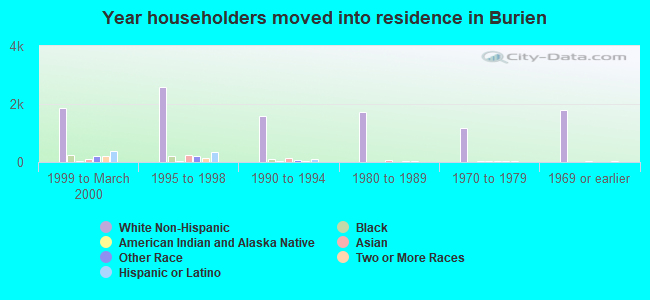
House/condo owner moved in on average 10 years ago
Renter moved in on average 4 years ago
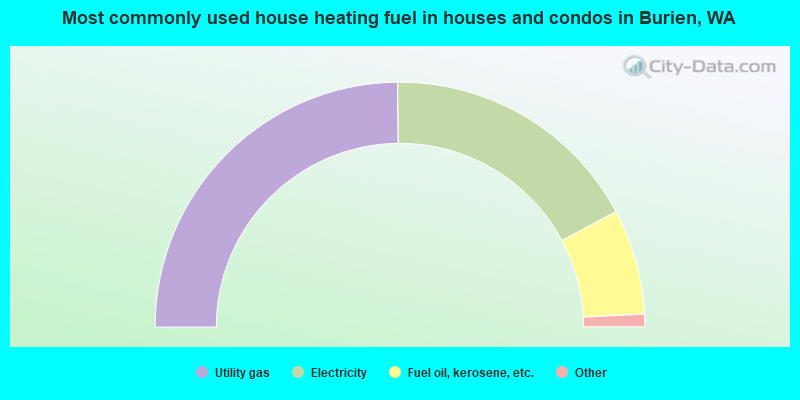
- 49.7%Utility gas
- 34.7%Electricity
- 13.9%Fuel oil, kerosene, etc.
- 1.1%Bottled, tank, or LP gas
- 0.2%Other fuel
- 0.2%Solar energy
- 0.2%Wood
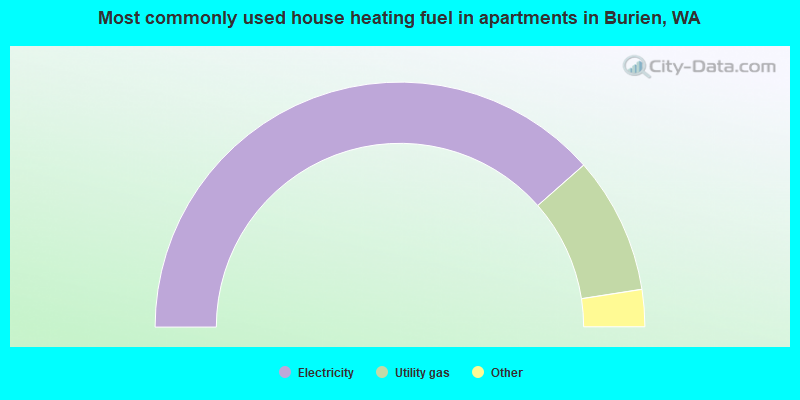
- 77.1%Electricity
- 18.1%Utility gas
- 2.9%Fuel oil, kerosene, etc.
- 0.7%No fuel used
- 0.6%Bottled, tank, or LP gas
- 0.5%Wood
- 0.1%Solar energy
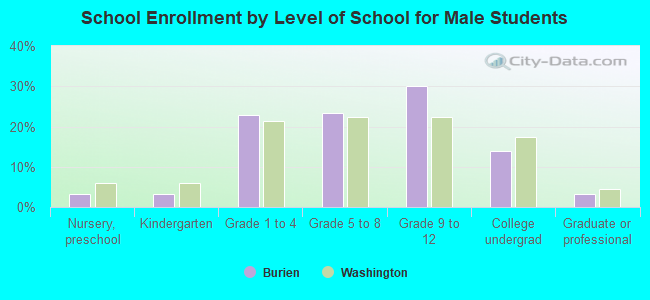
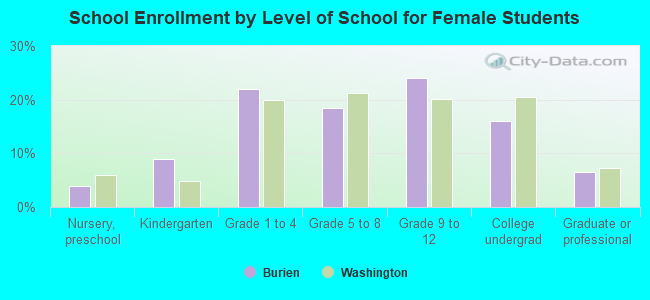
Private vs. public school enrollment:
| Here: | 8.4% |
| Washington: | 12.4% |
| Here: | 4.5% |
| Washington: | 9.2% |
| Here: | 13.3% |
| Washington: | 16.5% |