Housing density: 3,101 houses/condos per square mile
Median price asked for vacant for-sale houses and condos in 2022: $2,332,579.
Median contract rent in 2022: over $2,000 (lower quartile is $1,919, upper quartile is over $2,000)
Median rent asked for vacant for-rent units in 2022: $3,909
Median gross rent in Burlingame, CA in 2022: over $2,000
Housing units in Burlingame with a mortgage: 4,289 (731 second mortgage, 0 home equity loan, 671 both second mortgage and home equity loan) Houses without a mortgage: 69
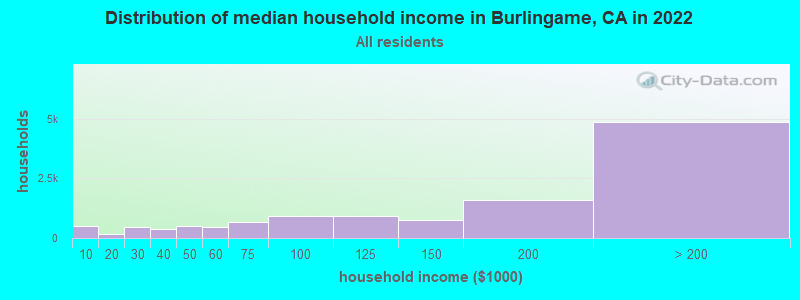
Median household income for houses/condos with a mortgage: $258,196
Median household income for apartments without a mortgage: $131,663
5,397 married couples with children.
1,043 single-parent households (379 men, 664 women).
64.5% of residents of Burlingame speak English at home.
9.0% of residents speak Spanish at home (54% speak English very well, 30% speak English well, 11% speak English not well, 4% don't speak English at all).
10.1% of residents speak other Indo-European language at home (79% speak English very well, 16% speak English well, 1% speak English not well, 4% don't speak English at all).
15.5% of residents speak Asian or Pacific Island language at home (59% speak English very well, 25% speak English well, 12% speak English not well, 4% don't speak English at all).
1.4% of residents speak other language at home (72% speak English very well, 5% speak English well, 20% speak English not well, 3% don't speak English at all).
Foreign born population: 9,158 (30.6%)
(55.8% of them are naturalized citizens)
Percentage of workers working in this county: 71.1% Number of people working at home: 4,213 (26.9% of all workers)
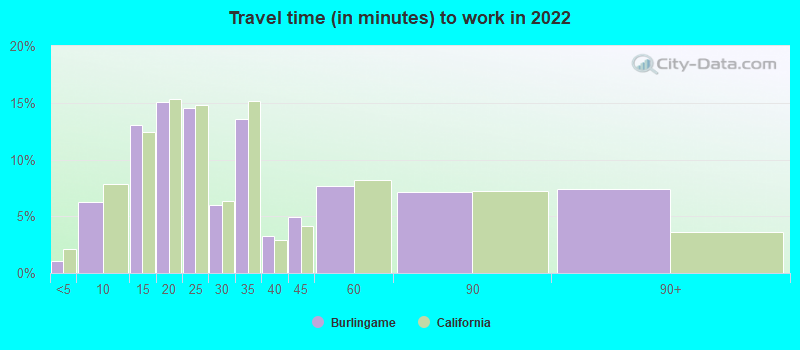
Travel time to work (commute)
Less than 5 minutes: 104
5 to 9 minutes: 876
10 to 14 minutes: 1,811
15 to 19 minutes: 1,260
20 to 24 minutes: 1,631
25 to 29 minutes: 577
30 to 34 minutes: 1,656
35 to 39 minutes: 687
40 to 44 minutes: 580
45 to 59 minutes: 911
60 to 89 minutes: 856
90 or more minutes: 341
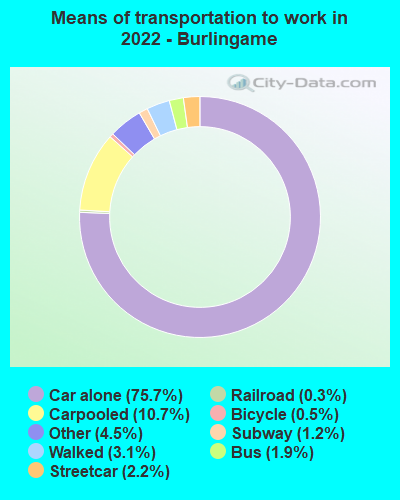
Means of transportation to work:
Drove a car alone: 17,841 (62.5%)
Carpooled: 2,748 (9.6%)
Bus: 395 (1.4%)
Subway or elevated rail: 412 (1.4%)
Long-distance train or commuter rail: 284 (1.0%)
Light rail, streetcar or trolley: 58 (0.2%)
Taxi: 868 (3.0%)
Bicycle: 142 (0.5%)
Walked: 823 (2.9%)
Worked at home: 4,213 (14.8%)
Unemployment by race in 2022
Unemployment rate for White non-Hispanic residents
5.1%Males
1.6%Females
Unemployment rate for Black residents
3.9%Males
8.3%Females
Unemployment rate for Asian residents
0.8%Males
4.6%Females
Unemployment rate for other race residents
3.6%Males
3.7%Females
Unemployment rate for two or more race residents
5.9%Males
2.0%Females
Unemployment rate for Hispanic or Latino residents
3.8%Males
5.6%Females
Year of entry for the foreign-born population in Burlingame, California
3,1802010 or later
1,6632000 to 2009
1,8251990 to 1999
1,7971980 to 1989
1,0811970 to 1979
1,586Before 1970
First ancestries reported:
Irish: 1,118 (6.8%)
Italian: 709 (4.3%)
English: 572 (3.5%)
Iranian: 480 (2.9%)
German: 467 (2.9%)
American: 371 (2.3%)
European: 338 (2.1%)
Russian: 273 (1.7%)
Ukrainian: 248 (1.5%)
Polish: 192 (1.2%)
Ghanaian: 133 (0.8%)
Brazilian: 117 (0.7%)
Turkish: 112 (0.7%)
Scottish: 104 (0.6%)
Greek: 102 (0.6%)
Palestinian: 101 (0.6%)
French: 91 (0.6%)
Swedish: 81 (0.5%)
Northern European: 80 (0.5%)
Norwegian: 66 (0.4%)
Portuguese: 62 (0.4%)
Hungarian: 54 (0.3%)
Lebanese: 48 (0.3%)
Croatian: 42 (0.3%)
Scotch-Irish: 42 (0.3%)
Eastern European: 41 (0.3%)
Finnish: 41 (0.3%)
British: 40 (0.2%)
Armenian: 35 (0.2%)
Czech: 30 (0.2%)
Scandinavian: 29 (0.2%)
Slavic: 26 (0.2%)
Iraqi: 23 (0.1%)
Canadian: 18 (0.1%)
Romanian: 18 (0.1%)
New Zealander: 13 (0.08%)
Swiss: 13 (0.08%)
Bulgarian: 12 (0.07%)
Basque: 10 (0.06%)
Celtic: 10 (0.06%)
Dutch: 8 (0.05%)
Arab: 7 (0.04%)
Australian: 7 (0.04%)
French Canadian: 6 (0.04%)
Moroccan: 4 (0.02%)
Most common places of birth for foreign-born residents (%):
China, excluding Hong Kong and Taiwan
Burlingame:
15.4% (1,431)
California:
6.6% (684,672)
Philippines
Burlingame:
11.2% (1,035)
California:
7.8% (818,297)
Mexico
Burlingame:
9.8% (906)
California:
37.2% (3,881,193)
India
Burlingame:
6.3% (587)
California:
5.2% (539,184)
Hong Kong
Burlingame:
5.2% (485)
California:
1.0% (105,215)
Ukraine
Burlingame:
3.5% (320)
California:
0.6% (60,761)
Taiwan
Burlingame:
3.2% (294)
California:
1.7% (176,274)
El Salvador
Burlingame:
2.9% (269)
California:
4.2% (440,287)
Canada
Burlingame:
2.8% (256)
California:
1.2% (127,477)
Brazil
Burlingame:
2.4% (218)
California:
0.5% (53,222)
Vietnam
Burlingame:
2.3% (209)
California:
4.9% (512,335)
Ireland
Burlingame:
2.1% (197)
California:
0.2% (16,042)
Korea
Burlingame:
2.1% (197)
California:
3.0% (315,248)
Japan
Burlingame:
2.1% (194)
California:
1.0% (103,575)
Iran
Burlingame:
1.8% (164)
California:
2.0% (206,004)
Place of birth for U.S.-born residents:
This state: 15,545
Other state: 4,790
Northeast: 1,430
Midwest: 1,459
South: 994
West: 896
86.5% of Burlingame residents lived in the same house 1 years ago. Out of people who lived in different houses, 31.2% lived in this county. Out of people who lived in different counties, 76.4% lived in California.
Burlingame:
86.5%
State average:
88.9%
Education attainment for males 25 years and older:
No schooling: 189
Nursery to 4th grade: 17
5th and 6th grade: 199
7th and 8th grade: 39
9th grade: 0
10th grade: 16
11th grade: 71
12th grade, no diploma: 131
High school graduate (or equivalency): 1,083
Less than 1 year of college: 387
Some college more than 1 year, no degree: 1,370
Associate degree: 663
Bachelor's degree: 3,478
Master's degree: 2,204
Professional school degree: 734
Doctorate degree: 573
Education attainment for females 25 years and older:
No schooling: 282
Nursery to 4th grade: 51
5th and 6th grade: 75
7th and 8th grade: 0
9th grade: 14
10th grade: 26
11th grade: 32
12th grade, no diploma: 119
High school graduate (or equivalency): 1,143
Less than 1 year of college: 401
Some college more than 1 year, no degree: 770
Associate degree: 462
Bachelor's degree: 3,937
Master's degree: 2,079
Professional school degree: 1,016
Doctorate degree: 481
Housing units in structures:
One, detached: 6,644
One, attached: 534
Two: 257
3 or 4: 546
5 to 9: 1,515
10 to 19: 1,220
20 to 49: 1,755
50 or more: 967
Housing units lacking complete plumbing facilities in 2022: 0.5%
Housing units lacking complete kitchen facilities in 2022: 1.6%
House/condo owner moved in on average 20 years ago