Burlington, NC (North Carolina) Houses and Residents
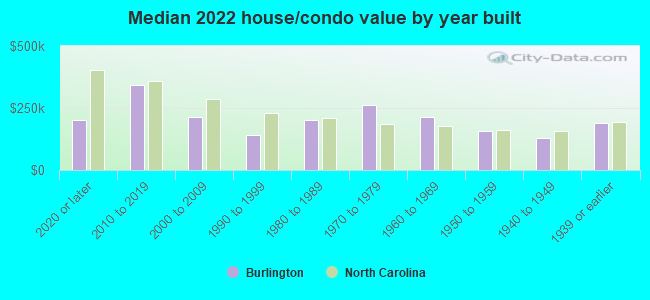
| Burlington: | $195,805 |
| North Carolina: | $280,600 |
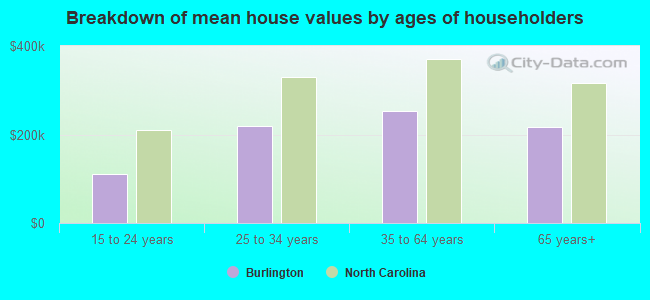
Mean price in 2022:
Detached houses: $251,905
Here: $251,905 State: $375,326 Townhouses or other attached units: $236,848
Here: $236,848 State: $317,935 In 2-unit structures: $158,110
Here: $158,110 State: $250,488 In 3-to-4-unit structures: $75,314
Here: $75,314 State: $254,939 In 5-or-more-unit structures: $138,166
Here: $138,166 State: $329,290 Mobile homes: $30,523
Here: $30,523 State: $124,933
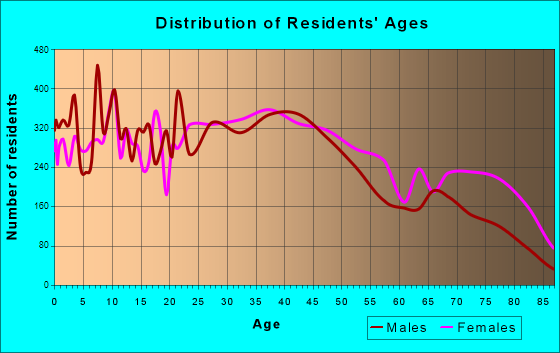
Total population: 51,812 (Urban population: 45,161, Rural population: 202 (all nonfarm))
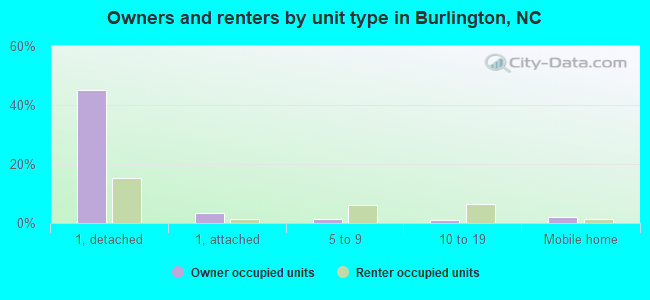
Houses: 27,390 (24,941 occupied: 13,796 owner occupied, 11,063 renter occupied)
| % of renters here: | 45% |
| State: | 33% |
Housing density: 1,287 houses/condos per square mile
Median price asked for vacant for-sale houses and condos in 2022: $80,971.
Median contract rent in 2022: $791 (lower quartile is $565, upper quartile is $1,093)
Median rent asked for vacant for-rent units in 2022: $1,190
Median gross rent in Burlington, NC in 2022: $962
Housing units in Burlington with a mortgage: 7,420 (650 second mortgage, 9 home equity loan, 494 both second mortgage and home equity loan)
Houses without a mortgage: 193
Median household income for houses/condos with a mortgage: $82,519
Median household income for apartments without a mortgage: $51,230
Median monthly housing costs: $901
Compare current foreclosures in Burlington, NC:
| Photo | Address | Area | Beds / Baths | Price | Details |
|---|---|---|---|---|---|

|
#1
Rebecca Ct
Burlington, NC 27217
|
2,010 sq. feet
|
3 baths 4 beds |
show details | |

|
#2
Kidd Dr
Burlington, NC 27217
|
1,364 sq. feet
|
1 baths 3 beds |
show details | |

|
#3
Elva Dr
Burlington, NC 27217
|
1,250 sq. feet
|
1 baths 3 beds |
show details | |

|
#4
Carter Rd
Burlington, NC 27217
|
1,722 sq. feet
|
1 baths 3 beds |
show details | |

|
#5
Sudie Dr
Burlington, NC 27217
|
1,512 sq. feet
|
2 baths 3 beds |
show details | |

|
#6
Trail One
Burlington, NC 27215
|
1,248 sq. feet
|
1 baths 3 beds |
show details | |

|
#7
Evergreen Ln
Burlington, NC 27215
|
1,175 sq. feet
|
1 baths 3 beds |
show details | |

|
#8
S Mebane St
Burlington, NC 27215
|
1,212 sq. feet
|
1 baths 3 beds |
show details | |

|
#9
Brassfield Dr
Burlington, NC 27217
|
1,440 sq. feet
|
2 baths 3 beds |
show details | |

|
#10
Fair St
Burlington, NC 27217
|
1,530 sq. feet
|
1 baths 3 beds |
show details |
| Photo | Address | Area | Beds / Baths | Price | Details |
|---|---|---|---|---|---|

|
#11
Harden St
Burlington, NC 27215
|
1,120 sq. feet
|
1 baths 3 beds |
show details | |

|
#12
Oakcrest Ct
Burlington, NC 27217
|
1,984 sq. feet
|
1 baths 4 beds |
show details | |

|
#13
Dailey Store Rd
Burlington, NC 27217
|
1,253 sq. feet
|
1 baths 3 beds |
show details | |

|
#14
James St
Burlington, NC 27217
|
1,200 sq. feet
|
2 baths 3 beds |
show details | |

|
#15
Hillside Dr
Burlington, NC 27215
|
800 sq. feet
|
1 baths 2 beds |
show details | |

|
#16
Mobile Manor Rd
Burlington, NC 27217
|
1,000 sq. feet
|
1 baths 3 beds |
show details | |

|
#17
Wilkins St
Burlington, NC 27217
|
1,396 sq. feet
|
1 baths 3 beds |
show details | |

|
#18
Rolling Rd
Burlington, NC 27217
|
1,150 sq. feet
|
1 baths 2 beds |
show details | |

|
#19
Grace Ave
Burlington, NC 27217
|
1,254 sq. feet
|
1 baths 3 beds |
show details | |

|
#20
Edgewood Ave
Burlington, NC 27215
|
2,385 sq. feet
|
2 baths 3 beds |
show details |
| Photo | Address | Area | Beds / Baths | Price | Details |
|---|---|---|---|---|---|

|
#21
Woodhaven Dr
Burlington, NC 27217
|
1,050 sq. feet
|
1 baths 3 beds |
show details | |

|
#22
Marlborough Rd
Burlington, NC 27215
|
1,800 sq. feet
|
2 baths 3 beds |
show details | |

|
#23
N Nc Highway 62
Burlington, NC 27217
|
1,281 sq. feet
|
1 baths 2 beds |
show details | |

|
#24
Tryon St
Burlington, NC 27217
|
1,169 sq. feet
|
1 baths 3 beds |
show details | |

|
#25
Tarleton Ave
Burlington, NC 27215
|
1,000 sq. feet
|
1 baths 3 beds |
show details | |

|
#26
Trail One
Burlington, NC 27215
|
1,050 sq. feet
|
1 baths 2 beds |
show details | |

|
#27
Texas Ave
Burlington, NC 27217
|
1,792 sq. feet
|
1 baths 2 beds |
show details | |

|
#28
Wilkins St
Burlington, NC 27217
|
1,486 sq. feet
|
2 baths 4 beds |
show details | |

|
#29
N Sellars Mill Rd
Burlington, NC 27217
|
1,608 sq. feet
|
2 baths 3 beds |
show details | |

|
#30
Bellemont Alamance Rd
Burlington, NC 27215
|
2,088 sq. feet
|
2 baths 2 beds |
show details |
| Photo | Address | Area | Beds / Baths | Price | Details |
|---|---|---|---|---|---|

|
#31
Hawthorne Ln
Burlington, NC 27215
|
888 sq. feet
|
1 baths 3 beds |
show details | |

|
#32
Bidney Dr
Burlington, NC 27215
|
1,687 sq. feet
|
1 baths 3 beds |
show details | |

|
#33
Kilby St
Burlington, NC 27215
|
2,956 sq. feet
|
3 baths 4 beds |
show details | |

|
#34
Longpine Rd
Burlington, NC 27215
|
1,500 sq. feet
|
2 baths 3 beds |
show details | |

|
#35
Sherwood Dr
Burlington, NC 27215
|
1,531 sq. feet
|
1 baths 3 beds |
show details | |

|
#36
Basil Holt Rd
Burlington, NC 27217
|
1,404 sq. feet
|
2 baths 3 beds |
show details | |

|
#37
Moran St Apt C
Burlington, NC 27215
|
- sq. feet
|
- baths - beds |
show details | |

|
#38
Forestdale Dr Apt Mi
Burlington, NC 27215
|
- sq. feet
|
- baths - beds |
show details | |

|
#39
Fern Glen Dr
Burlington, NC 27215
|
- sq. feet
|
- baths - beds |
show details | |

|
#40
Warwick Dr Unit 5a
Burlington, NC 27215
|
- sq. feet
|
- baths - beds |
show details |
| Photo | Address | Area | Beds / Baths | Price | Details |
|---|---|---|---|---|---|

|
#41
Morningside Dr
Burlington, NC 27217
|
- sq. feet
|
- baths - beds |
show details | |

|
#42
Cabin Rd
Burlington, NC 27215
|
- sq. feet
|
- baths - beds |
show details | |

|
#43
Woodhaven Dr
Burlington, NC 27217
|
- sq. feet
|
- baths - beds |
show details | |

|
#44
Clyde Thompson Trl
Burlington, NC 27217
|
- sq. feet
|
- baths - beds |
show details | |

|
#45
A Hwy 49
Burlington, NC 27217
|
- sq. feet
|
- baths - beds |
show details | |

|
#46
Forestdale Dr Apt Pf
Burlington, NC 27215
|
- sq. feet
|
- baths - beds |
show details | |

|
#47
Shoffner St
Burlington, NC 27215
|
- sq. feet
|
- baths - beds |
show details | |

|
#48
Moran St Apt 6-F
Burlington, NC 27215
|
- sq. feet
|
- baths - beds |
show details | |

|
#49
Queen Ann St
Burlington, NC 27217
|
- sq. feet
|
- baths - beds |
show details | |

|
Check over 1 million property listings on Foreclosure.com!
|
browse all offers | |||

Latest news about housing in Burlington, NC collected exclusively by city-data.com from local newspapers, TV, and radio stations


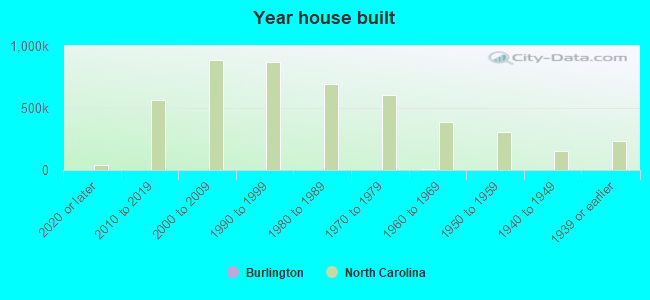
Median year apartment built: 1980
Household type by relationship:
Households: 58,467- Male householders: 10,365 (3,380 living alone), Female householders: 14,153 (5,197 living alone)
9,095 spouses (9,009 opposite-sex spouses), 1,977 unmarried partners, (1,942 opposite-sex unmarried partners), 17,756 children (16,441 natural, 572 adopted, 742 stepchildren), 876 grandchildren, 420 brothers or sisters, 1,207 parents, 0 foster children, 662 other relatives, 1,109 non-relatives
- In group quarters: 841
Size of family households: 6,914 2-persons, 4,105 3-persons, 2,271 4-persons, 1,060 5-persons, 253 6-persons, 254 7-or-more-persons.
Size of nonfamily households: 8,642 1-person, 1,350 2-persons, 46 3-persons, 14 5-persons.
5,085 married couples with children.
8,500 single-parent households (3,703 men, 4,797 women).
81.1% of residents of Burlington speak English at home.
15.6% of residents speak Spanish at home (50% speak English very well, 22% speak English well, 15% speak English not well, 13% don't speak English at all).
1.6% of residents speak other Indo-European language at home (88% speak English very well, 9% speak English well, 2% speak English not well).
1.4% of residents speak Asian or Pacific Island language at home (60% speak English very well, 36% speak English well, 4% speak English not well).
0.1% of residents speak other language at home (100% speak English very well).
Foreign born population: 7,099 (12.1%)
(40.7% of them are naturalized citizens)
| Here: | 6.1 |
| State: | 6.4 |
| Here: | 4.6 |
| State: | 4.4 |
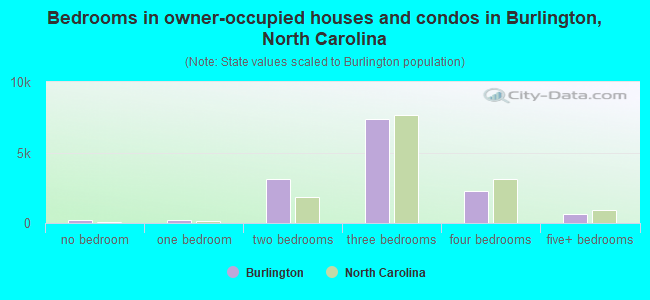
- Bedrooms in owner-occupied houses and condos in Burlington, North Carolina
- 192no bedroom
- 1921 bedroom
- 3,0872 bedrooms
- 7,3893 bedrooms
- 2,2694 bedrooms
- 6675+ bedrooms
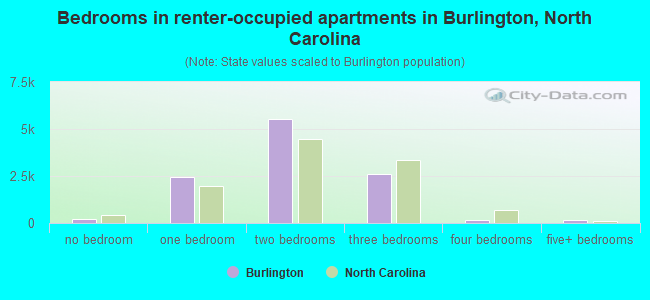
- Bedrooms in renter-occupied apartments in Burlington, North Carolina
- 230no bedroom
- 2,4291 bedroom
- 5,5202 bedrooms
- 2,5803 bedrooms
- 1424 bedrooms
- 1625+ bedrooms
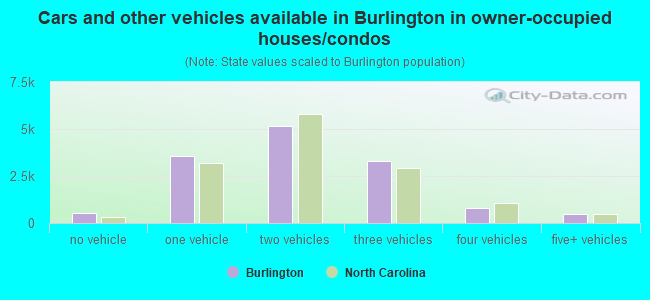
- Cars and other vehicles available in Burlington in owner-occupied houses/condos
- 506no vehicle
- 3,5601 vehicle
- 5,1562 vehicles
- 3,3013 vehicles
- 7994 vehicles
- 4755+ vehicles
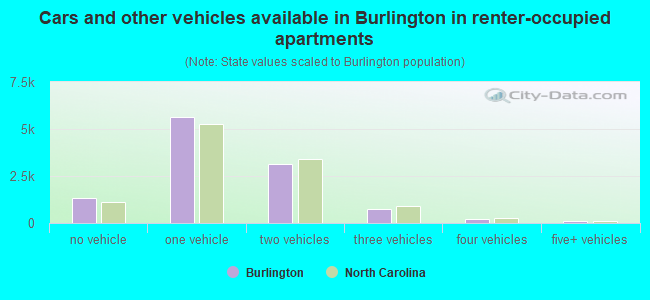
- Cars and other vehicles available in Burlington in renter-occupied apartments
- 1,307no vehicle
- 5,6251 vehicle
- 3,1152 vehicles
- 7213 vehicles
- 2094 vehicles
- 855+ vehicles
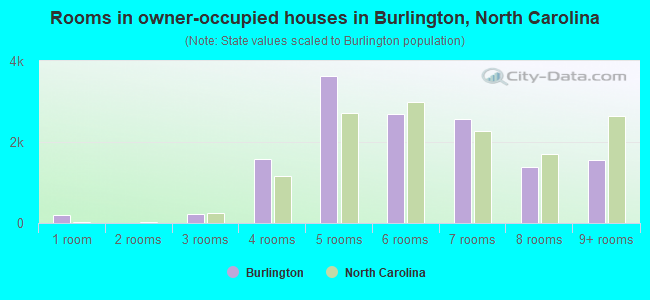
- Rooms in owner-occupied houses in Burlington, North Carolina
- 1921 room
- 02 rooms
- 2183 rooms
- 1,5804 rooms
- 3,6185 rooms
- 2,6946 rooms
- 2,5617 rooms
- 1,3808 rooms
- 1,5549+ rooms
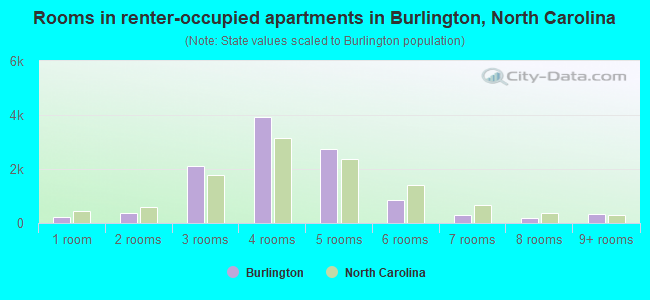
- Rooms in renter-occupied apartments in Burlington, North Carolina
- 2301 room
- 3632 rooms
- 2,1293 rooms
- 3,9364 rooms
- 2,7435 rooms
- 8546 rooms
- 2867 rooms
- 1938 rooms
- 3319+ rooms
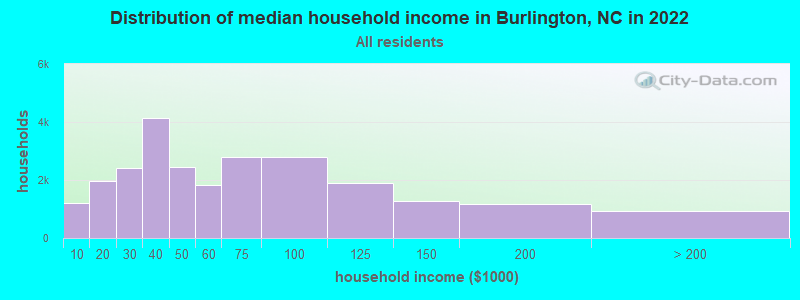
Burlington, NC household income distribution

- 1,202Less than $10,000
- 1,949$10,000 to $19,999
- 2,430$20,000 to $29,999
- 4,146$30,000 to $39,999
- 2,437$40,000 to $49,999
- 1,818$50,000 to $59,999
- 2,809$60,000 to $74,999
- 2,804$75,000 to $99,999
- 1,904$100,000 to $124,999
- 1,282$125,000 to $149,999
- 1,158$150,000 to $199,999
- 917$200,000 or more
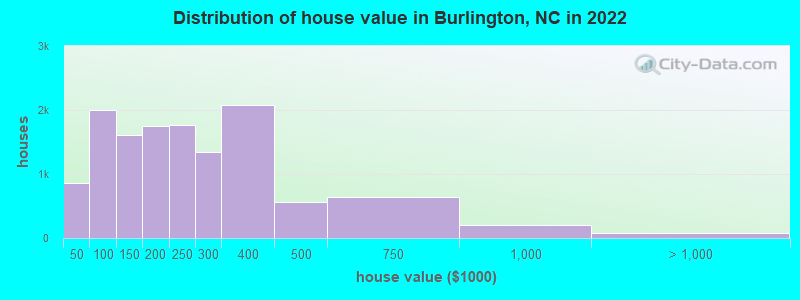
Home value of owner - occupied houses in 2022 in Burlington, NC
-
- 307Less than $10,000
- 28$10,000 to $14,999
- 273$15,000 to $19,999
- 3$20,000 to $24,999
- 37$25,000 to $29,999
- 38$30,000 to $34,999
- 19$35,000 to $39,999
- 146$40,000 to $49,999
- 57$50,000 to $59,999
- 130$60,000 to $69,999
- 579$70,000 to $79,999
- 472$80,000 to $89,999
- 616$90,000 to $99,999
- 876$100,000 to $124,999
- 729$125,000 to $149,999
- 1,186$150,000 to $174,999
- 569$175,000 to $199,999
- 1,761$200,000 to $249,999
- 1,342$250,000 to $299,999
- 2,075$300,000 to $399,999
- 560$400,000 to $499,999
- 647$500,000 to $749,999
- 203$750,000 to $999,999
- 20$1,000,000 to $1,499,999
- 55$2,000,000 or more
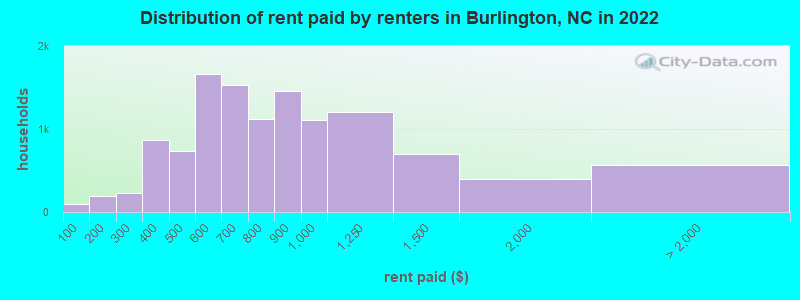
Rent paid by renters in 2022 in Burlington, NC
-
- 99Less than $100
- 119$100 to $149
- 69$150 to $199
- 94$200 to $249
- 132$250 to $299
- 190$300 to $349
- 673$350 to $399
- 582$400 to $449
- 157$450 to $499
- 1,076$500 to $549
- 589$550 to $599
- 1,169$600 to $649
- 364$650 to $699
- 513$700 to $749
- 608$750 to $799
- 1,458$800 to $899
- 1,111$900 to $999
- 1,209$1,000 to $1,249
- 697$1,250 to $1,499
- 391$1,500 to $1,999
- 5$2,000 to $2,499
- 21$2,500 to $2,999
- 39$3,000 to $3,499
- 88$3,500 or more
- 418No cash rent
Percentage of workers working in this county: 69.4%
Number of people working at home: 2,751 (10.0% of all workers)
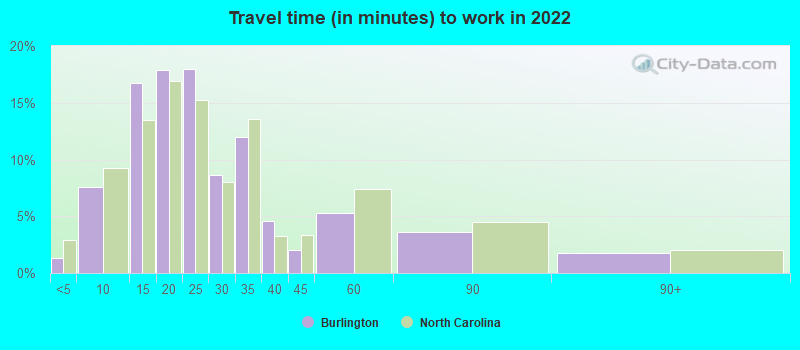
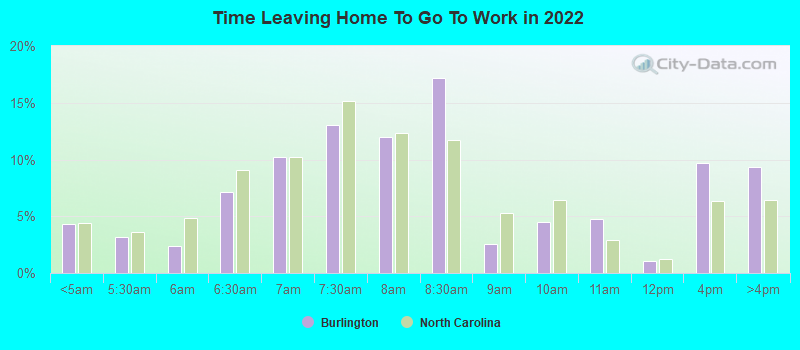
Travel time to work (commute)
- Less than 5 minutes: 711
- 5 to 9 minutes: 1,980
- 10 to 14 minutes: 3,795
- 15 to 19 minutes: 4,426
- 20 to 24 minutes: 4,209
- 25 to 29 minutes: 1,908
- 30 to 34 minutes: 1,542
- 35 to 39 minutes: 1,159
- 40 to 44 minutes: 843
- 45 to 59 minutes: 2,361
- 60 to 89 minutes: 717
- 90 or more minutes: 311
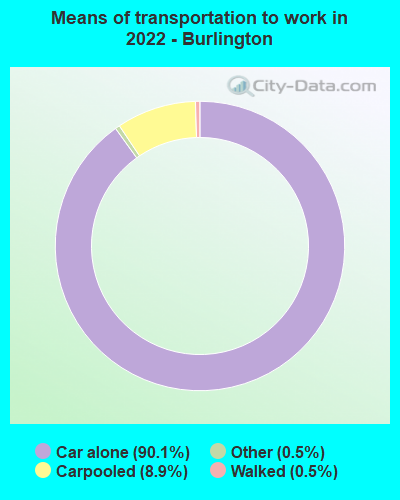
Means of transportation to work:
- Drove a car alone: 28,453 (80.4%)
- Carpooled: 2,919 (8.2%)
- Taxi: 166 (0.5%)
- Bicycle: 12 (0.0%)
- Walked: 175 (0.5%)
- Worked at home: 2,751 (7.8%)
- Unemployment by race in 2022
- Unemployment rate for White non-Hispanic residents
- 4.3%Males
- 2.2%Females
- Unemployment rate for Black residents
- 13.8%Males
- 1.2%Females
- Unemployment rate for Asian residents
- 10.6%Females
- Unemployment rate for other race residents
- 2.3%Males
- 2.3%Females
- Unemployment rate for two or more race residents
- 7.8%Males
- 4.8%Females
- Unemployment rate for Hispanic or Latino residents
- 6.2%Males
- 2.0%Females
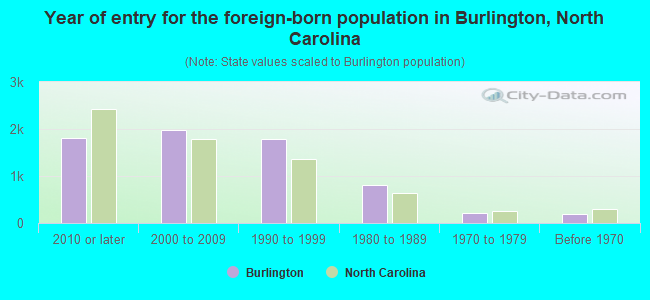
- Year of entry for the foreign-born population in Burlington, North Carolina
- 1,8092010 or later
- 1,9812000 to 2009
- 1,7821990 to 1999
- 8011980 to 1989
- 2081970 to 1979
- 194Before 1970
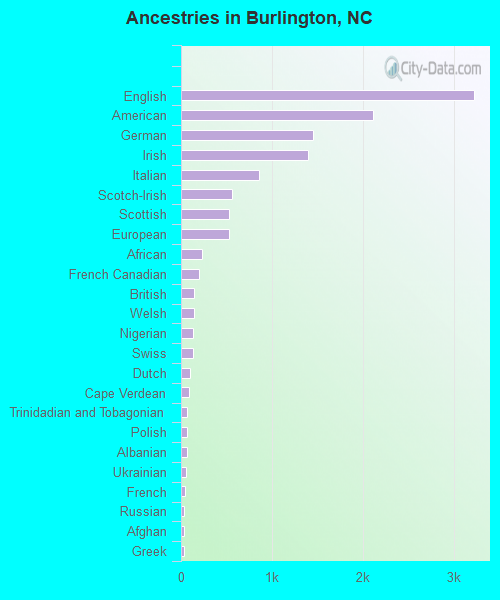
First ancestries reported:
- English: 3,226 (11.4%)
- American: 2,117 (7.5%)
- German: 1,453 (5.1%)
- Irish: 1,394 (4.9%)
- Italian: 857 (3.0%)
- Scotch-Irish: 566 (2.0%)
- Scottish: 529 (1.9%)
- European: 526 (1.9%)
- African: 233 (0.8%)
- French Canadian: 201 (0.7%)
- British: 144 (0.5%)
- Welsh: 140 (0.5%)
- Nigerian: 134 (0.5%)
- Swiss: 127 (0.4%)
- Dutch: 95 (0.3%)
- Cape Verdean: 88 (0.3%)
- Trinidadian and Tobagonian: 68 (0.2%)
- Polish: 62 (0.2%)
- Albanian: 61 (0.2%)
- Ukrainian: 60 (0.2%)
- French: 39 (0.1%)
- Russian: 37 (0.1%)
- Afghan: 36 (0.1%)
- Greek: 36 (0.1%)
- Czech: 28 (0.10%)
- Slovak: 27 (0.10%)
- Scandinavian: 19 (0.07%)
- Celtic: 18 (0.06%)
- Northern European: 17 (0.06%)
- Hungarian: 16 (0.06%)
- Austrian: 14 (0.05%)
- Moroccan: 13 (0.05%)
- Egyptian: 12 (0.04%)
- Croatian: 9 (0.03%)
- Swedish: 9 (0.03%)
- Danish: 9 (0.03%)
- Norwegian: 7 (0.02%)
- Palestinian: 6 (0.02%)
- Lithuanian: 6 (0.02%)
- Eastern European: 5 (0.02%)
Most common places of birth for foreign-born residents (%):
| Burlington: | 35.1% (2,479) |
| North Carolina: | 24.7% (214,776) |
| Burlington: | 12.9% (912) |
| North Carolina: | 3.8% (33,379) |
| Burlington: | 7.6% (538) |
| North Carolina: | 4.7% (40,707) |
| Burlington: | 3.5% (250) |
| North Carolina: | 2.4% (20,695) |
| Burlington: | 3.5% (249) |
| North Carolina: | 1.7% (15,135) |
| Burlington: | 3.4% (239) |
| North Carolina: | 9.3% (80,594) |
| Burlington: | 3.3% (236) |
| North Carolina: | 2.9% (24,965) |
| Burlington: | 3.0% (210) |
| North Carolina: | 0.7% (6,161) |
| Burlington: | 2.8% (196) |
| North Carolina: | 0.9% (7,765) |
| Burlington: | 2.3% (160) |
| North Carolina: | 2.1% (18,275) |
| Burlington: | 2.2% (157) |
| North Carolina: | 0.5% (4,128) |
| Burlington: | 1.8% (127) |
| North Carolina: | 1.1% (9,173) |
| Burlington: | 1.5% (107) |
| North Carolina: | 2.1% (18,105) |
Place of birth for U.S.-born residents:
- This state: 34,633
- Other state: 16,134
- Northeast: 5,661
- Midwest: 1,916
- South: 7,686
- West: 961
84.9% of Burlington residents lived in the same house 1 years ago.
Out of people who lived in different houses, 30.8% lived in this county.
Out of people who lived in different counties, 65.1% lived in North Carolina.
| Burlington: | 84.9% |
| State average: | 87.3% |
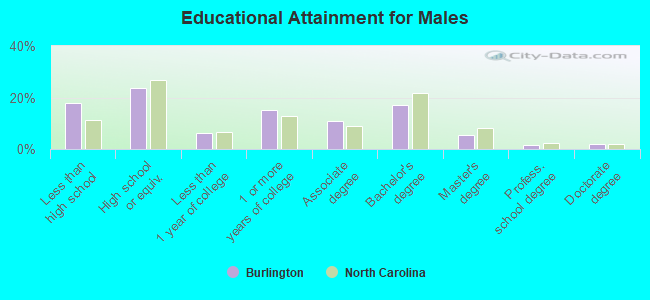
Education attainment for males 25 years and older:
- No schooling: 372
- Nursery to 4th grade: 667
- 5th and 6th grade: 379
- 7th and 8th grade: 347
- 9th grade: 448
- 10th grade: 293
- 11th grade: 273
- 12th grade, no diploma: 476
- High school graduate (or equivalency): 4,325
- Less than 1 year of college: 1,163
- Some college more than 1 year, no degree: 2,772
- Associate degree: 1,974
- Bachelor's degree: 3,128
- Master's degree: 1,023
- Professional school degree: 256
- Doctorate degree: 327
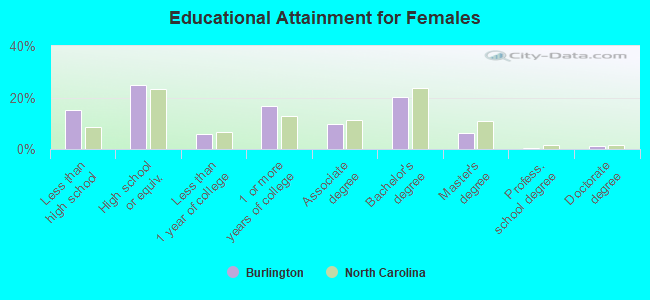
Education attainment for females 25 years and older:
- No schooling: 374
- Nursery to 4th grade: 162
- 5th and 6th grade: 651
- 7th and 8th grade: 391
- 9th grade: 323
- 10th grade: 438
- 11th grade: 606
- 12th grade, no diploma: 402
- High school graduate (or equivalency): 5,495
- Less than 1 year of college: 1,255
- Some college more than 1 year, no degree: 3,661
- Associate degree: 2,145
- Bachelor's degree: 4,514
- Master's degree: 1,342
- Professional school degree: 103
- Doctorate degree: 292
Housing units in structures:
- One, detached: 15,925
- One, attached: 1,288
- Two: 1,279
- 3 or 4: 1,822
- 5 to 9: 2,454
- 10 to 19: 1,616
- 20 to 49: 1,135
- 50 or more: 526
- Mobile homes: 1,341
Median worth of mobile homes: $18,804
Housing units lacking complete kitchen facilities in 2022: 1.6%
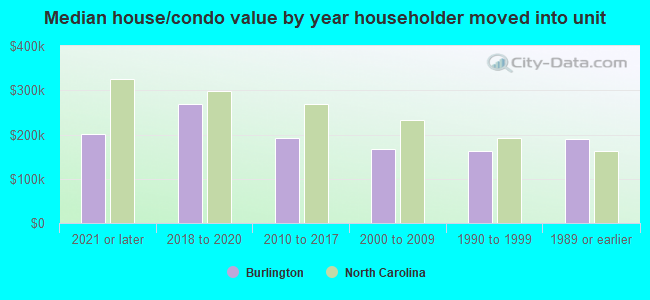
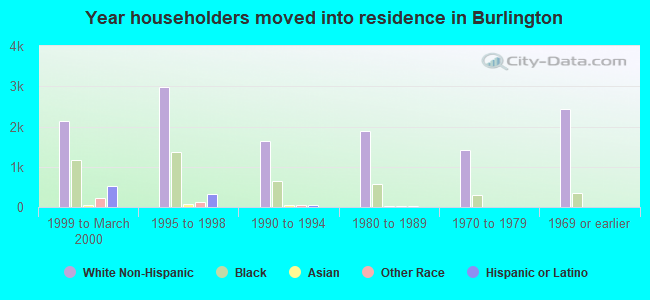
House/condo owner moved in on average 10 years ago
Renter moved in on average 3 years ago
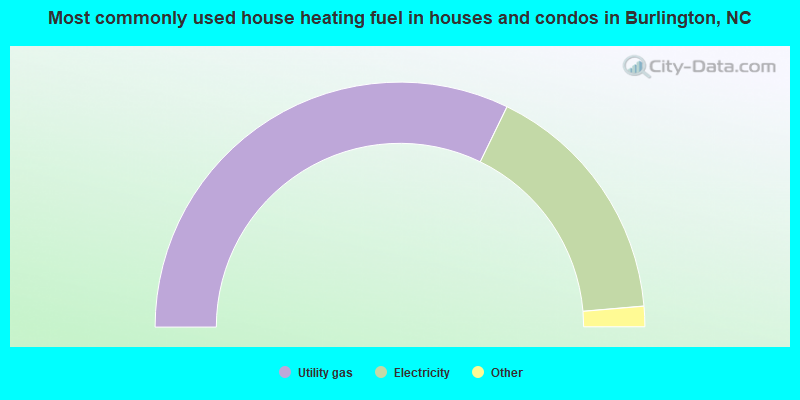
- 64.4%Utility gas
- 32.9%Electricity
- 1.4%Bottled, tank, or LP gas
- 0.6%Fuel oil, kerosene, etc.
- 0.4%No fuel used
- 0.1%Other fuel
- 0.1%Solar energy
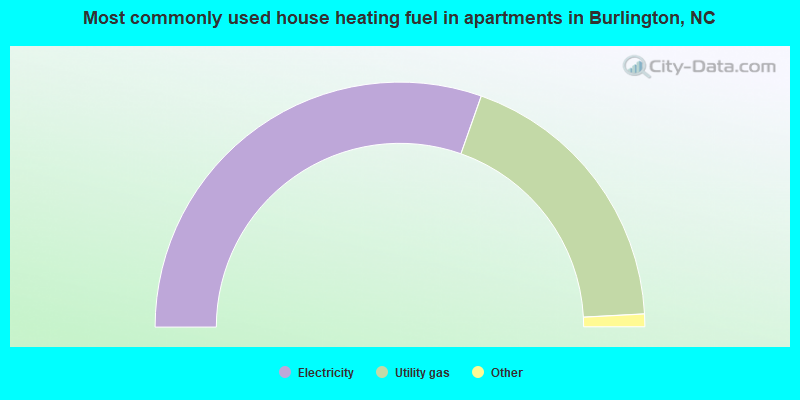
- 60.8%Electricity
- 37.5%Utility gas
- 1.0%Bottled, tank, or LP gas
- 0.3%No fuel used
- 0.2%Fuel oil, kerosene, etc.
- 0.2%Wood
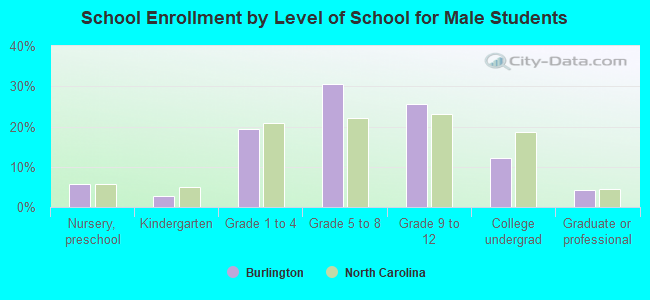
Private vs. public school enrollment:
| Here: | 10.3% |
| North Carolina: | 13.8% |
| Here: | 20.9% |
| North Carolina: | 11.9% |
| Here: | 26.1% |
| North Carolina: | 19.3% |