Calverton, MD (Maryland) Houses and Residents
Estimated median house or condo value in 2022: $480,436 (it was $166,600 in 2000 )
Calverton:
$480,436Maryland:
$398,100
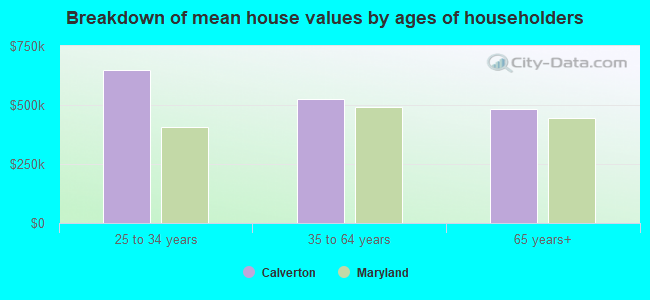
Lower value quartile - upper value quartile: $379,050 - $591,236Mean price in 2022: Detached houses: $529,828 Here:
$529,828State:
$526,819
Townhouses or other attached units: $375,569 Here:
$375,569State:
$328,305
In 5-or-more-unit structures: $297,491 Here:
$297,491State:
$350,378
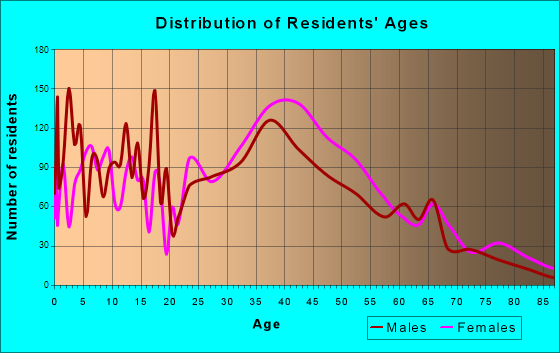
Total population: 17,724 (Urban population: 12,436, Rural population: 172 (all nonfarm) )
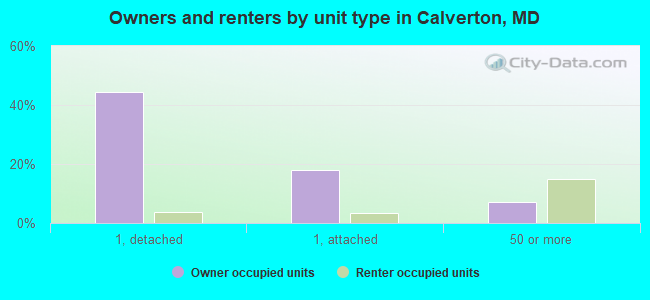
Houses: 6,373 (6,221 occupied: 4,380 owner occupied, 1,869 renter occupied )
% of renters here:
30%State:
32%
Housing density: 1,351 houses/condos per square mile
Median price asked for vacant for-sale houses and condos in 2022: $3,555,181.
Median contract rent in 2022: $1,800 (lower quartile is $1,338, upper quartile is over $2,000)
Median rent asked for vacant for-rent units in 2022: $3,730
Median gross rent in Calverton, MD in 2022: $1,986
Housing units in Calverton with a mortgage: 3,112 (164 second mortgage, 0 home equity loan, 142 both second mortgage and home equity loan )Houses without a mortgage: 34
Median household income for houses/condos with a mortgage: $124,265
Median household income for apartments without a mortgage: $98,248
Median monthly housing costs: $1,899
Data:
Median house or condo value ($)
Median house or condo value ($ change since 2000)
Median house or condo value ($) - White
Median house or condo value ($) - Black or African American
Median house or condo value ($) - Asian
Median house or condo value ($) - Hispanic or Latino
Median house or condo value ($) - American Indian and Alaska Native
Median house or condo value ($) - Multirace
Median house or condo value ($) - Other Race
Median price asked for mobile homes ($)
Household density (households per square mile)
Mean house or condo value by units in structure - 1, detached ($)
Mean house or condo value by units in structure - 1, attached ($)
Mean house or condo value by units in structure - 2 ($)
Mean house or condo value by units in structure by units in structure - 3 or 4 ($)
Mean house or condo value by units in structure - 5 or more ($)
Mean house or condo value by units in structure - Boat, RV, van, etc. ($)
Mean house or condo value by units in structure - Mobile home ($)
Median contract rent ($)
Median contract rent - Lower quartile ($)
Median contract rent - Upper quartile ($)
Median gross rent ($)
Urban houses (%)
Rural houses (%)
Houses occupied (%)
Houses occupied (% change since 2000)
Houses owner occupied (%)
Houses owner occupied (% change since 2000)
Houses renter occupied (%)
Houses renter occupied (% change since 2000)
Vacant housing units - For rent (%)
Vacant housing units - For rent (% change since 2000)
Vacant housing units - For sale only (%)
Vacant housing units - For sale only (% change since 2000)
Vacant housing units - Rented or sold, not occupied (%)
Vacant housing units - Rented or sold, not occupied (% change since 2000)
Vacant housing units - For seasonal, recreational, or occasional use (%)
Vacant housing units - For seasonal, recreational, or occasional use (% change since 2000)
Vacant housing units - For migrant workers (%)
Vacant housing units - For migrant workers (% change since 2000)
Vacant housing units - Other vacant (%)
Vacant housing units - Other vacant (% change since 2000)
Median monthly housing costs ($)
Median household income for houses/condos with a mortgage ($)
Median household income for houses/condos without a mortgage ($)
Median household income ($)
Median household income ($) - White
Median household income ($) - Black or African American
Median household income ($) - Asian
Median household income ($) - Hispanic or Latino
Median household income ($) - American Indian and Alaska Native
Median household income ($) - Multirace
Median household income ($) - Other Race
Mortgage status - with mortgage (%)
Mortgage status - with second mortgage (%)
Mortgage status - with home equity loan (%)
Mortgage status - with both second mortgage and home equity loan (%)
Mortgage status - without a mortgage (%)
Median year house/condo built
Median year apartment built
Household type by relationship - Male householder living alone (%)
Household type by relationship - Male householder not living alone (%)
Household type by relationship - Female householder living alone (%)
Household type by relationship - Female householder not living alone (%)
Household type by relationship - Opposite-Sex spouse (%)
Household type by relationship - Same-Sex spouse (%)
Household type by relationship - Opposite-Sex unmarried partner (%)
Household type by relationship - Same-Sex unmarried partner (%)
Household type by relationship - In group quarters (%)
Size of family households - 2-person household (%)
Size of family households - 3-person household (%)
Size of family households - 4-person household (%)
Size of family households - 5-person household (%)
Size of family households - 6-person household (%)
Size of family households - 7-or-more-person household (%)
Size of nonfamily households - 1-person household (%)
Size of nonfamily households - 2-person household (%)
Size of nonfamily households - 3-person household (%)
Size of nonfamily households - 4-person household (%)
Size of nonfamily households - 5-person household (%)
Size of nonfamily households - 6-person household (%)
Size of nonfamily households - 7-or-moreperson household (%)
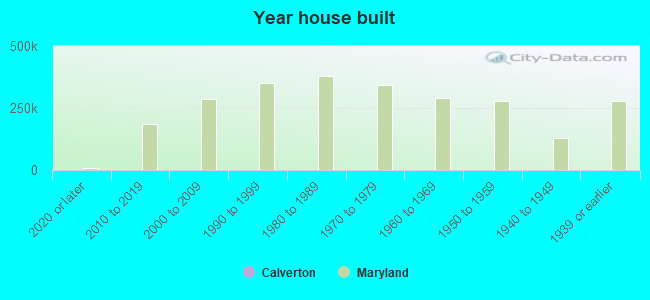
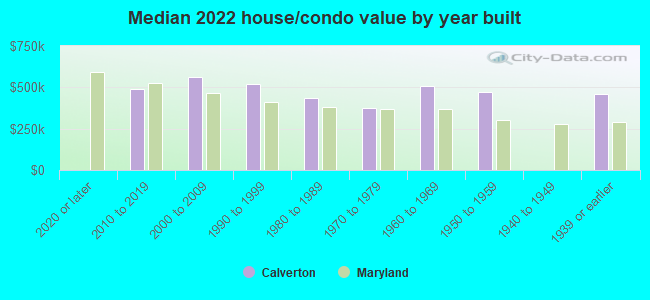
Year house built - Built 2010 or later (%)
Year house built - Built 2000 to 2009 (%)
Year house built - Built 1990 to 1999 (%)
Year house built - Built 1980 to 1989 (%)
Year house built - Built 1970 to 1979 (%)
Year house built - Built 1960 to 1969 (%)
Year house built - Built 1950 to 1959 (%)
Year house built - Built 1940 to 1949 (%)
Year house built - Built 1939 or earlier (%)
Median number of rooms in houses and condos
Median number of rooms in apartments
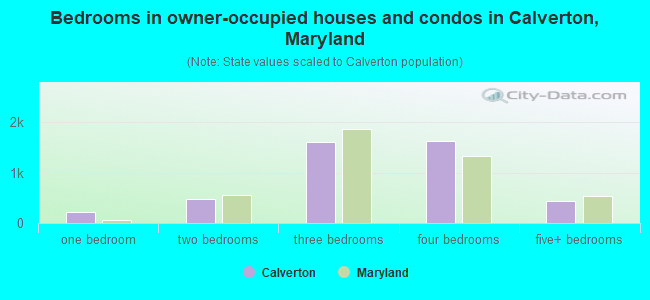
Median number of bedrooms in owner occupied houses
Mean number of bedrooms in owner occupied houses
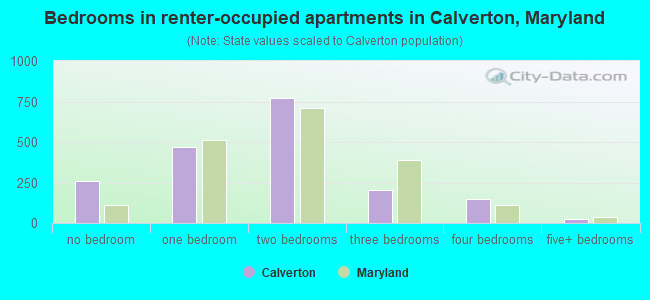
Median number of bedrooms in renter occupied houses
Mean number of bedrooms in renter occupied houses
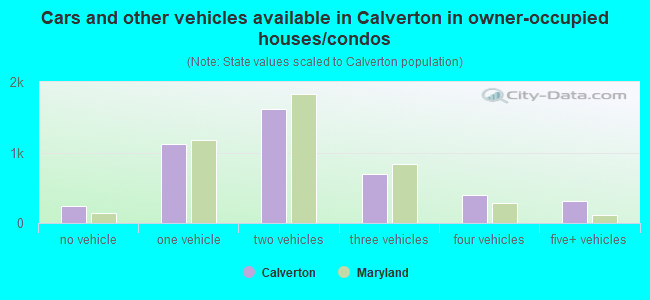
Median number of vehichles in owner occupied houses
Mean number of vehichles in owner occupied houses
Median number of vehichles in renter occupied houses
Mean number of vehichles in renter occupied houses
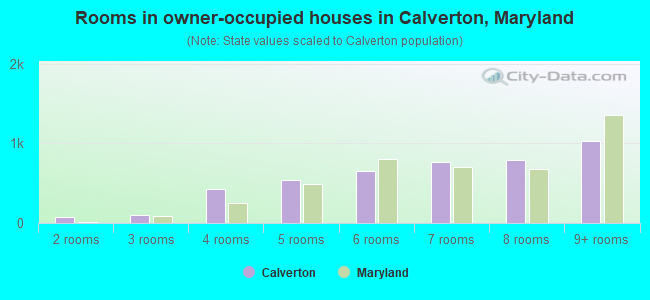
Rooms in owner-occupied houses - 1 room (%)
Rooms in owner-occupied houses - 2 rooms (%)
Rooms in owner-occupied houses - 3 rooms (%)
Rooms in owner-occupied houses - 4 rooms (%)
Rooms in owner-occupied houses - 5 rooms (%)
Rooms in owner-occupied houses - 6 rooms (%)
Rooms in owner-occupied houses - 7 rooms (%)
Rooms in owner-occupied houses - 8 rooms (%)
Rooms in owner-occupied houses - 9+ rooms (%)
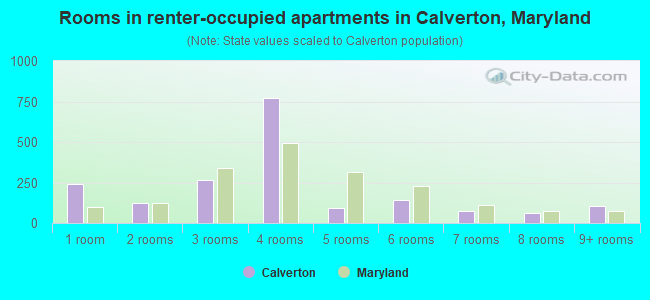
Rooms in renter-occupied houses - 1 room (%)
Rooms in renter-occupied houses - 2 rooms (%)
Rooms in renter-occupied houses - 3 rooms (%)
Rooms in renter-occupied houses - 4 rooms (%)
Rooms in renter-occupied houses - 5 rooms (%)
Rooms in renter-occupied houses - 6 rooms (%)
Rooms in renter-occupied houses - 7 rooms (%)
Rooms in renter-occupied houses - 8 rooms (%)
Rooms in renter-occupied houses - 9+ rooms (%)
Bedrooms in owner-occupied houses - no bedrooms (%)
Bedrooms in owner-occupied houses - 1 bedroom (%)
Bedrooms in owner-occupied houses - 2 bedrooms (%)
Bedrooms in owner-occupied houses - 3 bedrooms (%)
Bedrooms in owner-occupied houses - 4 bedrooms (%)
Bedrooms in owner-occupied houses - 5+ bedrooms (%)
Bedrooms in renter-occupied houses - no bedrooms (%)
Bedrooms in renter-occupied houses - 1 bedroom (%)
Bedrooms in renter-occupied houses - 2 bedrooms (%)
Bedrooms in renter-occupied houses - 3 bedrooms (%)
Bedrooms in renter-occupied houses - 4 bedrooms (%)
Bedrooms in renter-occupied houses - 5+ bedrooms (%)
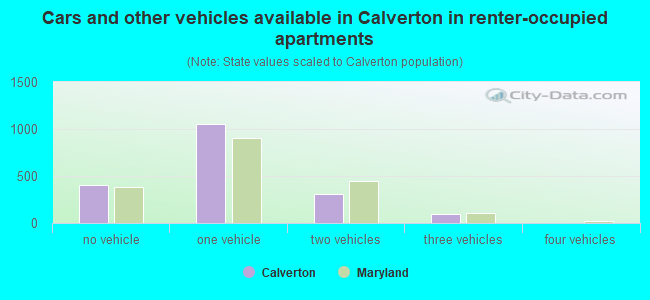
Vehicles available in owner-occupied houses - no vehicle available (%)
Vehicles available in owner-occupied houses - 1 vehicle available(%)
Vehicles available in owner-occupied houses - 2 Vehicles available (%)
Vehicles available in owner-occupied houses - 3 Vehicles available (%)
Vehicles available in owner-occupied houses - 4 Vehicles available (%)
Vehicles available in owner-occupied houses - 5+ Vehicles available (%)
Vehicles available in renter-occupied houses - no vehicle available (%)
Vehicles available in renter-occupied houses - 1 vehicle available (%)
Vehicles available in renter-occupied houses - 2 Vehicles available (%)
Vehicles available in renter-occupied houses - 3 Vehicles available (%)
Vehicles available in renter-occupied houses - 4 Vehicles available (%)
Vehicles available in renter-occupied houses - 5+ Vehicles available (%)
Housing units in structures - 1, detached (%)
Housing units in structures - 1, attached (%)
Housing units in structures - 2 (%)
Housing units in structures - 3 or 4 (%)
Housing units in structures - 5 to 9 (%)
Housing units in structures - 10 to 19 (%)
Housing units in structures - 20 to 49 (%)
Housing units in structures - 50 or more (%)
Housing units in structures - Mobile home (%)
Housing units in structures - Boat, RV, van, etc. (%)
Housing units in structures - Owners - 1, detached (%)
Housing units in structures - Owners - 1, attached (%)
Housing units in structures - Owners - 2 (%)
Housing units in structures - Owners - 3 or 4 (%)
Housing units in structures - Owners - 5 to 9 (%)
Housing units in structures - Owners - 10 to 19 (%)
Housing units in structures - Owners - 20 to 49 (%)
Housing units in structures - Owners - 50 or more (%)
Housing units in structures - Owners - Mobile home (%)
Housing units in structures - Owners - Boat, RV, van, etc. (%)
Housing units in structures - Renters - 1, detached (%)
Housing units in structures - Renters - 1, attached (%)
Housing units in structures - Renters - 2 (%)
Housing units in structures - Renters - 3 or 4 (%)
Housing units in structures - Renters - 5 to 9 (%)
Housing units in structures - Renters - 10 to 19 (%)
Housing units in structures - Renters - 20 to 49 (%)
Housing units in structures - Renters - 50 or more (%)
Housing units in structures - Renters - Mobile home (%)
Housing units in structures - Renters - Boat, RV, van, etc. (%)
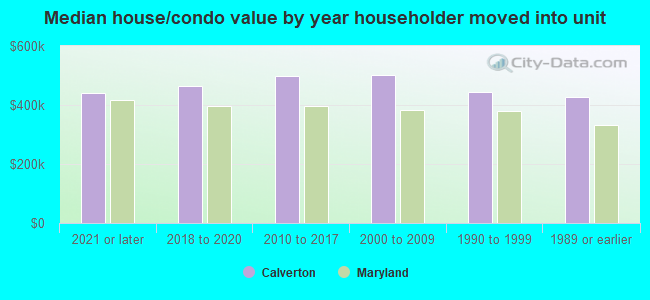
House/condo owner moved in on average (years ago)
Renter moved in on average (years ago)
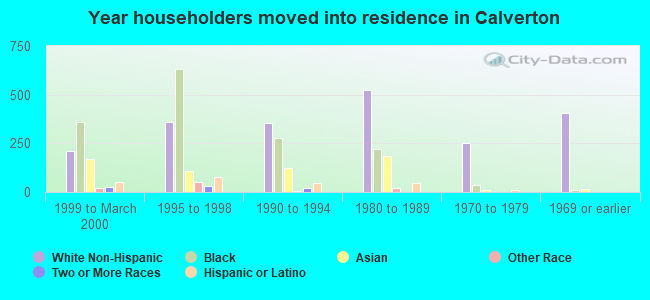
Year householder moved into unit - Moved in 1999 to March 2000 (%)
Year householder moved into unit - Moved in 1999 to March 2000 (%) - White
Year householder moved into unit - Moved in 1999 to March 2000 (%) - Black or African American
Year householder moved into unit - Moved in 1999 to March 2000 (%) - Asian
Year householder moved into unit - Moved in 1999 to March 2000 (%) - Hispanic or Latino
Year householder moved into unit - Moved in 1999 to March 2000 (%) - American Indian and Alaska Native
Year householder moved into unit - Moved in 1999 to March 2000 (%) - Multirace
Year householder moved into unit - Moved in 1999 to March 2000 (%) - Other Race
Year householder moved into unit - Moved in 1995 to 1998 (%)
Year householder moved into unit - Moved in 1995 to 1998 (%) - White
Year householder moved into unit - Moved in 1995 to 1998 (%) - Black or African American
Year householder moved into unit - Moved in 1995 to 1998 (%) - Asian
Year householder moved into unit - Moved in 1995 to 1998 (%) - Hispanic or Latino
Year householder moved into unit - Moved in 1995 to 1998 (%) - American Indian and Alaska Native
Year householder moved into unit - Moved in 1995 to 1998 (%) - Multirace
Year householder moved into unit - Moved in 1995 to 1998 (%) - Other Race
Year householder moved into unit - Moved in 1990 to 1994 (%)
Year householder moved into unit - Moved in 1990 to 1994 (%) - White
Year householder moved into unit - Moved in 1990 to 1994 (%) - Black or African American
Year householder moved into unit - Moved in 1990 to 1994 (%) - Asian
Year householder moved into unit - Moved in 1990 to 1994 (%) - Hispanic or Latino
Year householder moved into unit - Moved in 1990 to 1994 (%) - American Indian and Alaska Native
Year householder moved into unit - Moved in 1990 to 1994 (%) - Multirace
Year householder moved into unit - Moved in 1990 to 1994 (%) - Other Race
Year householder moved into unit - Moved in 1980 to 1989 (%)
Year householder moved into unit - Moved in 1980 to 1989 (%) - White
Year householder moved into unit - Moved in 1980 to 1989 (%) - Black or African American
Year householder moved into unit - Moved in 1980 to 1989 (%) - Asian
Year householder moved into unit - Moved in 1980 to 1989 (%) - Hispanic or Latino
Year householder moved into unit - Moved in 1980 to 1989 (%) - American Indian and Alaska Native
Year householder moved into unit - Moved in 1980 to 1989 (%) - Multirace
Year householder moved into unit - Moved in 1980 to 1989 (%) - Other Race
Year householder moved into unit - Moved in 1970 to 1979 (%)
Year householder moved into unit - Moved in 1970 to 1979 (%) - White
Year householder moved into unit - Moved in 1970 to 1979 (%) - Black or African American
Year householder moved into unit - Moved in 1970 to 1979 (%) - Asian
Year householder moved into unit - Moved in 1970 to 1979 (%) - Hispanic or Latino
Year householder moved into unit - Moved in 1970 to 1979 (%) - American Indian and Alaska Native
Year householder moved into unit - Moved in 1970 to 1979 (%) - Multirace
Year householder moved into unit - Moved in 1970 to 1979 (%) - Other Race
Year householder moved into unit - Moved in 1969 or earlier (%)
Year householder moved into unit - Moved in 1969 or earlier (%) - White
Year householder moved into unit - Moved in 1969 or earlier (%) - Black or African American
Year householder moved into unit - Moved in 1969 or earlier (%) - Asian
Year householder moved into unit - Moved in 1969 or earlier (%) - Hispanic or Latino
Year householder moved into unit - Moved in 1969 or earlier (%) - American Indian and Alaska Native
Year householder moved into unit - Moved in 1969 or earlier (%) - Multirace
Year householder moved into unit - Moved in 1969 or earlier (%) - Other Race
Housing units lacking complete plumbing facilities (%)
Housing units lacking complete kitchen facilities (%)
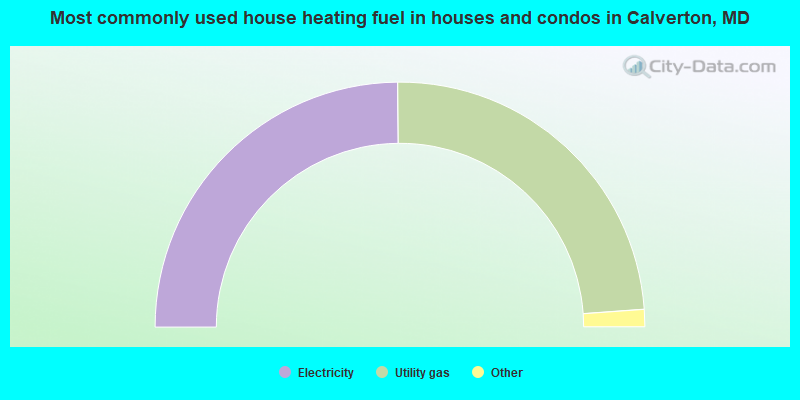
House heating fuel used in houses and condos - Utility gas (%)
House heating fuel used in houses and condos - Bottled, tank, or LP gas (%)
House heating fuel used in houses and condos - Electricity (%)
House heating fuel used in houses and condos - Fuel oil, kerosene, etc. (%)
House heating fuel used in houses and condos - Coal or coke (%)
House heating fuel used in houses and condos - Wood (%)
House heating fuel used in houses and condos - Solar energy (%)
House heating fuel used in houses and condos - Other fuel (%)
House heating fuel used in houses and condos - No fuel used (%)
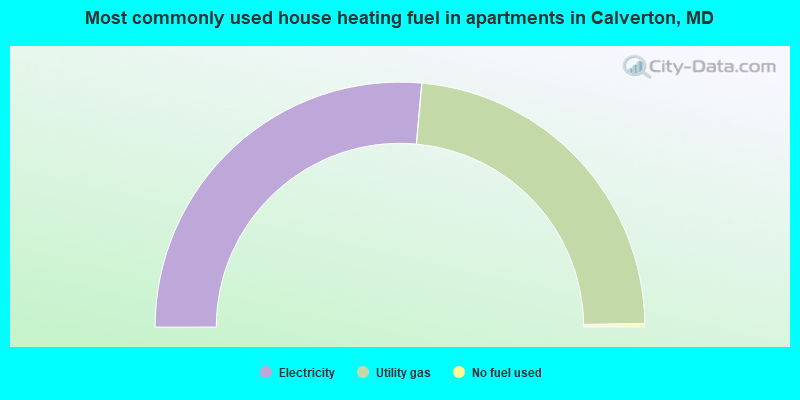
House heating fuel used in apartments - Utility gas (%)
House heating fuel used in apartments - Bottled, tank, or LP gas (%)
House heating fuel used in apartments - Electricity (%)
House heating fuel used in apartments - Fuel oil, kerosene, etc. (%)
House heating fuel used in apartments - Coal or coke (%)
House heating fuel used in apartments - Wood (%)
House heating fuel used in apartments - Solar energy (%)
House heating fuel used in apartments - Other fuel (%)
House heating fuel used in apartments - No fuel used (%)
Latest news about housing in Calverton, MD collected exclusively by city-data.com from local newspapers, TV, and radio stations
Median year house/condo built: 1984Median year apartment built: 1986Household type by relationship:
Households: 18,128
Male householders: 3,228 (548 living alone ), Female householders: 2,845 (1,068 living alone )2,846 spouses (2,846 opposite-sex spouses ), 206 unmarried partners , (206 opposite-sex unmarried partners ), 5,540 children (5,068 natural , 127 adopted , 344 stepchildren ), 453 grandchildren , 171 brothers or sisters , 622 parents , 0 foster children , 1,008 other relatives , 906 non-relatives In group quarters: 300
Size of family households: 1,707 2-persons , 833 3-persons , 637 4-persons , 601 5-persons , 399 6-persons , 204 7-or-more-persons .
Size of nonfamily households: 1,591 1-person , 219 2-persons , 11 3-persons , 6 4-persons , 4 6-persons .
2,567 married couples with children. single-parent households (446 men , 411 women ).
48.7% of residents of Calverton speak English at home. of residents speak Spanish at home (45% speak English very well , 33% speak English well , 18% speak English not well , 4% don't speak English at all ).of residents speak other Indo-European language at home (76% speak English very well , 23% speak English well , 1% speak English not well ).of residents speak Asian or Pacific Island language at home (64% speak English very well , 18% speak English well , 15% speak English not well , 3% don't speak English at all ).of residents speak other language at home (75% speak English very well , 21% speak English well , 2% speak English not well , 2% don't speak English at all ).
Foreign born population: 8,275 (45.6%)of them are naturalized citizens )
Median number of rooms in houses and condos:
Median number of rooms in apartments
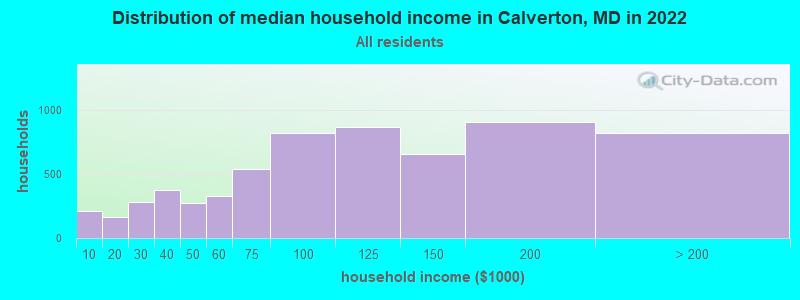
Calverton, MD household income distribution 207 Less than $10,000165 $10,000 to $19,999284 $20,000 to $29,999376 $30,000 to $39,999273 $40,000 to $49,999328 $50,000 to $59,999539 $60,000 to $74,999822 $75,000 to $99,999865 $100,000 to $124,999656 $125,000 to $149,999904 $150,000 to $199,999821 $200,000 or more
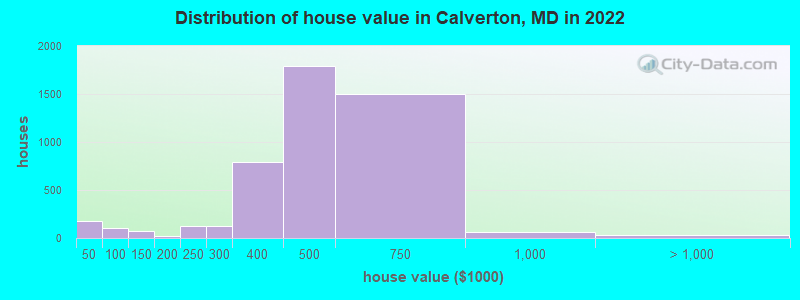
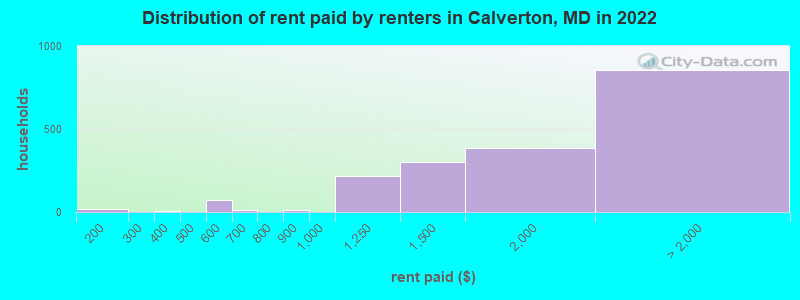
Home value of owner - occupied houses in 2022 in Calverton, MD 64 Less than $10,00010 $20,000 to $24,99912 $30,000 to $34,99984 $40,000 to $49,9994 $70,000 to $79,99918 $90,000 to $99,99923 $100,000 to $124,99948 $125,000 to $149,99916 $150,000 to $174,999121 $200,000 to $249,999129 $250,000 to $299,999793 $300,000 to $399,9991,790 $400,000 to $499,9991,498 $500,000 to $749,99964 $750,000 to $999,99910 $1,000,000 to $1,499,99923 $2,000,000 or moreRent paid by renters in 2022 in Calverton, MD 6 $100 to $14910 $150 to $1995 $350 to $39960 $500 to $54914 $550 to $59915 $600 to $64914 $800 to $899217 $1,000 to $1,249302 $1,250 to $1,499383 $1,500 to $1,999260 $2,000 to $2,49955 $2,500 to $2,999242 $3,000 to $3,499153 $3,500 or more145 No cash rent
Percentage of workers working in this county: 42.6%Number of people working at home: 682 (8.3% of all workers )
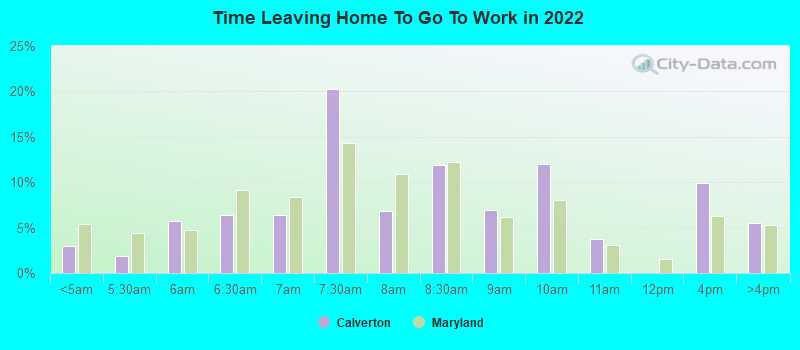
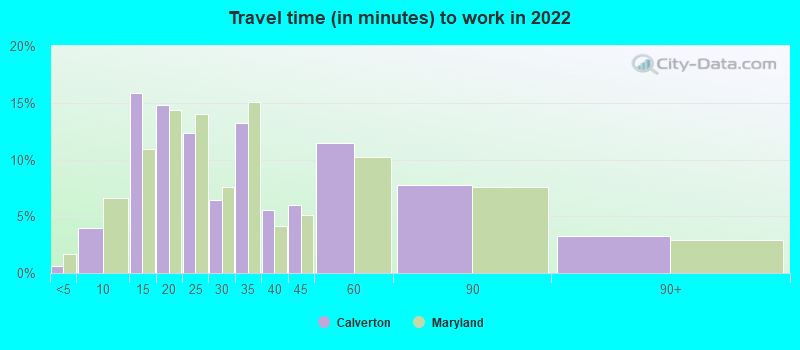
Travel time to work (commute)
Less than 5 minutes: 55 to 9 minutes: 27110 to 14 minutes: 85115 to 19 minutes: 54620 to 24 minutes: 71825 to 29 minutes: 46630 to 34 minutes: 1,71335 to 39 minutes: 58340 to 44 minutes: 44745 to 59 minutes: 1,12760 to 89 minutes: 50790 or more minutes: 217
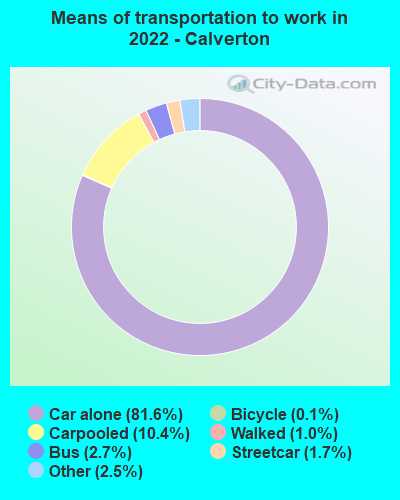
Means of transportation to work:
Drove a car alone: 5,865 (72.5%)Carpooled: 680 (8.4%)Bus : 136 (1.7%)Subway or elevated rail : 85 (1.1%)Taxi: 230 (2.8%)Bicycle: 9 (0.1%)Walked: 70 (0.9%)Worked at home: 682 (8.4%)
Unemployment by race in 2022
Unemployment rate for White non-Hispanic residents 1.2% Males5.7% FemalesUnemployment rate for Black residents 9.1% Males2.8% FemalesUnemployment rate for Asian residents 3.5% FemalesUnemployment rate for other race residents 3.0% Males18.0% FemalesUnemployment rate for two or more race residents 12.4% FemalesUnemployment rate for Hispanic or Latino residents 2.0% Males14.4% Females
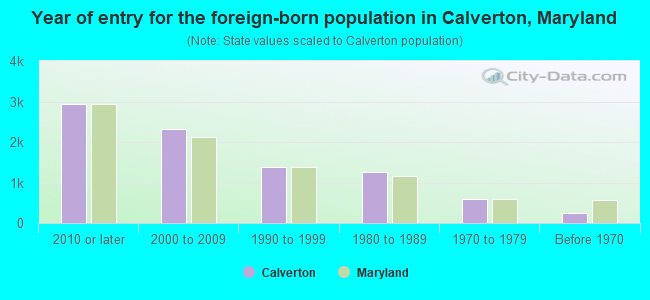
Year of entry for the foreign-born population in Calverton, Maryland
2,942 2010 or later 2,326 2000 to 2009 1,395 1990 to 1999 1,267 1980 to 1989 584 1970 to 1979 242 Before 1970
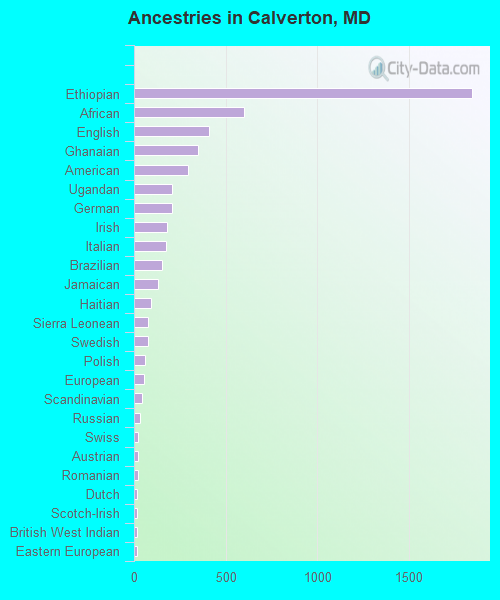
First ancestries reported:
Ethiopian: 1,846 (15.5%)
African: 599 (5.0%)
English: 410 (3.4%)
Ghanaian: 349 (2.9%)
American: 296 (2.5%)
Ugandan: 209 (1.8%)
German: 205 (1.7%)
Irish: 180 (1.5%)
Italian: 174 (1.5%)
Brazilian: 154 (1.3%)
Jamaican: 131 (1.1%)
Haitian: 92 (0.8%)
Sierra Leonean: 79 (0.7%)
Swedish: 79 (0.7%)
Polish: 58 (0.5%)
European: 55 (0.5%)
Scandinavian: 41 (0.3%)
Russian: 31 (0.3%)
Swiss: 24 (0.2%)
Austrian: 21 (0.2%)
Romanian: 21 (0.2%)
Dutch: 19 (0.2%)
Scotch-Irish: 18 (0.2%)
British West Indian: 18 (0.2%)
Eastern European: 17 (0.1%)
Slovak: 11 (0.09%)
Trinidadian and Tobagonian: 11 (0.09%)
Nigerian: 9 (0.08%)
Pennsylvania German: 8 (0.07%)
Israeli: 6 (0.05%) Most common places of birth for foreign-born residents (%): Ethiopia Calverton:
24.8% (2,027)Maryland:
3.2% (30,870)
El Salvador Calverton:
20.1% (1,639)Maryland:
12.0% (115,412)
Vietnam Calverton:
6.7% (546)Maryland:
1.9% (18,716)
India Calverton:
6.3% (518)Maryland:
6.4% (61,725)
Peru Calverton:
3.7% (303)Maryland:
1.8% (17,161)
Brazil Calverton:
3.7% (301)Maryland:
1.2% (11,980)
Cameroon Calverton:
3.7% (298)Maryland:
2.5% (23,969)
Honduras Calverton:
3.1% (253)Maryland:
2.5% (24,026)
Uganda Calverton:
2.7% (218)Maryland:
0.2% (1,672)
Jamaica Calverton:
2.5% (207)Maryland:
2.8% (27,444)
Mexico Calverton:
2.5% (200)Maryland:
3.5% (34,065)
South Africa Calverton:
2.3% (189)Maryland:
0.3% (3,203)
Ghana Calverton:
2.2% (182)Maryland:
1.8% (17,774)
Sierra Leone Calverton:
1.7% (137)Maryland:
1.1% (10,233)
Burma (Myanmar) Calverton:
1.7% (136)Maryland:
0.5% (4,888)
Liberia Calverton:
1.6% (128)Maryland:
0.6% (5,959)
Place of birth for U.S.-born residents:
This state: 4,727Other state: 5,219Northeast: 1,733Midwest: 915South: 2,354West: 458 89.8% of Calverton residents lived in the same house 1 years ago.
Out of people who lived in different houses, 37.4% lived in this county.
Out of people who lived in different counties, 65.4% lived in Maryland.
Calverton:
89.8%State average:
88.5%
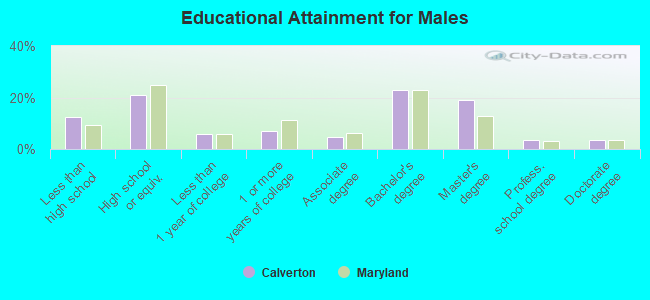
Education attainment for males 25 years and older:
No schooling: 266Nursery to 4th grade: 375th and 6th grade: 1097th and 8th grade: 109th grade: 12910th grade: 5511th grade: 1212th grade, no diploma: 151High school graduate (or equivalency): 1,321Less than 1 year of college: 366Some college more than 1 year, no degree: 432Associate degree: 300Bachelor's degree: 1,432Master's degree: 1,190Professional school degree: 220Doctorate degree: 219
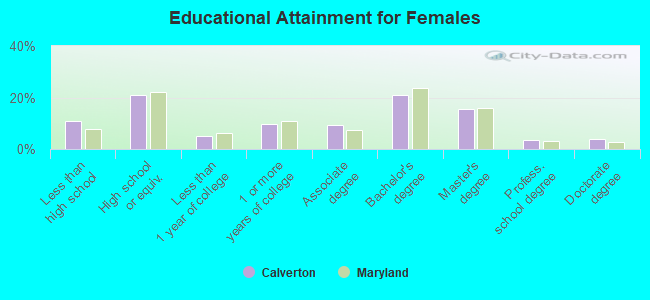
Education attainment for females 25 years and older:
No schooling: 260Nursery to 4th grade: 05th and 6th grade: 347th and 8th grade: 569th grade: 4410th grade: 2911th grade: 9412th grade, no diploma: 186High school graduate (or equivalency): 1,363Less than 1 year of college: 331Some college more than 1 year, no degree: 632Associate degree: 592Bachelor's degree: 1,360Master's degree: 1,010Professional school degree: 235Doctorate degree: 253
Housing units in structures:
One, detached: 3,033One, attached: 1,252Two: 425 to 9: 11310 to 19: 29820 to 49: 23750 or more: 1,373Mobile homes: 22Housing units lacking complete plumbing facilities in 2022: 0.5%Housing units lacking complete kitchen facilities in 2022: 0.5%House/condo owner moved in on average 9 years ago
Renter moved in on average 2 years ago
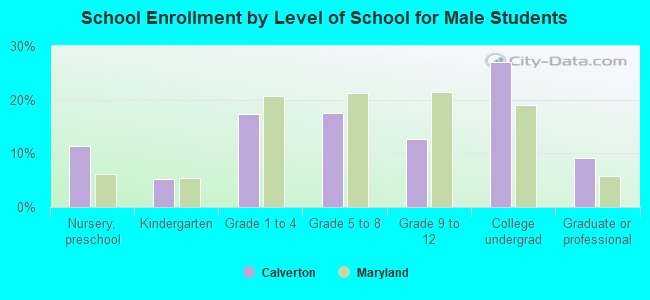
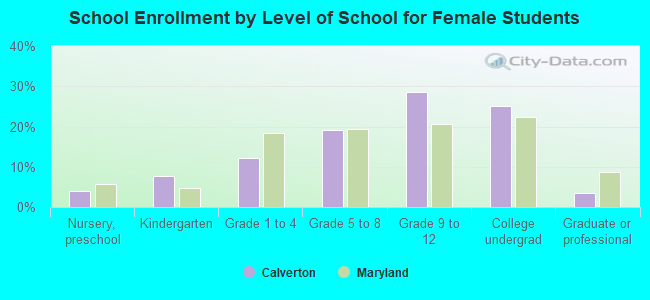
Private vs. public school enrollment:
Students in private schools in grades 1 to 8 (elementary and middle school): 215 Students in private schools in grades 9 to 12 (high school): 127 Students in private undergraduate colleges: 29