Cambridge, MA (Massachusetts) Houses and Residents
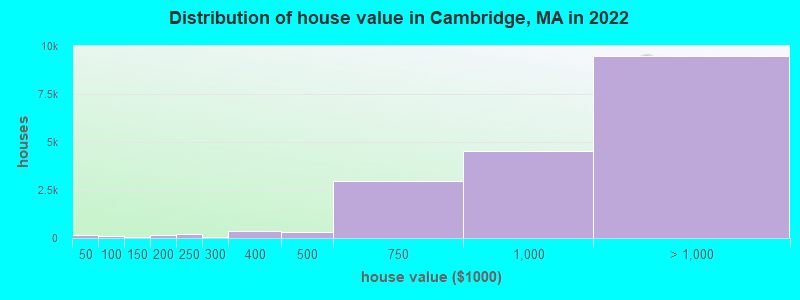
Estimated median house or condo value in 2022: $1,023,900 (it was $331,600 in 2000 )
Cambridge:
$1,023,900Massachusetts:
$534,700
Lower value quartile - upper value quartile: $761,700 - $1,551,800Mean price in 2022: Detached houses: $1,977,975 Here:
$1,977,975State:
$651,570
Townhouses or other attached units: $1,595,129 Here:
$1,595,129State:
$617,749
In 2-unit structures: $1,337,423 Here:
$1,337,423State:
$594,808
In 3-to-4-unit structures: $881,306 Here:
$881,306State:
$601,912
In 5-or-more-unit structures: $860,276 Here:
$860,276State:
$555,768
Total population: 109,694 (Urban population: 101,355, Rural population: 0)
Houses: 56,934 (50,861 occupied: 17,110 owner occupied, 33,751 renter occupied )
% of renters here:
66%State:
38%
Housing density: 8,856 houses/condos per square mile
Median price asked for vacant for-sale houses and condos in 2022: $2,363,500.
Median contract rent in 2022: over $2,000 (lower quartile is $1,653, upper quartile is over $2,000)
Median rent asked for vacant for-rent units in 2022: $3,733
Median gross rent in Cambridge, MA in 2022: over $2,000
Housing units in Cambridge with a mortgage: 9,290 (632 second mortgage, 0 home equity loan, 439 both second mortgage and home equity loan )Houses without a mortgage: 273
Median household income for houses/condos with a mortgage: $207,356
Median household income for apartments without a mortgage: $137,697
Median monthly housing costs: $2,314
Data:
Median house or condo value ($)
Median house or condo value ($ change since 2000)
Median house or condo value ($) - White
Median house or condo value ($) - Black or African American
Median house or condo value ($) - Asian
Median house or condo value ($) - Hispanic or Latino
Median house or condo value ($) - American Indian and Alaska Native
Median house or condo value ($) - Multirace
Median house or condo value ($) - Other Race
Median price asked for mobile homes ($)
Household density (households per square mile)
Mean house or condo value by units in structure - 1, detached ($)
Mean house or condo value by units in structure - 1, attached ($)
Mean house or condo value by units in structure - 2 ($)
Mean house or condo value by units in structure by units in structure - 3 or 4 ($)
Mean house or condo value by units in structure - 5 or more ($)
Mean house or condo value by units in structure - Boat, RV, van, etc. ($)
Mean house or condo value by units in structure - Mobile home ($)
Median contract rent ($)
Median contract rent - Lower quartile ($)
Median contract rent - Upper quartile ($)
Median gross rent ($)
Urban houses (%)
Rural houses (%)
Houses occupied (%)
Houses occupied (% change since 2000)
Houses owner occupied (%)
Houses owner occupied (% change since 2000)
Houses renter occupied (%)
Houses renter occupied (% change since 2000)
Vacant housing units - For rent (%)
Vacant housing units - For rent (% change since 2000)
Vacant housing units - For sale only (%)
Vacant housing units - For sale only (% change since 2000)
Vacant housing units - Rented or sold, not occupied (%)
Vacant housing units - Rented or sold, not occupied (% change since 2000)
Vacant housing units - For seasonal, recreational, or occasional use (%)
Vacant housing units - For seasonal, recreational, or occasional use (% change since 2000)
Vacant housing units - For migrant workers (%)
Vacant housing units - For migrant workers (% change since 2000)
Vacant housing units - Other vacant (%)
Vacant housing units - Other vacant (% change since 2000)
Median monthly housing costs ($)
Median household income for houses/condos with a mortgage ($)
Median household income for houses/condos without a mortgage ($)
Median household income ($)
Median household income ($) - White
Median household income ($) - Black or African American
Median household income ($) - Asian
Median household income ($) - Hispanic or Latino
Median household income ($) - American Indian and Alaska Native
Median household income ($) - Multirace
Median household income ($) - Other Race
Mortgage status - with mortgage (%)
Mortgage status - with second mortgage (%)
Mortgage status - with home equity loan (%)
Mortgage status - with both second mortgage and home equity loan (%)
Mortgage status - without a mortgage (%)
Median year house/condo built
Median year apartment built
Household type by relationship - Male householder living alone (%)
Household type by relationship - Male householder not living alone (%)
Household type by relationship - Female householder living alone (%)
Household type by relationship - Female householder not living alone (%)
Household type by relationship - Opposite-Sex spouse (%)
Household type by relationship - Same-Sex spouse (%)
Household type by relationship - Opposite-Sex unmarried partner (%)
Household type by relationship - Same-Sex unmarried partner (%)
Household type by relationship - In group quarters (%)
Size of family households - 2-person household (%)
Size of family households - 3-person household (%)
Size of family households - 4-person household (%)
Size of family households - 5-person household (%)
Size of family households - 6-person household (%)
Size of family households - 7-or-more-person household (%)
Size of nonfamily households - 1-person household (%)
Size of nonfamily households - 2-person household (%)
Size of nonfamily households - 3-person household (%)
Size of nonfamily households - 4-person household (%)
Size of nonfamily households - 5-person household (%)
Size of nonfamily households - 6-person household (%)
Size of nonfamily households - 7-or-moreperson household (%)
Year house built - Built 2010 or later (%)
Year house built - Built 2000 to 2009 (%)
Year house built - Built 1990 to 1999 (%)
Year house built - Built 1980 to 1989 (%)
Year house built - Built 1970 to 1979 (%)
Year house built - Built 1960 to 1969 (%)
Year house built - Built 1950 to 1959 (%)
Year house built - Built 1940 to 1949 (%)
Year house built - Built 1939 or earlier (%)
Median number of rooms in houses and condos
Median number of rooms in apartments
Median number of bedrooms in owner occupied houses
Mean number of bedrooms in owner occupied houses
Median number of bedrooms in renter occupied houses
Mean number of bedrooms in renter occupied houses
Median number of vehichles in owner occupied houses
Mean number of vehichles in owner occupied houses
Median number of vehichles in renter occupied houses
Mean number of vehichles in renter occupied houses
Rooms in owner-occupied houses - 1 room (%)
Rooms in owner-occupied houses - 2 rooms (%)
Rooms in owner-occupied houses - 3 rooms (%)
Rooms in owner-occupied houses - 4 rooms (%)
Rooms in owner-occupied houses - 5 rooms (%)
Rooms in owner-occupied houses - 6 rooms (%)
Rooms in owner-occupied houses - 7 rooms (%)
Rooms in owner-occupied houses - 8 rooms (%)
Rooms in owner-occupied houses - 9+ rooms (%)
Rooms in renter-occupied houses - 1 room (%)
Rooms in renter-occupied houses - 2 rooms (%)
Rooms in renter-occupied houses - 3 rooms (%)
Rooms in renter-occupied houses - 4 rooms (%)
Rooms in renter-occupied houses - 5 rooms (%)
Rooms in renter-occupied houses - 6 rooms (%)
Rooms in renter-occupied houses - 7 rooms (%)
Rooms in renter-occupied houses - 8 rooms (%)
Rooms in renter-occupied houses - 9+ rooms (%)
Bedrooms in owner-occupied houses - no bedrooms (%)
Bedrooms in owner-occupied houses - 1 bedroom (%)
Bedrooms in owner-occupied houses - 2 bedrooms (%)
Bedrooms in owner-occupied houses - 3 bedrooms (%)
Bedrooms in owner-occupied houses - 4 bedrooms (%)
Bedrooms in owner-occupied houses - 5+ bedrooms (%)
Bedrooms in renter-occupied houses - no bedrooms (%)
Bedrooms in renter-occupied houses - 1 bedroom (%)
Bedrooms in renter-occupied houses - 2 bedrooms (%)
Bedrooms in renter-occupied houses - 3 bedrooms (%)
Bedrooms in renter-occupied houses - 4 bedrooms (%)
Bedrooms in renter-occupied houses - 5+ bedrooms (%)
Vehicles available in owner-occupied houses - no vehicle available (%)
Vehicles available in owner-occupied houses - 1 vehicle available(%)
Vehicles available in owner-occupied houses - 2 Vehicles available (%)
Vehicles available in owner-occupied houses - 3 Vehicles available (%)
Vehicles available in owner-occupied houses - 4 Vehicles available (%)
Vehicles available in owner-occupied houses - 5+ Vehicles available (%)
Vehicles available in renter-occupied houses - no vehicle available (%)
Vehicles available in renter-occupied houses - 1 vehicle available (%)
Vehicles available in renter-occupied houses - 2 Vehicles available (%)
Vehicles available in renter-occupied houses - 3 Vehicles available (%)
Vehicles available in renter-occupied houses - 4 Vehicles available (%)
Vehicles available in renter-occupied houses - 5+ Vehicles available (%)
Housing units in structures - 1, detached (%)
Housing units in structures - 1, attached (%)
Housing units in structures - 2 (%)
Housing units in structures - 3 or 4 (%)
Housing units in structures - 5 to 9 (%)
Housing units in structures - 10 to 19 (%)
Housing units in structures - 20 to 49 (%)
Housing units in structures - 50 or more (%)
Housing units in structures - Mobile home (%)
Housing units in structures - Boat, RV, van, etc. (%)
Housing units in structures - Owners - 1, detached (%)
Housing units in structures - Owners - 1, attached (%)
Housing units in structures - Owners - 2 (%)
Housing units in structures - Owners - 3 or 4 (%)
Housing units in structures - Owners - 5 to 9 (%)
Housing units in structures - Owners - 10 to 19 (%)
Housing units in structures - Owners - 20 to 49 (%)
Housing units in structures - Owners - 50 or more (%)
Housing units in structures - Owners - Mobile home (%)
Housing units in structures - Owners - Boat, RV, van, etc. (%)
Housing units in structures - Renters - 1, detached (%)
Housing units in structures - Renters - 1, attached (%)
Housing units in structures - Renters - 2 (%)
Housing units in structures - Renters - 3 or 4 (%)
Housing units in structures - Renters - 5 to 9 (%)
Housing units in structures - Renters - 10 to 19 (%)
Housing units in structures - Renters - 20 to 49 (%)
Housing units in structures - Renters - 50 or more (%)
Housing units in structures - Renters - Mobile home (%)
Housing units in structures - Renters - Boat, RV, van, etc. (%)
House/condo owner moved in on average (years ago)
Renter moved in on average (years ago)
Year householder moved into unit - Moved in 1999 to March 2000 (%)
Year householder moved into unit - Moved in 1999 to March 2000 (%) - White
Year householder moved into unit - Moved in 1999 to March 2000 (%) - Black or African American
Year householder moved into unit - Moved in 1999 to March 2000 (%) - Asian
Year householder moved into unit - Moved in 1999 to March 2000 (%) - Hispanic or Latino
Year householder moved into unit - Moved in 1999 to March 2000 (%) - American Indian and Alaska Native
Year householder moved into unit - Moved in 1999 to March 2000 (%) - Multirace
Year householder moved into unit - Moved in 1999 to March 2000 (%) - Other Race
Year householder moved into unit - Moved in 1995 to 1998 (%)
Year householder moved into unit - Moved in 1995 to 1998 (%) - White
Year householder moved into unit - Moved in 1995 to 1998 (%) - Black or African American
Year householder moved into unit - Moved in 1995 to 1998 (%) - Asian
Year householder moved into unit - Moved in 1995 to 1998 (%) - Hispanic or Latino
Year householder moved into unit - Moved in 1995 to 1998 (%) - American Indian and Alaska Native
Year householder moved into unit - Moved in 1995 to 1998 (%) - Multirace
Year householder moved into unit - Moved in 1995 to 1998 (%) - Other Race
Year householder moved into unit - Moved in 1990 to 1994 (%)
Year householder moved into unit - Moved in 1990 to 1994 (%) - White
Year householder moved into unit - Moved in 1990 to 1994 (%) - Black or African American
Year householder moved into unit - Moved in 1990 to 1994 (%) - Asian
Year householder moved into unit - Moved in 1990 to 1994 (%) - Hispanic or Latino
Year householder moved into unit - Moved in 1990 to 1994 (%) - American Indian and Alaska Native
Year householder moved into unit - Moved in 1990 to 1994 (%) - Multirace
Year householder moved into unit - Moved in 1990 to 1994 (%) - Other Race
Year householder moved into unit - Moved in 1980 to 1989 (%)
Year householder moved into unit - Moved in 1980 to 1989 (%) - White
Year householder moved into unit - Moved in 1980 to 1989 (%) - Black or African American
Year householder moved into unit - Moved in 1980 to 1989 (%) - Asian
Year householder moved into unit - Moved in 1980 to 1989 (%) - Hispanic or Latino
Year householder moved into unit - Moved in 1980 to 1989 (%) - American Indian and Alaska Native
Year householder moved into unit - Moved in 1980 to 1989 (%) - Multirace
Year householder moved into unit - Moved in 1980 to 1989 (%) - Other Race
Year householder moved into unit - Moved in 1970 to 1979 (%)
Year householder moved into unit - Moved in 1970 to 1979 (%) - White
Year householder moved into unit - Moved in 1970 to 1979 (%) - Black or African American
Year householder moved into unit - Moved in 1970 to 1979 (%) - Asian
Year householder moved into unit - Moved in 1970 to 1979 (%) - Hispanic or Latino
Year householder moved into unit - Moved in 1970 to 1979 (%) - American Indian and Alaska Native
Year householder moved into unit - Moved in 1970 to 1979 (%) - Multirace
Year householder moved into unit - Moved in 1970 to 1979 (%) - Other Race
Year householder moved into unit - Moved in 1969 or earlier (%)
Year householder moved into unit - Moved in 1969 or earlier (%) - White
Year householder moved into unit - Moved in 1969 or earlier (%) - Black or African American
Year householder moved into unit - Moved in 1969 or earlier (%) - Asian
Year householder moved into unit - Moved in 1969 or earlier (%) - Hispanic or Latino
Year householder moved into unit - Moved in 1969 or earlier (%) - American Indian and Alaska Native
Year householder moved into unit - Moved in 1969 or earlier (%) - Multirace
Year householder moved into unit - Moved in 1969 or earlier (%) - Other Race
Housing units lacking complete plumbing facilities (%)
Housing units lacking complete kitchen facilities (%)
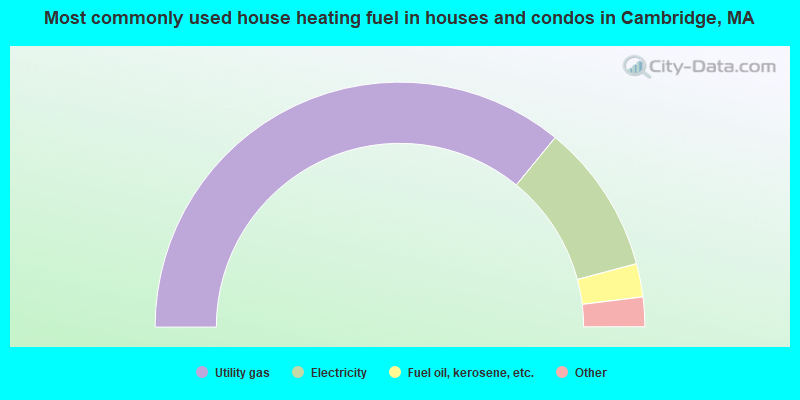
House heating fuel used in houses and condos - Utility gas (%)
House heating fuel used in houses and condos - Bottled, tank, or LP gas (%)
House heating fuel used in houses and condos - Electricity (%)
House heating fuel used in houses and condos - Fuel oil, kerosene, etc. (%)
House heating fuel used in houses and condos - Coal or coke (%)
House heating fuel used in houses and condos - Wood (%)
House heating fuel used in houses and condos - Solar energy (%)
House heating fuel used in houses and condos - Other fuel (%)
House heating fuel used in houses and condos - No fuel used (%)
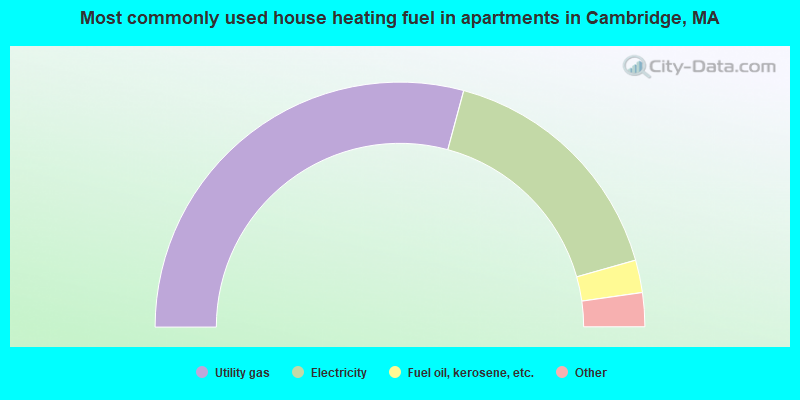
House heating fuel used in apartments - Utility gas (%)
House heating fuel used in apartments - Bottled, tank, or LP gas (%)
House heating fuel used in apartments - Electricity (%)
House heating fuel used in apartments - Fuel oil, kerosene, etc. (%)
House heating fuel used in apartments - Coal or coke (%)
House heating fuel used in apartments - Wood (%)
House heating fuel used in apartments - Solar energy (%)
House heating fuel used in apartments - Other fuel (%)
House heating fuel used in apartments - No fuel used (%)
Latest news about housing in Cambridge, MA collected exclusively by city-data.com from local newspapers, TV, and radio stations
Median year house/condo built: 1938Median year apartment built: 1968Household type by relationship:
Households: 118,489
Male householders: 24,358 (8,804 living alone ), Female householders: 26,503 (11,044 living alone )13,624 spouses (12,868 opposite-sex spouses ), 5,778 unmarried partners , (4,770 opposite-sex unmarried partners ), 16,176 children (15,850 natural , 134 adopted , 192 stepchildren ), 930 grandchildren , 1,189 brothers or sisters , 501 parents , 142 foster children , 1,087 other relatives , 11,154 non-relatives In group quarters: 17,047
Size of family households: 8,428 2-persons , 5,225 3-persons , 3,342 4-persons , 721 5-persons , 604 6-persons , 129 7-or-more-persons .
Size of nonfamily households: 19,848 1-person , 9,166 2-persons , 2,153 3-persons , 1,002 4-persons , 243 5-persons .
9,267 married couples with children. single-parent households (622 men , 2,682 women ).
63.9% of residents of Cambridge speak English at home. of residents speak Spanish at home (77% speak English very well , 16% speak English well , 6% speak English not well , 2% don't speak English at all ).of residents speak other Indo-European language at home (79% speak English very well , 15% speak English well , 4% speak English not well , 2% don't speak English at all ).of residents speak Asian or Pacific Island language at home (76% speak English very well , 19% speak English well , 4% speak English not well , 1% don't speak English at all ).of residents speak other language at home (59% speak English very well , 35% speak English well , 5% speak English not well , 1% don't speak English at all ).
Foreign born population: 34,183 (28.8%)of them are naturalized citizens )
Median number of rooms in houses and condos:
Median number of rooms in apartments
Owner-occupied Renter-occupied
Bedrooms in owner-occupied houses and condos in Cambridge, Massachusetts
541 no bedroom 1,944 1 bedroom 6,603 2 bedrooms 3,873 3 bedrooms 2,668 4 bedrooms 1,481 5+ bedrooms
Bedrooms in renter-occupied apartments in Cambridge, Massachusetts
4,002 no bedroom 9,953 1 bedroom 13,297 2 bedrooms 4,575 3 bedrooms 1,549 4 bedrooms 375 5+ bedrooms
Owner-occupied Renter-occupied
Rooms in owner-occupied houses in Cambridge, Massachusetts
492 1 room 381 2 rooms 1,280 3 rooms 2,453 4 rooms 3,331 5 rooms 3,607 6 rooms 1,342 7 rooms 1,363 8 rooms 2,861 9+ rooms
Rooms in renter-occupied apartments in Cambridge, Massachusetts
2,772 1 room 5,325 2 rooms 8,577 3 rooms 7,613 4 rooms 4,257 5 rooms 3,135 6 rooms 857 7 rooms 492 8 rooms 723 9+ rooms
Cambridge, MA household income distribution 3,171 Less than $10,0004,209 $10,000 to $19,9992,038 $20,000 to $29,9991,848 $30,000 to $39,9992,124 $40,000 to $49,9992,071 $50,000 to $59,9993,512 $60,000 to $74,9994,899 $75,000 to $99,9993,946 $100,000 to $124,9993,814 $125,000 to $149,9995,889 $150,000 to $199,99913,340 $200,000 or more
Home value of owner - occupied houses in 2022 in Cambridge, MA 91 Less than $10,00024 $10,000 to $14,99914 $40,000 to $49,99949 $50,000 to $59,99911 $60,000 to $69,99915 $70,000 to $79,9998 $90,000 to $99,99962 $100,000 to $124,9995 $125,000 to $149,999118 $150,000 to $174,99952 $175,000 to $199,999211 $200,000 to $249,99940 $250,000 to $299,999375 $300,000 to $399,999287 $400,000 to $499,9992,974 $500,000 to $749,9994,517 $750,000 to $999,9994,359 $1,000,000 to $1,499,9991,689 $1,500,000 to $1,999,9993,419 $2,000,000 or moreRent paid by renters in 2022 in Cambridge, MA 192 Less than $100181 $100 to $149168 $150 to $199131 $200 to $249902 $250 to $299625 $300 to $349629 $350 to $39935 $400 to $449207 $450 to $49930 $500 to $549173 $550 to $599377 $600 to $649174 $650 to $699323 $750 to $799203 $800 to $899418 $900 to $999702 $1,000 to $1,2491,190 $1,250 to $1,4995,251 $1,500 to $1,9996,991 $2,000 to $2,4996,003 $2,500 to $2,9993,582 $3,000 to $3,4994,565 $3,500 or more699 No cash rent
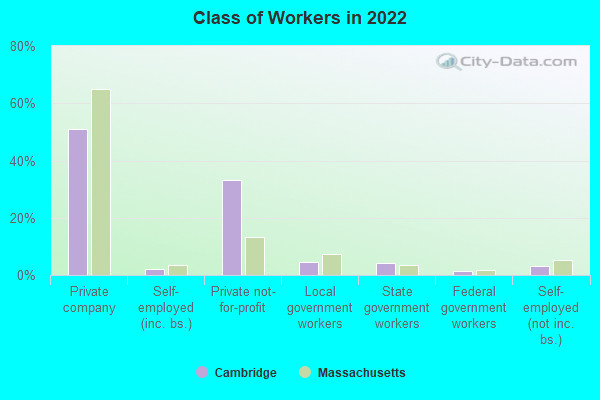
Percentage of workers working in this county: 74.7%Number of people working at home: 21,085 (30.1% of all workers )
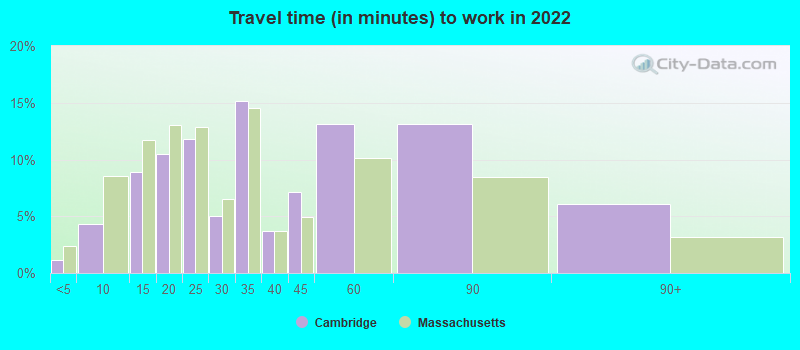
Travel time to work (commute)
Less than 5 minutes: 6715 to 9 minutes: 3,04110 to 14 minutes: 7,10015 to 19 minutes: 8,17720 to 24 minutes: 7,22325 to 29 minutes: 4,35530 to 34 minutes: 8,30735 to 39 minutes: 2,34040 to 44 minutes: 2,31345 to 59 minutes: 3,48660 to 89 minutes: 1,56890 or more minutes: 296
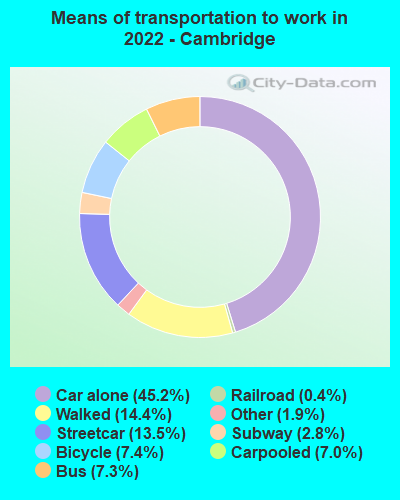
Means of transportation to work:
Drove a car alone: 47,649 (37.7%)Carpooled: 7,415 (5.9%)Bus : 7,721 (6.1%)Subway or elevated rail : 14,201 (11.2%)Long-distance train or commuter rail : 2,969 (2.3%)Light rail, streetcar or trolley : 416 (0.3%)Ferryboat: 90 (0.1%)Taxi: 2,042 (1.6%)Bicycle: 7,778 (6.1%)Walked: 15,185 (12.0%)Worked at home: 21,085 (16.7%)
Unemployment by race in 2022
Unemployment rate for White non-Hispanic residents 1.8% Males1.4% FemalesUnemployment rate for Black residents 4.1% Males6.0% FemalesUnemployment rate for American Indian and Alaska Native residents 28.8% FemalesUnemployment rate for Asian residents 0.4% Males2.9% FemalesUnemployment rate for other race residents 7.3% Males3.2% FemalesUnemployment rate for two or more race residents 3.0% Males2.0% FemalesUnemployment rate for Hispanic or Latino residents 7.3% Males2.1% Females
Year of entry for the foreign-born population in Cambridge, Massachusetts
20,043 2010 or later 6,581 2000 to 2009 4,774 1990 to 1999 5,917 1980 to 1989 2,924 1970 to 1979 2,450 Before 1970
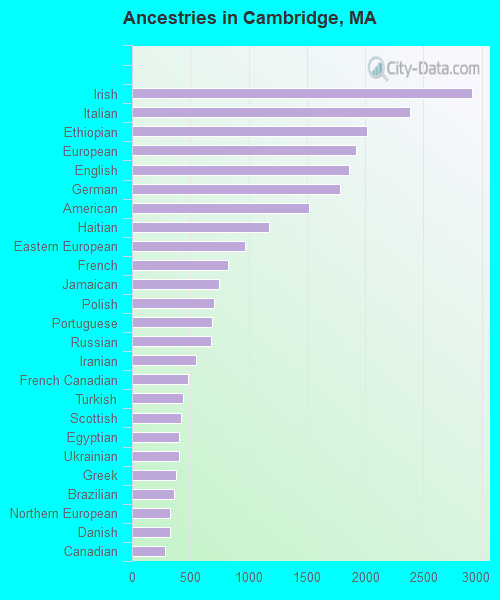
First ancestries reported:
Irish: 2,917 (4.9%)
Italian: 2,385 (4.0%)
Ethiopian: 2,014 (3.4%)
European: 1,920 (3.3%)
English: 1,859 (3.2%)
German: 1,783 (3.0%)
American: 1,516 (2.6%)
Haitian: 1,173 (2.0%)
Eastern European: 968 (1.6%)
French: 826 (1.4%)
Jamaican: 744 (1.3%)
Polish: 702 (1.2%)
Portuguese: 683 (1.2%)
Russian: 680 (1.2%)
Iranian: 549 (0.9%)
French Canadian: 477 (0.8%)
Turkish: 438 (0.7%)
Scottish: 422 (0.7%)
Egyptian: 405 (0.7%)
Ukrainian: 402 (0.7%)
Greek: 379 (0.6%)
Brazilian: 362 (0.6%)
Northern European: 322 (0.5%)
Danish: 322 (0.5%)
Canadian: 280 (0.5%)
Dutch: 257 (0.4%)
British: 249 (0.4%)
Swedish: 247 (0.4%)
Armenian: 236 (0.4%)
Nigerian: 234 (0.4%)
Bulgarian: 226 (0.4%)
Lebanese: 225 (0.4%)
Cape Verdean: 216 (0.4%)
Moroccan: 202 (0.3%)
Albanian: 191 (0.3%)
West Indian: 173 (0.3%)
African: 165 (0.3%)
Austrian: 150 (0.3%)
Israeli: 149 (0.3%)
Romanian: 140 (0.2%)
Finnish: 139 (0.2%)
Czech: 130 (0.2%)
Swiss: 129 (0.2%)
Norwegian: 126 (0.2%)
Serbian: 104 (0.2%)
Lithuanian: 88 (0.1%)
Scotch-Irish: 80 (0.1%)
Arab: 79 (0.1%)
Trinidadian and Tobagonian: 77 (0.1%)
Zimbabwean: 73 (0.1%)
Iraqi: 67 (0.1%)
Kenyan: 66 (0.1%)
Latvian: 66 (0.1%)
South African: 65 (0.1%)
Syrian: 65 (0.1%)
Barbadian: 59 (0.1%)
Ugandan: 56 (0.09%)
Belgian: 44 (0.07%)
Macedonian: 44 (0.07%)
Afghan: 43 (0.07%)
Scandinavian: 42 (0.07%)
Hungarian: 40 (0.07%)
Cypriot: 39 (0.07%)
Guyanese: 35 (0.06%)
Palestinian: 34 (0.06%)
Basque: 33 (0.06%)
Welsh: 32 (0.05%)
New Zealander: 32 (0.05%)
Jordanian: 26 (0.04%)
Slovene: 23 (0.04%)
Australian: 22 (0.04%)
Yugoslavian: 22 (0.04%)
Slovak: 19 (0.03%)
Icelander: 15 (0.03%)
Czechoslovakian: 12 (0.02%)
Assyrian: 11 (0.02%)
Celtic: 8 (0.01%)
Somali: 7 (0.01%)
U.S. Virgin Islander: 7 (0.01%)
British West Indian: 6 (0.01%)
Croatian: 5 (0.01%)
Sierra Leonean: 5 (0.01%)
Most common places of birth for foreign-born residents (%): China, excluding Hong Kong and Taiwan Cambridge:
13.5% (4,841)Massachusetts:
8.4% (103,233)
India Cambridge:
9.0% (3,232)Massachusetts:
6.8% (82,934)
Korea Cambridge:
5.1% (1,816)Massachusetts:
1.4% (17,613)
Ethiopia Cambridge:
4.2% (1,492)Massachusetts:
0.4% (5,467)
Japan Cambridge:
3.8% (1,371)Massachusetts:
0.6% (7,301)
Haiti Cambridge:
3.6% (1,287)Massachusetts:
4.9% (60,432)
Brazil Cambridge:
3.0% (1,085)Massachusetts:
7.6% (92,959)
France Cambridge:
2.9% (1,055)Massachusetts:
0.6% (7,364)
Canada Cambridge:
2.3% (843)Massachusetts:
2.3% (28,158)
Germany Cambridge:
2.2% (789)Massachusetts:
1.0% (12,529)
Taiwan Cambridge:
2.0% (703)Massachusetts:
0.7% (8,270)
Eritrea Cambridge:
2.0% (702)Massachusetts:
0.1% (743)
Jamaica Cambridge:
1.8% (643)Massachusetts:
1.7% (21,468)
Italy Cambridge:
1.7% (594)Massachusetts:
1.4% (16,886)
Iran Cambridge:
1.6% (585)Massachusetts:
0.6% (7,213)
Israel Cambridge:
1.6% (577)Massachusetts:
0.5% (6,073)
Turkey Cambridge:
1.5% (555)Massachusetts:
0.4% (5,208)
Place of birth for U.S.-born residents:
This state: 37,054Other state: 43,874Northeast: 18,391Midwest: 6,765South: 11,053West: 7,665 70.8% of Cambridge residents lived in the same house 1 years ago.
Out of people who lived in different houses, 30.8% lived in this county.
Out of people who lived in different counties, 36.2% lived in Massachusetts.
Cambridge:
70.8%State average:
87.7%
Education attainment for males 25 years and older:
No schooling: 294Nursery to 4th grade: 1815th and 6th grade: 07th and 8th grade: 09th grade: 4410th grade: 011th grade: 14512th grade, no diploma: 522High school graduate (or equivalency): 2,749Less than 1 year of college: 508Some college more than 1 year, no degree: 821Associate degree: 376Bachelor's degree: 14,490Master's degree: 9,325Professional school degree: 2,177Doctorate degree: 6,926
Education attainment for females 25 years and older:
No schooling: 483Nursery to 4th grade: 05th and 6th grade: 887th and 8th grade: 1199th grade: 11810th grade: 16411th grade: 15512th grade, no diploma: 509High school graduate (or equivalency): 3,259Less than 1 year of college: 942Some college more than 1 year, no degree: 1,569Associate degree: 1,588Bachelor's degree: 11,914Master's degree: 10,664Professional school degree: 2,498Doctorate degree: 4,721
Housing units in structures:
One, detached: 5,126One, attached: 3,207Two: 7,4103 or 4: 10,4235 to 9: 6,49510 to 19: 4,73420 to 49: 6,23350 or more: 13,306Housing units lacking complete plumbing facilities in 2022: 0.2%Housing units lacking complete kitchen facilities in 2022: 0.9%House/condo owner moved in on average 12 years ago
Renter moved in on average 0 years ago
Private vs. public school enrollment:
Students in private schools in grades 1 to 8 (elementary and middle school): 429 Here:
7.9%Massachusetts:
10.3%
Students in private schools in grades 9 to 12 (high school): 466 Here:
14.8%Massachusetts:
12.3%
Students in private undergraduate colleges: 15,096 Here:
85.0%Massachusetts:
51.2%