Jump to a detailed profile or search site with Google Custom Search

Campbell, CA (California) Houses and Residents

Estimated median house or condo value in 2022: $1,651,310 (it was $422,100 in 2000)
Campbell:

$1,651,310
California:

$715,900
Lower value quartile - upper value quartile: $1,107,413 - $1,884,800

Mean price in 2022:

Detached houses: $1,869,532
Here:

$1,869,532
State:

$988,808

Townhouses or other attached units: $1,199,861
Here:

$1,199,861
State:

$838,546

In 2-unit structures: $523,753
Here:

$523,753
State:

$1,138,100

In 3-to-4-unit structures: $551,497
Here:

$551,497
State:

$824,253

In 5-or-more-unit structures: $693,970
Here:

$693,970
State:

$730,996

Mobile homes: $318,420
Here:

$318,420
State:

$184,506

Total population: 41,119 (Urban population: 38,187, Rural population: 0)

Houses: 18,573 (17,280 occupied: 8,885 owner occupied, 8,338 renter occupied)

% of renters here:

48%
State:

44%

Housing density: 3,313 houses/condos per square mile

Median price asked for vacant for-sale houses and condos in 2022: $2,259,590.

Median contract rent in 2022: over $2,000 (lower quartile is $1,923, upper quartile is over $2,000)


Median rent asked for vacant for-rent units in 2022: $3,727


Median gross rent in Campbell, CA in 2022: over $2,000

Housing units in Campbell with a mortgage: 5,747 (916 second mortgage, 9 home equity loan, 769 both second mortgage and home equity loan)
Houses without a mortgage: 28

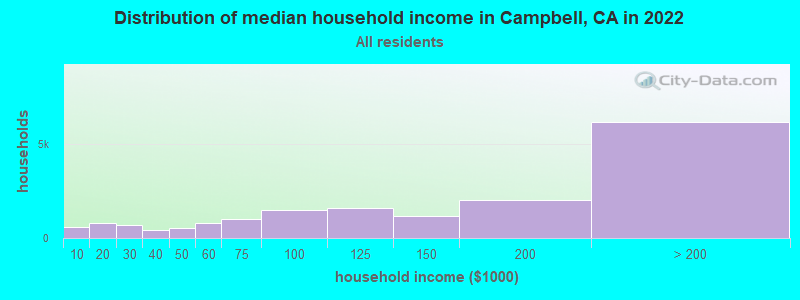
Median household income for houses/condos with a mortgage: $231,659

Median household income for apartments without a mortgage: $128,425

Median monthly housing costs: $2,673

Compare current foreclosures near Campbell, CA:

Check out more offers near Campbell, CA.
Powered by Foreclosure.com

Settings
X
Data:
Loading data...
Based on 2000-2022 data
Loading data...

123
Hide US histogram

Latest news about housing in Campbell, CA collected exclusively by city-data.com from local newspapers, TV, and radio stations

Campbell, California Age and Sex of Residents
Median year house/condo built: 1967

Median year apartment built: 1976

Household type by relationship:

Households: 42,423
  • Male householders: 8,937 (2,063 living alone), Female householders: 7,717 (2,532 living alone)
  • 8,465 spouses (8,375 opposite-sex spouses), 1,086 unmarried partners, (1,002 opposite-sex unmarried partners), 11,961 children (11,323 natural, 382 adopted, 255 stepchildren), 350 grandchildren, 474 brothers or sisters, 918 parents, 0 foster children, 758 other relatives, 1,363 non-relatives
  • In group quarters: 389

Size of family households: 4,569 2-persons, 2,692 3-persons, 2,777 4-persons, 773 5-persons, 173 6-persons, 41 7-or-more-persons.

Size of nonfamily households: 5,061 1-person, 1,087 2-persons, 152 3-persons, 37 4-persons, 19 5-persons.

6,661 married couples with children.
1,842 single-parent households (586 men, 1,256 women).

61.0% of residents of Campbell speak English at home.
9.7% of residents speak Spanish at home (65% speak English very well, 21% speak English well, 11% speak English not well, 3% don't speak English at all).
12.1% of residents speak other Indo-European language at home (77% speak English very well, 14% speak English well, 9% speak English not well).
15.4% of residents speak Asian or Pacific Island language at home (57% speak English very well, 24% speak English well, 9% speak English not well, 11% don't speak English at all).
1.2% of residents speak other language at home (77% speak English very well, 23% speak English well).

Foreign born population: 13,533 (31.9%)
(54.0% of them are naturalized citizens)

Median number of rooms in houses and condos:
Here:

5.8
State:

6.0

Median number of rooms in apartments
Here:

3.7
State:

3.9

Owner-occupied Renter-occupied
Bedrooms in owner-occupied houses and condos in Campbell, California
  • Bedrooms in owner-occupied houses and condos in Campbell, California
  • 10no bedroom
  • 2091 bedroom
  • 1,6552 bedrooms
  • 3,9923 bedrooms
  • 2,4954 bedrooms
  • 5245+ bedrooms
Bedrooms in renter-occupied apartments in Campbell, California
  • Bedrooms in renter-occupied apartments in Campbell, California
  • 682no bedroom
  • 2,4741 bedroom
  • 3,0512 bedrooms
  • 1,8133 bedrooms
  • 2724 bedrooms
  • 465+ bedrooms
Owner-occupied Renter-occupied
Cars and other vehicles available in Campbell in owner-occupied houses/condos
  • Cars and other vehicles available in Campbell in owner-occupied houses/condos
  • 192no vehicle
  • 2,0231 vehicle
  • 4,1132 vehicles
  • 1,7063 vehicles
  • 6404 vehicles
  • 2125+ vehicles
Cars and other vehicles available in Campbell in renter-occupied apartments
  • Cars and other vehicles available in Campbell in renter-occupied apartments
  • 778no vehicle
  • 3,2441 vehicle
  • 3,2072 vehicles
  • 7653 vehicles
  • 2694 vehicles
  • 765+ vehicles
Owner-occupied Renter-occupied
Rooms in owner-occupied houses in Campbell, California
  • Rooms in owner-occupied houses in Campbell, California
  • 101 room
  • 392 rooms
  • 3813 rooms
  • 1,5194 rooms
  • 1,8445 rooms
  • 1,8776 rooms
  • 1,6807 rooms
  • 8688 rooms
  • 6689+ rooms
Rooms in renter-occupied apartments in Campbell, California
  • Rooms in renter-occupied apartments in Campbell, California
  • 6681 room
  • 9412 rooms
  • 1,8593 rooms
  • 2,3334 rooms
  • 1,2025 rooms
  • 8916 rooms
  • 2797 rooms
  • 888 rooms
  • 789+ rooms
Year house built
Median 2022 house/condo value by year built
Median house/condo value by year householder moved into unit
Breakdown of mean house values by ages of householders
Owners and renters by unit type in Campbell, CA
  • Campbell, CA household income distribution

  • Distribution of median household income in Campbell, CA in 2022
  • 608Less than $10,000
  • 807$10,000 to $19,999
  • 669$20,000 to $29,999
  • 419$30,000 to $39,999
  • 529$40,000 to $49,999
  • 778$50,000 to $59,999
  • 1,025$60,000 to $74,999
  • 1,486$75,000 to $99,999
  • 1,622$100,000 to $124,999
  • 1,155$125,000 to $149,999
  • 2,017$150,000 to $199,999
  • 6,183$200,000 or more
  • Home value of owner - occupied houses in 2022 in Campbell, CA

  • Distribution of house value in Campbell, CA in 2022
  • 115Less than $10,000
  • 8$40,000 to $49,999
  • 12$80,000 to $89,999
  • 7$90,000 to $99,999
  • 79$100,000 to $124,999
  • 49$125,000 to $149,999
  • 26$200,000 to $249,999
  • 66$300,000 to $399,999
  • 85$400,000 to $499,999
  • 550$500,000 to $749,999
  • 657$750,000 to $999,999
  • 2,220$1,000,000 to $1,499,999
  • 2,690$1,500,000 to $1,999,999
  • 2,148$2,000,000 or more
  • Rent paid by renters in 2022 in Campbell, CA

  • Distribution of rent paid by renters in Campbell, CA in 2022
  • 62Less than $100
  • 74$250 to $299
  • 89$300 to $349
  • 171$350 to $399
  • 7$400 to $449
  • 15$450 to $499
  • 97$500 to $549
  • 125$550 to $599
  • 5$650 to $699
  • 9$800 to $899
  • 55$900 to $999
  • 136$1,000 to $1,249
  • 152$1,250 to $1,499
  • 1,265$1,500 to $1,999
  • 2,098$2,000 to $2,499
  • 1,631$2,500 to $2,999
  • 1,061$3,000 to $3,499
  • 1,312$3,500 or more
  • 128No cash rent
Time Leaving Home To Go To Work in 2022

Percentage of workers working in this county: 90.7%
Number of people working at home: 5,571 (24.3% of all workers)

Travel time (in minutes) to work in 2022

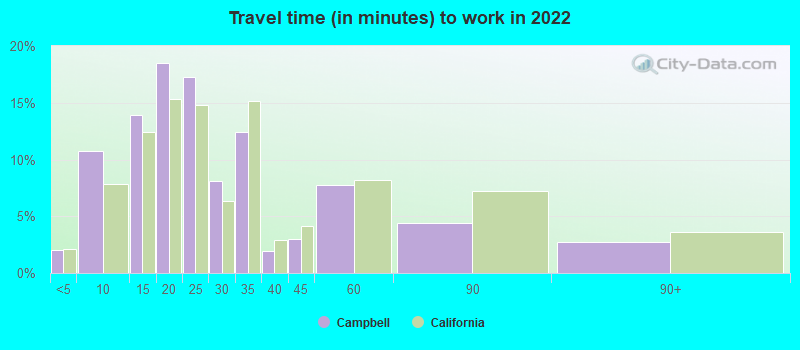
Travel time to work (commute)

  • Less than 5 minutes: 373
  • 5 to 9 minutes: 1,474
  • 10 to 14 minutes: 2,717
  • 15 to 19 minutes: 2,763
  • 20 to 24 minutes: 3,362
  • 25 to 29 minutes: 1,102
  • 30 to 34 minutes: 2,807
  • 35 to 39 minutes: 436
  • 40 to 44 minutes: 678
  • 45 to 59 minutes: 951
  • 60 to 89 minutes: 701
  • 90 or more minutes: 169
Means of transportation to work in 2022 - Campbell

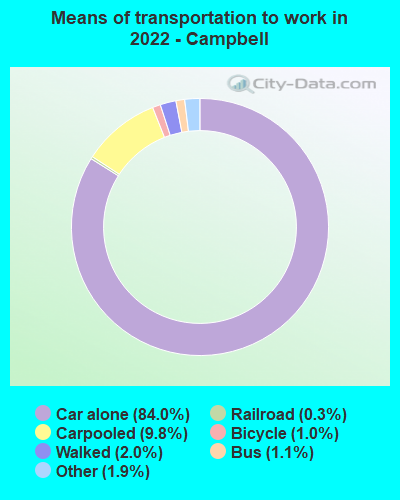
Means of transportation to work:

  • Drove a car alone: 15,483 (64.9%)
  • Carpooled: 1,849 (7.8%)
  • Bus: 140 (0.6%)
  • Long-distance train or commuter rail: 6 (0.0%)
  • Light rail, streetcar or trolley: 33 (0.1%)
  • Taxi: 384 (1.6%)
  • Bicycle: 198 (0.8%)
  • Walked: 377 (1.6%)
  • Worked at home: 5,571 (23.4%)
Class of Workers in 2022
  • Unemployment by race in 2022
  • Unemployment rate for White non-Hispanic residents
  • 6.1%Males
  • 3.4%Females
  • Unemployment rate for Black residents
  • 1.6%Females
  • Unemployment rate for American Indian and Alaska Native residents
  • 13.2%Males
  • Unemployment rate for Asian residents
  • 2.2%Males
  • 1.3%Females
  • Unemployment rate for other race residents
  • 3.2%Females
  • Unemployment rate for two or more race residents
  • 2.1%Males
  • 5.7%Females
  • Unemployment rate for Hispanic or Latino residents
  • 0.8%Males
  • 3.6%Females
Year of entry for the foreign-born population in Campbell, California
  • Year of entry for the foreign-born population in Campbell, California
  • 4,8292010 or later
  • 2,6152000 to 2009
  • 2,8901990 to 1999
  • 2,0381980 to 1989
  • 1,2401970 to 1979
  • 922Before 1970
Ancestries in Campbell, CA

First ancestries reported:

  • European: 1,431 (5.5%)
  • German: 1,031 (4.0%)
  • Irish: 991 (3.8%)
  • Iranian: 918 (3.5%)
  • American: 708 (2.7%)
  • Italian: 675 (2.6%)
  • Brazilian: 480 (1.8%)
  • Russian: 371 (1.4%)
  • English: 312 (1.2%)
  • Armenian: 206 (0.8%)
  • Polish: 171 (0.7%)
  • Scottish: 165 (0.6%)
  • Eastern European: 144 (0.6%)
  • French: 141 (0.5%)
  • Yugoslavian: 118 (0.5%)
  • Ethiopian: 111 (0.4%)
  • Scotch-Irish: 102 (0.4%)
  • Swedish: 98 (0.4%)
  • Palestinian: 89 (0.3%)
  • Northern European: 86 (0.3%)
  • Greek: 82 (0.3%)
  • British: 70 (0.3%)
  • Norwegian: 57 (0.2%)
  • Romanian: 57 (0.2%)
  • Australian: 53 (0.2%)
  • Assyrian: 52 (0.2%)
  • Syrian: 51 (0.2%)
  • Bulgarian: 46 (0.2%)
  • African: 46 (0.2%)
  • Portuguese: 45 (0.2%)
  • Hungarian: 44 (0.2%)
  • Moroccan: 39 (0.1%)
  • Canadian: 39 (0.1%)
  • Dutch: 36 (0.1%)
  • Celtic: 31 (0.1%)
  • Ukrainian: 26 (0.10%)
  • Austrian: 24 (0.09%)
  • Turkish: 22 (0.08%)
  • Danish: 19 (0.07%)
  • Arab: 17 (0.07%)
  • Lebanese: 17 (0.07%)
  • French Canadian: 16 (0.06%)
  • Scandinavian: 15 (0.06%)
  • Ugandan: 15 (0.06%)
  • Lithuanian: 14 (0.05%)
  • Maltese: 11 (0.04%)
  • Croatian: 11 (0.04%)
  • Latvian: 11 (0.04%)
  • Israeli: 11 (0.04%)
  • Czech: 5 (0.02%)
  • Belgian: 4 (0.02%)

Most common places of birth for foreign-born residents (%):

China, excluding Hong Kong and Taiwan
Campbell:

15.7% (2,130)
California:

6.6% (684,672)

India
Campbell:

15.3% (2,066)
California:

5.2% (539,184)

Mexico
Campbell:

10.2% (1,376)
California:

37.2% (3,881,193)

Iran
Campbell:

5.5% (751)
California:

2.0% (206,004)

Philippines
Campbell:

5.5% (749)
California:

7.8% (818,297)

Korea
Campbell:

5.1% (689)
California:

3.0% (315,248)

Taiwan
Campbell:

3.8% (513)
California:

1.7% (176,274)

Brazil
Campbell:

3.0% (410)
California:

0.5% (53,222)

Russia
Campbell:

3.0% (410)
California:

0.7% (71,932)

Vietnam
Campbell:

2.8% (379)
California:

4.9% (512,335)

Canada
Campbell:

2.5% (338)
California:

1.2% (127,477)

Colombia
Campbell:

2.4% (325)
California:

0.5% (55,249)

Hong Kong
Campbell:

2.2% (301)
California:

1.0% (105,215)

Germany
Campbell:

2.0% (267)
California:

0.7% (73,304)

Japan
Campbell:

1.7% (232)
California:

1.0% (103,575)

Place of birth for U.S.-born residents:

  • This state: 21,456
  • Other state: 6,788
  • Northeast: 1,520
  • Midwest: 1,908
  • South: 1,492
  • West: 1,803

82.3% of Campbell residents lived in the same house 1 years ago.
   Out of people who lived in different houses, 39.7% lived in this county.
   Out of people who lived in different counties, 56.0% lived in California.


Campbell:

82.3%
State average:

88.9%

Education attainment for males 25 years and older:

  • No schooling: 324
  • Nursery to 4th grade: 26
  • 5th and 6th grade: 153
  • 7th and 8th grade: 17
  • 9th grade: 20
  • 10th grade: 29
  • 11th grade: 89
  • 12th grade, no diploma: 249
  • High school graduate (or equivalency): 1,808
  • Less than 1 year of college: 528
  • Some college more than 1 year, no degree: 1,439
  • Associate degree: 857
  • Bachelor's degree: 5,791
  • Master's degree: 2,951
  • Professional school degree: 416
  • Doctorate degree: 718
Educational Attainment for Males

Education attainment for females 25 years and older:

  • No schooling: 367
  • Nursery to 4th grade: 61
  • 5th and 6th grade: 253
  • 7th and 8th grade: 59
  • 9th grade: 76
  • 10th grade: 6
  • 11th grade: 59
  • 12th grade, no diploma: 274
  • High school graduate (or equivalency): 1,800
  • Less than 1 year of college: 678
  • Some college more than 1 year, no degree: 1,609
  • Associate degree: 1,369
  • Bachelor's degree: 5,257
  • Master's degree: 3,048
  • Professional school degree: 320
  • Doctorate degree: 554
Educational Attainment for Females
Campbell marital status for males
Campbell marital status for females

Housing units in structures:

  • One, detached: 8,327
  • One, attached: 2,425
  • Two: 226
  • 3 or 4: 2,182
  • 5 to 9: 641
  • 10 to 19: 1,158
  • 20 to 49: 1,205
  • 50 or more: 2,238
  • Mobile homes: 169

Median worth of mobile homes: $471,843

Housing units lacking complete plumbing facilities in 2022: 1.2%

Housing units lacking complete kitchen facilities in 2022: 1.8%

House/condo owner moved in on average 13 years ago

Renter moved in on average 4 years ago

Year householders moved into residence in Campbell
Houses and condos Apartments
Most commonly used house heating fuel in houses and condos in Campbell, CA
  • 76.5%Utility gas
  • 20.8%Electricity
  • 1.0%Bottled, tank, or LP gas
  • 0.7%Solar energy
  • 0.4%Wood
  • 0.4%Other fuel
  • 0.2%No fuel used
Most commonly used house heating fuel in apartments in Campbell, CA
  • 50.4%Electricity
  • 46.7%Utility gas
  • 1.9%No fuel used
  • 0.8%Bottled, tank, or LP gas

Private vs. public school enrollment:

Students in private schools in grades 1 to 8 (elementary and middle school): 663
Here:

17.1%
California:

10.5%

Students in private schools in grades 9 to 12 (high school): 375
Here:

18.0%
California:

8.5%

Students in private undergraduate colleges: 154
Here:

8.7%
California:

15.9%
School Enrollment by Level of School for Male Students
School Enrollment by Level of School for Female Students
Age and Sex of Sensory-Disabled Noninstitutionalized Residents
Age and Sex of Physically-Disabled Noninstitutionalized Residents
Age and Sex of Mentally-Disabled Noninstitutionalized Residents
Age and Sex of Self-Care Disabled Noninstitutionalized Residents
Age and Sex of Go-Outside-Home Disabled Noninstitutionalized Residents
Age and Sex of Noninstitutionalized Residents with Employment Disability