Canyon Lake, CA (California) Houses and Residents
| Canyon Lake: | $721,096 |
| California: | $715,900 |
Total population: 11,010 (Urban population: 9,963, Rural population: 254 (all nonfarm))
Houses: 4,583 (4,212 occupied: 3,325 owner occupied, 915 renter occupied)
| % of renters here: | 22% |
| State: | 44% |
Housing density: 1,145 houses/condos per square mile
Median price asked for vacant for-sale houses and condos in 2022: $797,158.
Median contract rent in 2022: over $2,000 (lower quartile is $1,589, upper quartile is over $2,000)
Median rent asked for vacant for-rent units in 2022: $4,861
Median gross rent in Canyon Lake, CA in 2022: over $2,000
Housing units in Canyon Lake with a mortgage: 2,256 (178 second mortgage, 7 home equity loan, 125 both second mortgage and home equity loan)
Houses without a mortgage: 12
Median household income for houses/condos with a mortgage: $148,599
Median household income for apartments without a mortgage: $82,233
Median monthly housing costs: $2,336
Compare current foreclosures near Canyon Lake, CA:
| Photo | Address | Area | Beds / Baths | Price | Details |
|---|---|---|---|---|---|

|
#1
Vellanto Way
Moreno Valley, CA 92553
|
1,316 sq. feet
|
2 baths 3 beds |
$480,000
|
show details |

|
#2
Camino Cristal
Menifee, CA 92584
|
2,337 sq. feet
|
2 baths 5 beds |
$419,900
|
show details |

|
#3
Quail Creek Lane
Wildomar, CA 92595
|
1,891 sq. feet
|
2 baths 3 beds |
$675,000
|
show details |

|
#4
Ryan Ave
Lake Elsinore, CA 92530
|
- sq. feet
|
2 baths 2 beds |
$509,900
|
show details |

|
#5
Periwinkle Way
Lake Elsinore, CA 92532
|
2,858 sq. feet
|
3 baths 5 beds |
show details | |

|
#6
Lyndie Ln Unit 2
Temecula, CA 92591
|
1,004 sq. feet
|
2 baths 2 beds |
show details | |

|
#7
La Costa Alta Dr
Moreno Valley, CA 92555
|
2,671 sq. feet
|
3 baths 8 beds |
show details | |

|
#8
Cirrus Cir
Corona, CA 92883
|
3,543 sq. feet
|
2 baths 5 beds |
show details | |

|
#9
Chervil Way
Lake Elsinore, CA 92532
|
2,533 sq. feet
|
3 baths 4 beds |
show details | |

|
#10
E Acacia Ave
Hemet, CA 92543
|
988 sq. feet
|
1 baths 4 beds |
show details |
| Photo | Address | Area | Beds / Baths | Price | Details |
|---|---|---|---|---|---|

|
#11
Bonica St
Lake Elsinore, CA 92532
|
2,867 sq. feet
|
3 baths 4 beds |
show details | |

|
#12
Calle Arrebol
Murrieta, CA 92563
|
1,810 sq. feet
|
2 baths 2 beds |
show details | |

|
#13
Brentwood Way
Hemet, CA 92545
|
2,040 sq. feet
|
3 baths 3 beds |
show details | |

|
#14
Eleanor Ln
Moreno Valley, CA 92551
|
1,123 sq. feet
|
2 baths 3 beds |
show details | |

|
#15
La Costa Alta Dr
Moreno Valley, CA 92555
|
4,817 sq. feet
|
4 baths 6 beds |
show details | |

|
#16
Portsmouth Dr
Sun City, CA 92586
|
2,420 sq. feet
|
2 baths 4 beds |
show details | |

|
#17
Sweet Magnolia Way
Murrieta, CA 92563
|
3,732 sq. feet
|
4 baths 4 beds |
show details | |

|
#18
Bradley Rd
Sun City, CA 92586
|
1,066 sq. feet
|
2 baths 2 beds |
show details | |

|
#19
Canyon Estates Dr
Lake Elsinore, CA 92532
|
2,358 sq. feet
|
2 baths 6 beds |
show details | |

|
#20
Westlake Dr
Menifee, CA 92584
|
1,746 sq. feet
|
2 baths 3 beds |
show details |
| Photo | Address | Area | Beds / Baths | Price | Details |
|---|---|---|---|---|---|

|
#21
Coral Ave
Hemet, CA 92543
|
1,034 sq. feet
|
2 baths 2 beds |
show details | |

|
#22
Plymouth Way
Temecula, CA 92591
|
2,203 sq. feet
|
2 baths 3 beds |
show details | |

|
#23
Sonata Dr
Murrieta, CA 92562
|
3,028 sq. feet
|
3 baths 5 beds |
show details | |

|
#24
Whieldon Dr
Perris, CA 92571
|
2,177 sq. feet
|
2 baths 4 beds |
show details | |

|
#25
Blue Topaz Dr
Sun City, CA 92585
|
3,290 sq. feet
|
3 baths 5 beds |
show details | |

|
#26
Hibiscus
Lake Elsinore, CA 92530
|
3,014 sq. feet
|
5 baths 5 beds |
show details | |

|
#27
Oak Cliff Dr
Temecula, CA 92591
|
1,262 sq. feet
|
2 baths 3 beds |
show details | |

|
#28
Oradon Way
Hemet, CA 92545
|
883 sq. feet
|
2 baths 2 beds |
show details | |

|
#29
Tierra Shores Ln
Menifee, CA 92584
|
1,979 sq. feet
|
2 baths 3 beds |
show details | |

|
#30
Bonnie Lea Dr
Lake Elsinore, CA 92530
|
702 sq. feet
|
1 baths 1 beds |
show details |
| Photo | Address | Area | Beds / Baths | Price | Details |
|---|---|---|---|---|---|

|
#31
Mira Loma Dr
Temecula, CA 92592
|
1,645 sq. feet
|
1 baths 4 beds |
show details | |

|
#32
Cottonwood St
Murrieta, CA 92563
|
2,797 sq. feet
|
3 baths 4 beds |
show details | |

|
#33
Breighton Wood St
Menifee, CA 92584
|
3,393 sq. feet
|
2 baths 5 beds |
show details | |

|
#34
Baldy Peak Dr
Sun City, CA 92586
|
1,570 sq. feet
|
2 baths 3 beds |
show details | |

|
#35
Via Verde
Lake Elsinore, CA 92530
|
1,274 sq. feet
|
2 baths 3 beds |
show details | |

|
#36
Mcguire Rd
Perris, CA 92570
|
6,347 sq. feet
|
4 baths 5 beds |
show details | |

|
#37
Green Branch St
Menifee, CA 92584
|
3,090 sq. feet
|
2 baths 3 beds |
show details | |

|
#38
W Westmont Ave
Hemet, CA 92543
|
1,218 sq. feet
|
2 baths 2 beds |
show details | |

|
#39
Canopy Ln
Lake Elsinore, CA 92532
|
3,794 sq. feet
|
3 baths 6 beds |
show details | |

|
#40
Juniper Flats Rd
Nuevo, CA 92567
|
2,555 sq. feet
|
2 baths 3 beds |
show details |
| Photo | Address | Area | Beds / Baths | Price | Details |
|---|---|---|---|---|---|

|
#41
Avenida Bonita
Murrieta, CA 92562
|
3,359 sq. feet
|
4 baths 4 beds |
show details | |

|
#42
Capricho Cir
Temecula, CA 92590
|
3,248 sq. feet
|
3 baths 4 beds |
show details | |

|
#43
Fortuna St
Perris, CA 92571
|
- sq. feet
|
2 baths 3 beds |
show details | |

|
#44
Villa Valtelena
Lake Elsinore, CA 92532
|
2,589 sq. feet
|
3 baths 4 beds |
show details | |

|
#45
Serrana Rd
Perris, CA 92570
|
1,300 sq. feet
|
2 baths 3 beds |
show details | |

|
#46
Long St
Hemet, CA 92543
|
1,464 sq. feet
|
2 baths 2 beds |
show details | |

|
#47
Almont Way
Sun City, CA 92585
|
2,865 sq. feet
|
3 baths 6 beds |
show details | |

|
#48
Los Cabos Dr
Moreno Valley, CA 92551
|
1,411 sq. feet
|
2 baths 3 beds |
show details | |

|
#49
Lumerina St
Corona, CA 92883
|
3,675 sq. feet
|
3 baths 3 beds |
show details | |

|
Check over 1 million property listings on Foreclosure.com!
|
browse all offers | |||


Median year apartment built: 1982
Household type by relationship:
Households: 11,311- Male householders: 1,974 (269 living alone), Female householders: 2,234 (549 living alone)
2,479 spouses (2,446 opposite-sex spouses), 206 unmarried partners, (206 opposite-sex unmarried partners), 3,337 children (2,948 natural, 165 adopted, 223 stepchildren), 181 grandchildren, 101 brothers or sisters, 159 parents, 0 foster children, 116 other relatives, 498 non-relatives
- In group quarters: 20
Size of family households: 1,511 2-persons, 665 3-persons, 511 4-persons, 335 5-persons, 80 6-persons, 1 7-or-more-persons.
Size of nonfamily households: 794 1-person, 245 2-persons, 78 3-persons.
1,699 married couples with children.
518 single-parent households (124 men, 394 women).
92.5% of residents of Canyon Lake speak English at home.
3.9% of residents speak Spanish at home (85% speak English very well, 12% speak English well, 4% speak English not well).
0.5% of residents speak other Indo-European language at home (100% speak English very well).
2.1% of residents speak Asian or Pacific Island language at home (94% speak English very well, 3% speak English well, 3% speak English not well).
0.3% of residents speak other language at home (34% speak English very well, 66% speak English well).
Foreign born population: 650 (5.7%)
(57.1% of them are naturalized citizens)
| Here: | 6.4 |
| State: | 6.0 |
| Here: | 5.0 |
| State: | 3.9 |

- Bedrooms in owner-occupied houses and condos in Canyon Lake, California
- 23no bedroom
- 161 bedroom
- 2612 bedrooms
- 1,7623 bedrooms
- 1,0634 bedrooms
- 2015+ bedrooms

- Bedrooms in renter-occupied apartments in Canyon Lake, California
- 0no bedroom
- 351 bedroom
- 3372 bedrooms
- 4413 bedrooms
- 834 bedrooms
- 195+ bedrooms

- Cars and other vehicles available in Canyon Lake in owner-occupied houses/condos
- 64no vehicle
- 5571 vehicle
- 1,4542 vehicles
- 9213 vehicles
- 2344 vehicles
- 955+ vehicles

- Cars and other vehicles available in Canyon Lake in renter-occupied apartments
- 41no vehicle
- 4681 vehicle
- 1832 vehicles
- 1523 vehicles
- 524 vehicles
- 195+ vehicles

- Rooms in owner-occupied houses in Canyon Lake, California
- 01 room
- 82 rooms
- 1723 rooms
- 954 rooms
- 6095 rooms
- 7646 rooms
- 6867 rooms
- 3868 rooms
- 6039+ rooms

- Rooms in renter-occupied apartments in Canyon Lake, California
- 01 room
- 02 rooms
- 353 rooms
- 2754 rooms
- 2905 rooms
- 1186 rooms
- 1127 rooms
- 258 rooms
- 619+ rooms


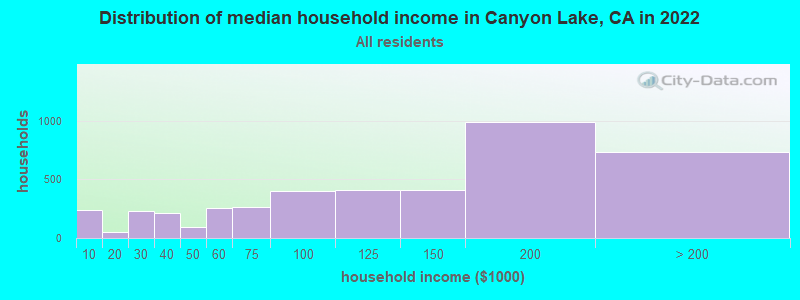
Canyon Lake, CA household income distribution

- 240Less than $10,000
- 54$10,000 to $19,999
- 227$20,000 to $29,999
- 209$30,000 to $39,999
- 90$40,000 to $49,999
- 258$50,000 to $59,999
- 266$60,000 to $74,999
- 398$75,000 to $99,999
- 412$100,000 to $124,999
- 412$125,000 to $149,999
- 989$150,000 to $199,999
- 737$200,000 or more
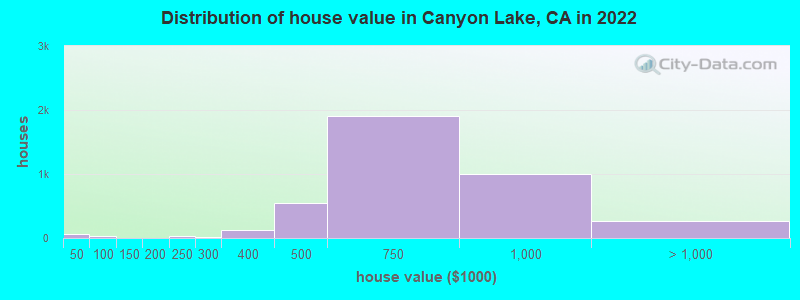
Home value of owner - occupied houses in 2022 in Canyon Lake, CA
-
- 42Less than $10,000
- 3$25,000 to $29,999
- 15$35,000 to $39,999
- 14$50,000 to $59,999
- 11$70,000 to $79,999
- 1$100,000 to $124,999
- 5$150,000 to $174,999
- 24$200,000 to $249,999
- 23$250,000 to $299,999
- 121$300,000 to $399,999
- 548$400,000 to $499,999
- 1,911$500,000 to $749,999
- 1,006$750,000 to $999,999
- 127$1,000,000 to $1,499,999
- 59$1,500,000 to $1,999,999
- 84$2,000,000 or more
Rent paid by renters in 2022 in Canyon Lake, CA
-
- 77$900 to $999
- 40$1,000 to $1,249
- 50$1,250 to $1,499
- 88$1,500 to $1,999
- 445$2,000 to $2,499
- 152$2,500 to $2,999
- 43$3,000 to $3,499
- 68No cash rent


Percentage of workers working in this county: 76.2%
Number of people working at home: 1,578 (29.6% of all workers)
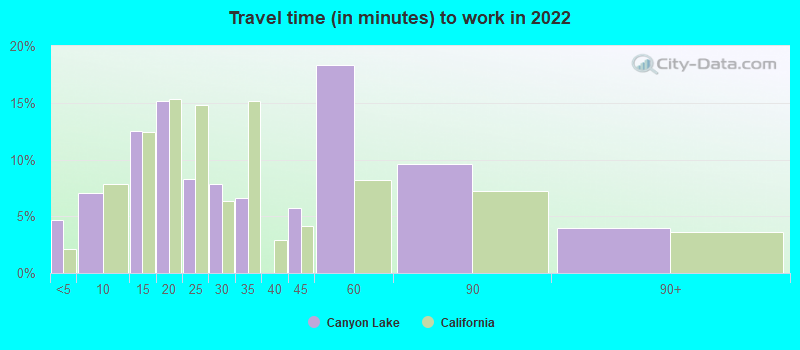
Travel time to work (commute)
- Less than 5 minutes: 91
- 5 to 9 minutes: 168
- 10 to 14 minutes: 224
- 15 to 19 minutes: 208
- 20 to 24 minutes: 380
- 25 to 29 minutes: 349
- 30 to 34 minutes: 551
- 35 to 39 minutes: 88
- 40 to 44 minutes: 73
- 45 to 59 minutes: 329
- 60 to 89 minutes: 747
- 90 or more minutes: 686
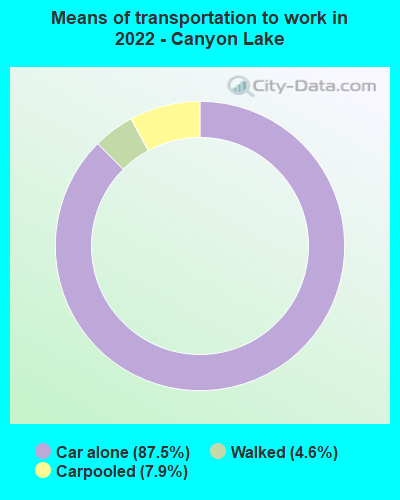
Means of transportation to work:
- Drove a car alone: 894 (38.4%)
- Carpooled: 87 (3.7%)
- Walked: 47 (2.0%)
- Worked at home: 1,578 (67.8%)

- Unemployment by race in 2022
- Unemployment rate for White non-Hispanic residents
- 1.1%Males
- 2.3%Females
- Unemployment rate for Asian residents
- 23.9%Males
- Unemployment rate for other race residents
- 12.2%Females
- Unemployment rate for two or more race residents
- 1.4%Males
- 5.8%Females
- Unemployment rate for Hispanic or Latino residents
- 2.0%Males
- 15.8%Females

- Year of entry for the foreign-born population in Canyon Lake, California
- 352010 or later
- 432000 to 2009
- 1271990 to 1999
- 921980 to 1989
- 711970 to 1979
- 186Before 1970

First ancestries reported:
- English: 562 (12.2%)
- Italian: 465 (10.1%)
- German: 340 (7.4%)
- Irish: 339 (7.4%)
- American: 171 (3.7%)
- European: 111 (2.4%)
- Scotch-Irish: 104 (2.3%)
- British: 52 (1.1%)
- Northern European: 50 (1.1%)
- French: 44 (1.0%)
- Scottish: 42 (0.9%)
- Yugoslavian: 29 (0.6%)
- Polish: 28 (0.6%)
- Lebanese: 25 (0.5%)
- Hungarian: 25 (0.5%)
- Portuguese: 24 (0.5%)
- Canadian: 23 (0.5%)
- French Canadian: 23 (0.5%)
- Swedish: 19 (0.4%)
- Norwegian: 15 (0.3%)
- Croatian: 14 (0.3%)
- Slovak: 14 (0.3%)
- Czech: 13 (0.3%)
- Eastern European: 13 (0.3%)
- Danish: 11 (0.2%)
- Welsh: 11 (0.2%)
- Russian: 9 (0.2%)
- Armenian: 7 (0.2%)
- Scandinavian: 6 (0.1%)
Most common places of birth for foreign-born residents (%):
| Canyon Lake: | 17.2% (112) |
| California: | 37.2% (3,881,193) |
| Canyon Lake: | 13.4% (87) |
| California: | 0.6% (57,953) |
| Canyon Lake: | 9.8% (64) |
| California: | 7.8% (818,297) |
| Canyon Lake: | 6.2% (40) |
| California: | 5.2% (539,184) |
| Canyon Lake: | 5.2% (34) |
| California: | 0.3% (31,757) |
| Canyon Lake: | 4.9% (32) |
| California: | 0.1% (10,936) |
| Canyon Lake: | 4.2% (27) |
| California: | 1.0% (103,575) |
| Canyon Lake: | 3.8% (25) |
| California: | 0.5% (51,974) |
| Canyon Lake: | 3.7% (24) |
| California: | 0.1% (12,221) |
| Canyon Lake: | 3.7% (24) |
| California: | 0.2% (16,586) |
| Canyon Lake: | 3.4% (22) |
| California: | 1.2% (127,477) |
| Canyon Lake: | 2.6% (17) |
| California: | 6.6% (684,672) |
| Canyon Lake: | 2.5% (16) |
| California: | 0.5% (48,911) |
| Canyon Lake: | 2.0% (13) |
| California: | 0.6% (58,161) |
| Canyon Lake: | 1.7% (11) |
| California: | 0.2% (20,997) |
| Canyon Lake: | 1.7% (11) |
| California: | 4.2% (440,287) |
| Canyon Lake: | 1.5% (10) |
| California: | 0.4% (39,097) |
| Canyon Lake: | 1.5% (10) |
| California: | 0.4% (42,718) |
Place of birth for U.S.-born residents:
- This state: 7,621
- Other state: 2,847
- Northeast: 679
- Midwest: 1,281
- South: 548
- West: 347
81.5% of Canyon Lake residents lived in the same house 1 years ago.
Out of people who lived in different houses, 38.6% lived in this county.
Out of people who lived in different counties, 48.0% lived in California.
| Canyon Lake: | 81.5% |
| State average: | 88.9% |
Education attainment for males 25 years and older:
- No schooling: 10
- Nursery to 4th grade: 0
- 5th and 6th grade: 0
- 7th and 8th grade: 20
- 9th grade: 0
- 10th grade: 47
- 11th grade: 10
- 12th grade, no diploma: 110
- High school graduate (or equivalency): 944
- Less than 1 year of college: 307
- Some college more than 1 year, no degree: 857
- Associate degree: 467
- Bachelor's degree: 590
- Master's degree: 526
- Professional school degree: 106
- Doctorate degree: 78

Education attainment for females 25 years and older:
- No schooling: 28
- Nursery to 4th grade: 0
- 5th and 6th grade: 22
- 7th and 8th grade: 47
- 9th grade: 19
- 10th grade: 0
- 11th grade: 0
- 12th grade, no diploma: 28
- High school graduate (or equivalency): 947
- Less than 1 year of college: 588
- Some college more than 1 year, no degree: 683
- Associate degree: 494
- Bachelor's degree: 888
- Master's degree: 319
- Professional school degree: 30
- Doctorate degree: 51


Housing units in structures:
- One, detached: 3,851
- One, attached: 215
- 3 or 4: 263
- 5 to 9: 34
- 10 to 19: 46
- 20 to 49: 51
- 50 or more: 14
- Mobile homes: 104
Median worth of mobile homes: $12,786
Housing units lacking complete kitchen facilities in 2022: 0.7%
House/condo owner moved in on average 11 years ago
Renter moved in on average 1 years ago

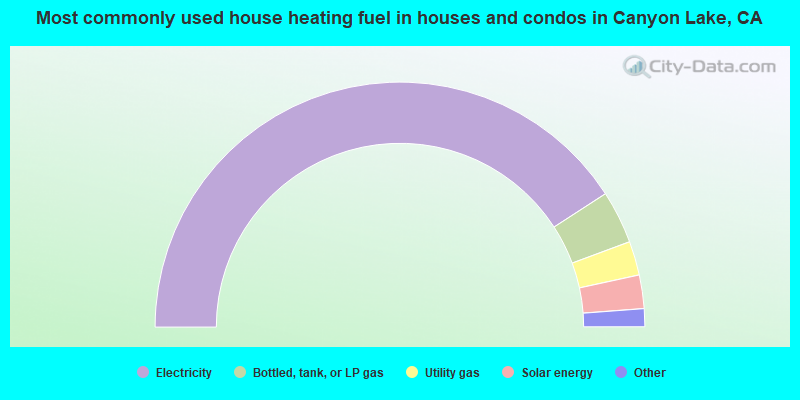
- 81.7%Electricity
- 7.0%Bottled, tank, or LP gas
- 4.5%Utility gas
- 4.4%Solar energy
- 1.2%Wood
- 0.9%No fuel used
- 0.2%Fuel oil, kerosene, etc.
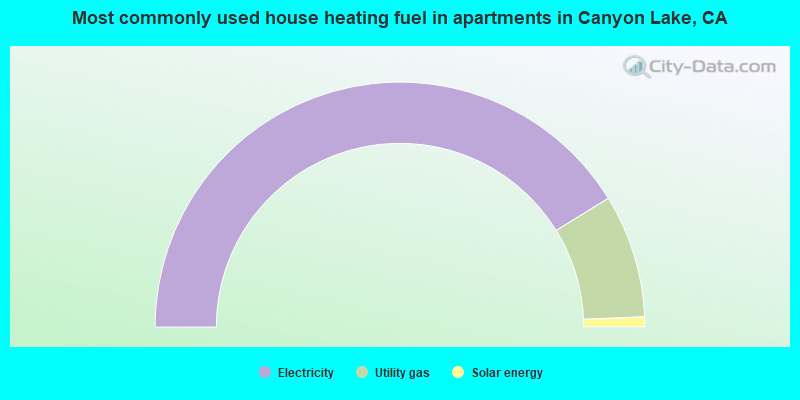
- 82.4%Electricity
- 16.3%Utility gas
- 1.3%Solar energy
Private vs. public school enrollment:
| Here: | 4.0% |
| California: | 10.5% |
| Here: | 6.6% |
| California: | 8.5% |
| Here: | 21.3% |
| California: | 15.9% |


