Capitola, CA (California) Houses and Residents
| Capitola: | $901,884 |
| California: | $715,900 |
Mean price in 2022:
Detached houses: $1,360,648
Here: $1,360,648 State: $988,808 Townhouses or other attached units: $1,175,003
Here: $1,175,003 State: $838,546 In 2-unit structures: $668,320
Here: $668,320 State: $1,138,100 In 3-to-4-unit structures: $603,193
Here: $603,193 State: $824,253 In 5-or-more-unit structures: $736,983
Here: $736,983 State: $730,996 Mobile homes: $457,013
Here: $457,013 State: $184,506
Total population: 10,146 (All urban)
Houses: 5,199 (4,617 occupied: 2,203 owner occupied, 2,362 renter occupied)
| % of renters here: | 52% |
| State: | 44% |
Housing density: 3,223 houses/condos per square mile
Median price asked for vacant for-sale houses and condos in 2022: $8,249,435.
Median contract rent in 2022: over $2,000 (lower quartile is $1,544, upper quartile is over $2,000)
Median rent asked for vacant for-rent units in 2022: $3,589
Median gross rent in Capitola, CA in 2022: over $2,000
Housing units in Capitola with a mortgage: 1,103 (141 second mortgage, 0 home equity loan, 137 both second mortgage and home equity loan)
Houses without a mortgage: 0
Median household income for houses/condos with a mortgage: $110,361
Median household income for apartments without a mortgage: $88,957
Median monthly housing costs: $1,869
Compare current foreclosures near Capitola, CA:
| Photo | Address | Area | Beds / Baths | Price | Details |
|---|---|---|---|---|---|

|
#1
46th Ave Apt 89
Capitola, CA 95010
|
- sq. feet
|
1 baths 2 beds |
show details | |

|
#2
Ponselle Ln Apt 2
Capitola, CA 95010
|
- sq. feet
|
- baths - beds |
show details | |

|
#3
Balboa Ave Apt 2
Capitola, CA 95010
|
- sq. feet
|
- baths - beds |
show details | |

|
#4
48th Ave
Capitola, CA 95010
|
- sq. feet
|
- baths 2 beds |
show details | |

|
#5
Mccormick Ave
Capitola, CA 95010
|
- sq. feet
|
- baths - beds |
show details | |

|
#6
Bay Ave Apt 1104
Capitola, CA 95010
|
- sq. feet
|
- baths - beds |
show details | |

|
#7
Francesco Cir
Capitola, CA 95010
|
- sq. feet
|
- baths - beds |
show details | |

|
#8
San Vicente Ter
Santa Cruz, CA 95060
|
- sq. feet
|
1 baths 2 beds |
$220,000
|
show details |

|
#9
Enos Ln
Watsonville, CA 95076
|
2,179 sq. feet
|
2 baths 3 beds |
show details | |

|
#10
Hazel Ct
Soquel, CA 95073
|
3,071 sq. feet
|
3 baths 4 beds |
show details |
| Photo | Address | Area | Beds / Baths | Price | Details |
|---|---|---|---|---|---|

|
#11
Migues Mountain Ln
Aptos, CA 95003
|
4,500 sq. feet
|
2 baths 3 beds |
show details | |

|
#12
Empire Grade
Santa Cruz, CA 95060
|
1,438 sq. feet
|
2 baths 3 beds |
show details | |

|
#13
Bahr Dr
Ben Lomond, CA 95005
|
2,231 sq. feet
|
3 baths 4 beds |
show details | |

|
#14
Western Avenue
Boulder Creek, CA 95006
|
1,468 sq. feet
|
2 baths 2 beds |
show details | |

|
#15
Hall Ranch Rd
Santa Cruz, CA 95065
|
1,534 sq. feet
|
2 baths 2 beds |
show details | |

|
#16
Johnson Rd
Watsonville, CA 95076
|
1,852 sq. feet
|
3 baths 6 beds |
show details | |

|
#17
Migues Mountain Ln
Aptos, CA 95003
|
2,106 sq. feet
|
2 baths 3 beds |
show details | |

|
#18
Loma Prieta Ave
Los Gatos, CA 95033
|
4,167 sq. feet
|
4 baths 4 beds |
show details | |

|
#19
Fresco St
Felton, CA 95018
|
- sq. feet
|
1 baths 1 beds |
show details | |

|
#20
Summit Rd
Los Gatos, CA 95033
|
1,135 sq. feet
|
1 baths 2 beds |
show details |
| Photo | Address | Area | Beds / Baths | Price | Details |
|---|---|---|---|---|---|

|
#21
Alisa Cir
Watsonville, CA 95076
|
- sq. feet
|
1 baths 2 beds |
show details | |

|
#22
Fruitland Ave
Watsonville, CA 95076
|
2,345 sq. feet
|
2 baths 2 beds |
show details | |

|
#23
Osborn Rd
Watsonville, CA 95076
|
1,228 sq. feet
|
1 baths 3 beds |
show details | |

|
#24
Las Lomas Dr
Watsonville, CA 95076
|
1,259 sq. feet
|
2 baths 3 beds |
show details | |

|
#25
Gregory Rd
Watsonville, CA 95076
|
1,619 sq. feet
|
2 baths 4 beds |
show details | |

|
#26
Willow Rd
Watsonville, CA 95076
|
1,976 sq. feet
|
1 baths 4 beds |
show details | |

|
#27
Las Lomas Dr
Watsonville, CA 95076
|
1,120 sq. feet
|
1 baths 3 beds |
show details | |

|
#28
Loma Prieta Ave
Los Gatos, CA 95033
|
4,167 sq. feet
|
4 baths 4 beds |
show details | |

|
#29
Pajaro Cir
Freedom, CA 95019
|
- sq. feet
|
4 baths 4 beds |
show details | |

|
#30
Oakridge Ct
Watsonville, CA 95076
|
- sq. feet
|
2 baths 3 beds |
show details |
| Photo | Address | Area | Beds / Baths | Price | Details |
|---|---|---|---|---|---|

|
#31
Rialto Dr
Watsonville, CA 95076
|
- sq. feet
|
2 baths 3 beds |
show details | |

|
#32
Lawrence Ave
Watsonville, CA 95076
|
- sq. feet
|
2 baths 3 beds |
show details | |

|
#33
Pine Hill Dr
Santa Cruz, CA 95060
|
- sq. feet
|
3 baths 4 beds |
show details | |

|
#34
Compton Ter
Freedom, CA 95019
|
- sq. feet
|
2 baths 4 beds |
show details | |

|
#35
Brackney Rd
Ben Lomond, CA 95005
|
- sq. feet
|
1 baths 3 beds |
show details | |

|
#36
Jared Way
Freedom, CA 95019
|
- sq. feet
|
4 baths 3 beds |
show details | |

|
#37
Empire Grade
Santa Cruz, CA 95060
|
- sq. feet
|
2 baths 3 beds |
show details | |

|
#38
Freedom Blvd
Watsonville, CA 95076
|
- sq. feet
|
1 baths 2 beds |
show details | |

|
#39
Eleana Dr
Ben Lomond, CA 95005
|
- sq. feet
|
2 baths 3 beds |
show details | |

|
#40
Freedom Blvd # A
Watsonville, CA 95076
|
- sq. feet
|
2 baths 3 beds |
show details |
| Photo | Address | Area | Beds / Baths | Price | Details |
|---|---|---|---|---|---|

|
#41
Bowker Rd
Freedom, CA 95019
|
- sq. feet
|
2 baths 2 beds |
show details | |

|
#42
Mark Ave
Watsonville, CA 95076
|
- sq. feet
|
2 baths 3 beds |
show details | |

|
#43
Pioneer Rd
Watsonville, CA 95076
|
- sq. feet
|
2 baths 3 beds |
show details | |

|
#44
Rainbow Ln
Watsonville, CA 95076
|
- sq. feet
|
2 baths 4 beds |
show details | |

|
#45
Glenwood Cutoff
Scotts Valley, CA 95066
|
- sq. feet
|
1 baths 2 beds |
show details | |

|
#46
Bright View Ln
Watsonville, CA 95076
|
- sq. feet
|
2 baths 3 beds |
show details | |

|
#47
Lynbrook Ct
Watsonville, CA 95076
|
- sq. feet
|
2 baths 2 beds |
show details | |

|
#48
Clifford Ave
Watsonville, CA 95076
|
- sq. feet
|
2 baths 3 beds |
show details | |

|
#49
Summit Rd
Watsonville, CA 95076
|
- sq. feet
|
2 baths 4 beds |
show details | |

|
Check over 1 million property listings on Foreclosure.com!
|
browse all offers | |||

Latest news about housing in Capitola, CA collected exclusively by city-data.com from local newspapers, TV, and radio stations

 | House Rental in Monterey/Santa Cruz (63 replies) |
| Snowy spot between Santa Cruz & Las Vegas? (31 replies) |
| I am having second thoughts of leaving California (113 replies) |
| Resident-Owned Mobile Home Parks, Santa Cruz Area--Seeking Information (0 replies) |
| Gay Couple Looking for Small Liberal Forest Town in CA (35 replies) |
| Major city without a lot of smoke or air quality problems? (11 replies) |

Median year apartment built: 1972
Household type by relationship:
Households: 9,765- Male householders: 2,115 (659 living alone), Female householders: 2,400 (896 living alone)
1,533 spouses (1,526 opposite-sex spouses), 343 unmarried partners, (343 opposite-sex unmarried partners), 2,133 children (2,022 natural, 48 adopted, 62 stepchildren), 87 grandchildren, 5 brothers or sisters, 82 parents, 0 foster children, 68 other relatives, 767 non-relatives
- In group quarters: 226
Size of family households: 1,282 2-persons, 402 3-persons, 497 4-persons, 85 5-persons, 34 7-or-more-persons.
Size of nonfamily households: 1,573 1-person, 532 2-persons, 108 3-persons, 19 4-persons, 22 7-or-more-persons.
770 married couples with children.
549 single-parent households (242 men, 307 women).
81.8% of residents of Capitola speak English at home.
11.9% of residents speak Spanish at home (70% speak English very well, 16% speak English well, 10% speak English not well, 3% don't speak English at all).
2.4% of residents speak other Indo-European language at home (90% speak English very well, 10% speak English well).
3.7% of residents speak Asian or Pacific Island language at home (63% speak English very well, 30% speak English well, 7% speak English not well).
0.1% of residents speak other language at home (100% speak English well).
Foreign born population: 1,273 (13.0%)
(45.0% of them are naturalized citizens)
| Here: | 5.1 |
| State: | 6.0 |
| Here: | 3.9 |
| State: | 3.9 |

- Bedrooms in owner-occupied houses and condos in Capitola, California
- 0no bedroom
- 1661 bedroom
- 9342 bedrooms
- 8803 bedrooms
- 2074 bedrooms
- 165+ bedrooms

- Bedrooms in renter-occupied apartments in Capitola, California
- 101no bedroom
- 4421 bedroom
- 1,4382 bedrooms
- 3683 bedrooms
- 144 bedrooms
- 05+ bedrooms

- Cars and other vehicles available in Capitola in owner-occupied houses/condos
- 61no vehicle
- 7931 vehicle
- 1,0912 vehicles
- 1303 vehicles
- 1284 vehicles
- 05+ vehicles

- Cars and other vehicles available in Capitola in renter-occupied apartments
- 128no vehicle
- 1,2531 vehicle
- 9012 vehicles
- 593 vehicles
- 224 vehicles
- 05+ vehicles

- Rooms in owner-occupied houses in Capitola, California
- 01 room
- 392 rooms
- 2403 rooms
- 4974 rooms
- 5115 rooms
- 3106 rooms
- 2657 rooms
- 1148 rooms
- 2279+ rooms

- Rooms in renter-occupied apartments in Capitola, California
- 741 room
- 832 rooms
- 6753 rooms
- 7044 rooms
- 4925 rooms
- 2676 rooms
- 367 rooms
- 148 rooms
- 209+ rooms


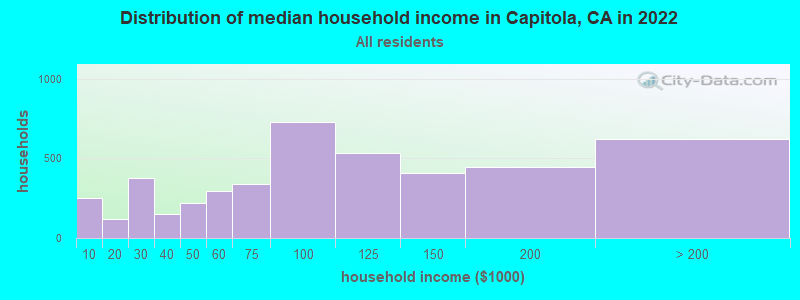
Capitola, CA household income distribution

- 254Less than $10,000
- 118$10,000 to $19,999
- 377$20,000 to $29,999
- 151$30,000 to $39,999
- 221$40,000 to $49,999
- 297$50,000 to $59,999
- 341$60,000 to $74,999
- 729$75,000 to $99,999
- 537$100,000 to $124,999
- 406$125,000 to $149,999
- 449$150,000 to $199,999
- 623$200,000 or more
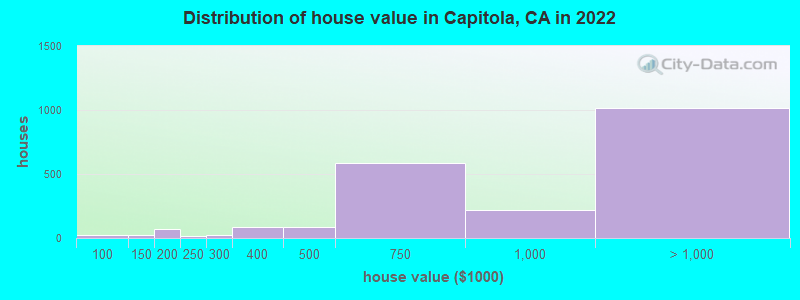
Home value of owner - occupied houses in 2022 in Capitola, CA
-
- 22$70,000 to $79,999
- 26$100,000 to $124,999
- 9$150,000 to $174,999
- 61$175,000 to $199,999
- 14$200,000 to $249,999
- 22$250,000 to $299,999
- 82$300,000 to $399,999
- 85$400,000 to $499,999
- 582$500,000 to $749,999
- 222$750,000 to $999,999
- 546$1,000,000 to $1,499,999
- 349$1,500,000 to $1,999,999
- 122$2,000,000 or more
Rent paid by renters in 2022 in Capitola, CA
-
- 40$250 to $299
- 24$300 to $349
- 64$800 to $899
- 15$900 to $999
- 163$1,000 to $1,249
- 91$1,250 to $1,499
- 604$1,500 to $1,999
- 410$2,000 to $2,499
- 317$2,500 to $2,999
- 408$3,000 to $3,499
- 21$3,500 or more
- 58No cash rent


Percentage of workers working in this county: 86.0%
Number of people working at home: 1,549 (31.2% of all workers)
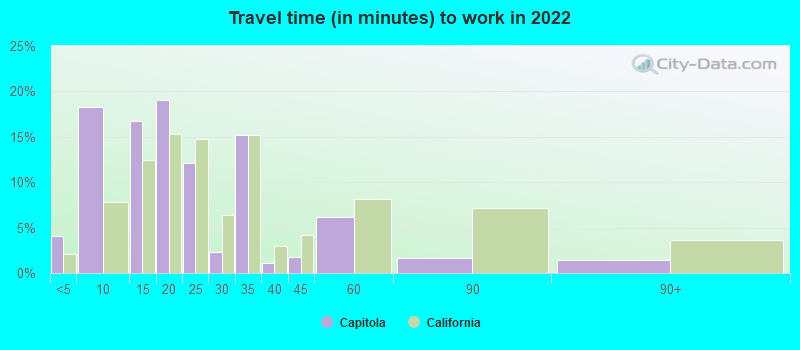
Travel time to work (commute)
- Less than 5 minutes: 280
- 5 to 9 minutes: 444
- 10 to 14 minutes: 464
- 15 to 19 minutes: 815
- 20 to 24 minutes: 420
- 25 to 29 minutes: 72
- 30 to 34 minutes: 263
- 35 to 39 minutes: 21
- 40 to 44 minutes: 115
- 45 to 59 minutes: 414
- 60 to 89 minutes: 203
- 90 or more minutes: 82
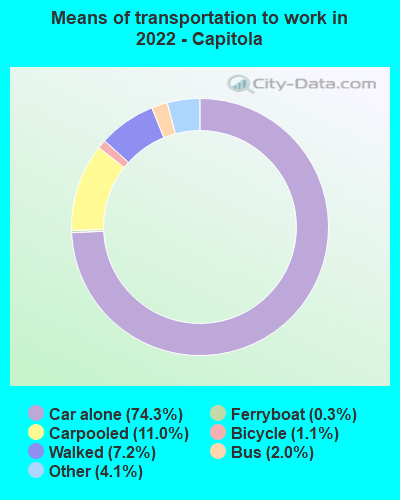
Means of transportation to work:
- Drove a car alone: 3,391 (54.8%)
- Carpooled: 558 (9.0%)
- Bus: 130 (2.1%)
- Ferryboat: 15 (0.2%)
- Taxi: 205 (3.3%)
- Bicycle: 59 (1.0%)
- Walked: 322 (5.2%)
- Worked at home: 1,549 (25.0%)

- Unemployment by race in 2022
- Unemployment rate for White non-Hispanic residents
- 4.9%Males
- 0.5%Females
- Unemployment rate for Asian residents
- 3.0%Males
- 7.2%Females
- Unemployment rate for two or more race residents
- 2.5%Females

- Year of entry for the foreign-born population in Capitola, California
- 3832010 or later
- 3392000 to 2009
- 1881990 to 1999
- 3701980 to 1989
- 1771970 to 1979
- 225Before 1970

First ancestries reported:
- English: 310 (7.9%)
- Italian: 264 (6.8%)
- American: 262 (6.7%)
- Irish: 256 (6.5%)
- German: 234 (6.0%)
- British: 96 (2.5%)
- European: 62 (1.6%)
- Scottish: 59 (1.5%)
- Polish: 47 (1.2%)
- Norwegian: 42 (1.1%)
- Portuguese: 39 (1.0%)
- Scandinavian: 37 (0.9%)
- Greek: 35 (0.9%)
- Ukrainian: 30 (0.8%)
- Iranian: 29 (0.7%)
- Armenian: 24 (0.6%)
- Russian: 22 (0.6%)
- Swedish: 21 (0.5%)
- Northern European: 20 (0.5%)
- Croatian: 18 (0.5%)
- Serbian: 17 (0.4%)
- Assyrian: 11 (0.3%)
- Canadian: 7 (0.2%)
- Czechoslovakian: 7 (0.2%)
- French Canadian: 6 (0.2%)
- Austrian: 4 (0.1%)
- Finnish: 4 (0.1%)
- French: 2 (0.05%)
Most common places of birth for foreign-born residents (%):
| Capitola: | 28.0% (348) |
| California: | 37.2% (3,881,193) |
| Capitola: | 10.6% (131) |
| California: | 0.6% (60,582) |
| Capitola: | 9.6% (119) |
| California: | 5.2% (539,184) |
| Capitola: | 7.0% (87) |
| California: | 4.2% (440,287) |
| Capitola: | 6.3% (78) |
| California: | 0.3% (31,439) |
| Capitola: | 5.2% (65) |
| California: | 0.7% (73,304) |
| Capitola: | 4.8% (59) |
| California: | 1.0% (103,575) |
| Capitola: | 4.3% (53) |
| California: | 6.6% (684,672) |
| Capitola: | 3.4% (42) |
| California: | 2.0% (206,004) |
| Capitola: | 3.2% (40) |
| California: | 0.6% (58,161) |
| Capitola: | 2.6% (32) |
| California: | 7.8% (818,297) |
| Capitola: | 2.6% (32) |
| California: | 0.1% (11,157) |
| Capitola: | 2.1% (26) |
| California: | 0.8% (78,847) |
| Capitola: | 1.6% (20) |
| California: | 1.0% (105,215) |
Place of birth for U.S.-born residents:
- This state: 6,319
- Other state: 2,022
- Northeast: 760
- Midwest: 666
- South: 340
- West: 232
88.7% of Capitola residents lived in the same house 1 years ago.
Out of people who lived in different houses, 32.5% lived in this county.
Out of people who lived in different counties, 76.9% lived in California.
| Capitola: | 88.7% |
| State average: | 88.9% |
Education attainment for males 25 years and older:
- No schooling: 152
- Nursery to 4th grade: 0
- 5th and 6th grade: 0
- 7th and 8th grade: 0
- 9th grade: 0
- 10th grade: 0
- 11th grade: 115
- 12th grade, no diploma: 75
- High school graduate (or equivalency): 697
- Less than 1 year of college: 224
- Some college more than 1 year, no degree: 375
- Associate degree: 288
- Bachelor's degree: 1,111
- Master's degree: 391
- Professional school degree: 80
- Doctorate degree: 93

Education attainment for females 25 years and older:
- No schooling: 39
- Nursery to 4th grade: 9
- 5th and 6th grade: 0
- 7th and 8th grade: 17
- 9th grade: 85
- 10th grade: 0
- 11th grade: 47
- 12th grade, no diploma: 115
- High school graduate (or equivalency): 429
- Less than 1 year of college: 270
- Some college more than 1 year, no degree: 489
- Associate degree: 591
- Bachelor's degree: 1,201
- Master's degree: 695
- Professional school degree: 143
- Doctorate degree: 26


Housing units in structures:
- One, detached: 1,812
- One, attached: 320
- Two: 443
- 3 or 4: 1,082
- 5 to 9: 278
- 10 to 19: 369
- 20 to 49: 179
- 50 or more: 195
- Mobile homes: 517
Median worth of mobile homes: $473,041
House/condo owner moved in on average 12 years ago
Renter moved in on average 3 years ago

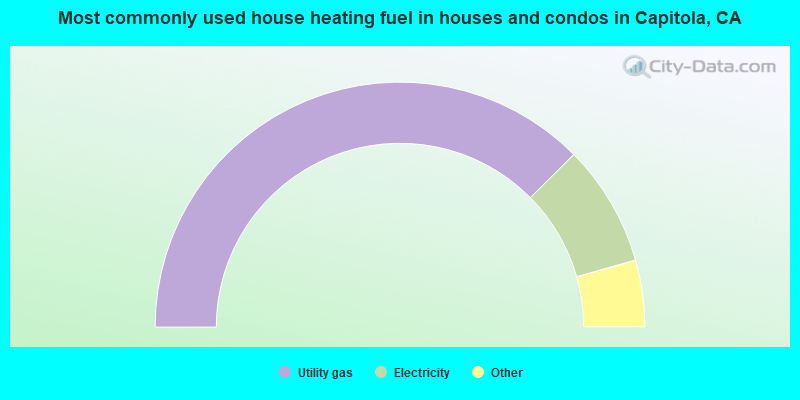
- 75.2%Utility gas
- 16.1%Electricity
- 3.5%Other fuel
- 3.2%Bottled, tank, or LP gas
- 1.2%Wood
- 0.8%No fuel used
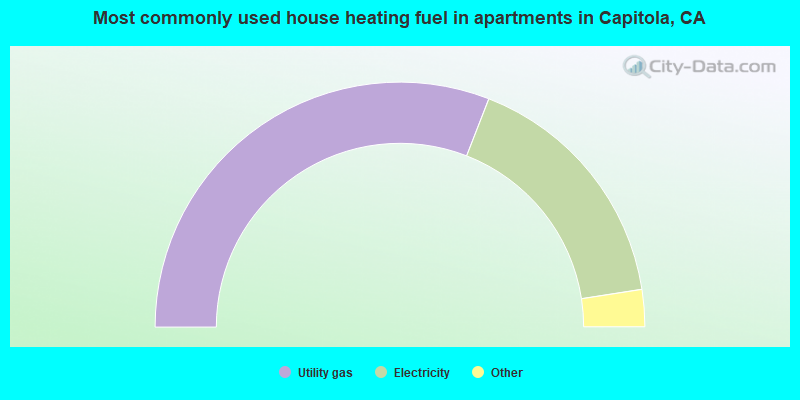
- 61.9%Utility gas
- 33.3%Electricity
- 3.7%No fuel used
- 1.1%Bottled, tank, or LP gas
Private vs. public school enrollment:
| Here: | 23.2% |
| California: | 10.5% |
| Here: | 10.5% |
| California: | 8.5% |
| Here: | 2.4% |
| California: | 15.9% |


