Carmel, IN (Indiana) Houses and Residents
Estimated median house or condo value in 2022: $465,900 (it was $201,400 in 2000 )
Carmel:
$465,900Indiana:
$208,700
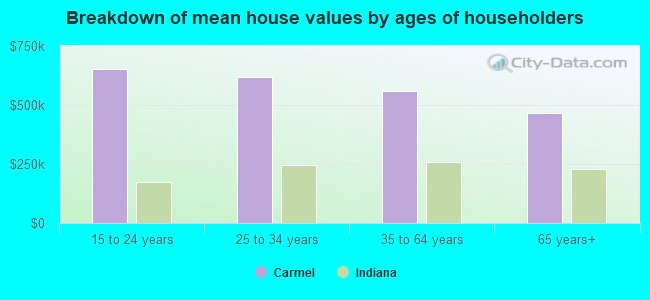
Lower value quartile - upper value quartile: $346,700 - $663,500Mean price in 2022: Detached houses: $547,917 Here:
$547,917State:
$257,916
Townhouses or other attached units: $311,668 Here:
$311,668State:
$224,114
In 3-to-4-unit structures: $266,324 Here:
$266,324State:
$151,116
In 5-or-more-unit structures: $196,900 Here:
$196,900State:
$200,844
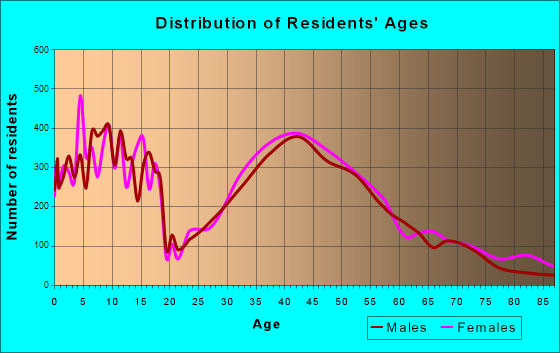
Total population: 86,682 (Urban population: 37,802, Rural population: 0)
Houses: 41,456 (38,557 occupied: 28,185 owner occupied, 10,372 renter occupied )
% of renters here:
27%State:
29%
Housing density: 2,327 houses/condos per square mile
Median price asked for vacant for-sale houses and condos in 2022: $859,774.
Median contract rent in 2022: $1,444 (lower quartile is $1,160, upper quartile is $1,895)
Median rent asked for vacant for-rent units in 2022: $3,117
Median gross rent in Carmel, IN in 2022: $1,597
Housing units in Carmel with a mortgage: 19,347 (2,473 second mortgage, 0 home equity loan, 2,373 both second mortgage and home equity loan )Houses without a mortgage: 667
Median household income for houses/condos with a mortgage: $178,693
Median household income for apartments without a mortgage: $115,506
Median monthly housing costs: $1,703
Data:
Median house or condo value ($)
Median house or condo value ($ change since 2000)
Median house or condo value ($) - White
Median house or condo value ($) - Black or African American
Median house or condo value ($) - Asian
Median house or condo value ($) - Hispanic or Latino
Median house or condo value ($) - American Indian and Alaska Native
Median house or condo value ($) - Multirace
Median house or condo value ($) - Other Race
Median price asked for mobile homes ($)
Household density (households per square mile)
Mean house or condo value by units in structure - 1, detached ($)
Mean house or condo value by units in structure - 1, attached ($)
Mean house or condo value by units in structure - 2 ($)
Mean house or condo value by units in structure by units in structure - 3 or 4 ($)
Mean house or condo value by units in structure - 5 or more ($)
Mean house or condo value by units in structure - Boat, RV, van, etc. ($)
Mean house or condo value by units in structure - Mobile home ($)
Median contract rent ($)
Median contract rent - Lower quartile ($)
Median contract rent - Upper quartile ($)
Median gross rent ($)
Urban houses (%)
Rural houses (%)
Houses occupied (%)
Houses occupied (% change since 2000)
Houses owner occupied (%)
Houses owner occupied (% change since 2000)
Houses renter occupied (%)
Houses renter occupied (% change since 2000)
Vacant housing units - For rent (%)
Vacant housing units - For rent (% change since 2000)
Vacant housing units - For sale only (%)
Vacant housing units - For sale only (% change since 2000)
Vacant housing units - Rented or sold, not occupied (%)
Vacant housing units - Rented or sold, not occupied (% change since 2000)
Vacant housing units - For seasonal, recreational, or occasional use (%)
Vacant housing units - For seasonal, recreational, or occasional use (% change since 2000)
Vacant housing units - For migrant workers (%)
Vacant housing units - For migrant workers (% change since 2000)
Vacant housing units - Other vacant (%)
Vacant housing units - Other vacant (% change since 2000)
Median monthly housing costs ($)
Median household income for houses/condos with a mortgage ($)
Median household income for houses/condos without a mortgage ($)
Median household income ($)
Median household income ($) - White
Median household income ($) - Black or African American
Median household income ($) - Asian
Median household income ($) - Hispanic or Latino
Median household income ($) - American Indian and Alaska Native
Median household income ($) - Multirace
Median household income ($) - Other Race
Mortgage status - with mortgage (%)
Mortgage status - with second mortgage (%)
Mortgage status - with home equity loan (%)
Mortgage status - with both second mortgage and home equity loan (%)
Mortgage status - without a mortgage (%)
Median year house/condo built
Median year apartment built
Household type by relationship - Male householder living alone (%)
Household type by relationship - Male householder not living alone (%)
Household type by relationship - Female householder living alone (%)
Household type by relationship - Female householder not living alone (%)
Household type by relationship - Opposite-Sex spouse (%)
Household type by relationship - Same-Sex spouse (%)
Household type by relationship - Opposite-Sex unmarried partner (%)
Household type by relationship - Same-Sex unmarried partner (%)
Household type by relationship - In group quarters (%)
Size of family households - 2-person household (%)
Size of family households - 3-person household (%)
Size of family households - 4-person household (%)
Size of family households - 5-person household (%)
Size of family households - 6-person household (%)
Size of family households - 7-or-more-person household (%)
Size of nonfamily households - 1-person household (%)
Size of nonfamily households - 2-person household (%)
Size of nonfamily households - 3-person household (%)
Size of nonfamily households - 4-person household (%)
Size of nonfamily households - 5-person household (%)
Size of nonfamily households - 6-person household (%)
Size of nonfamily households - 7-or-moreperson household (%)
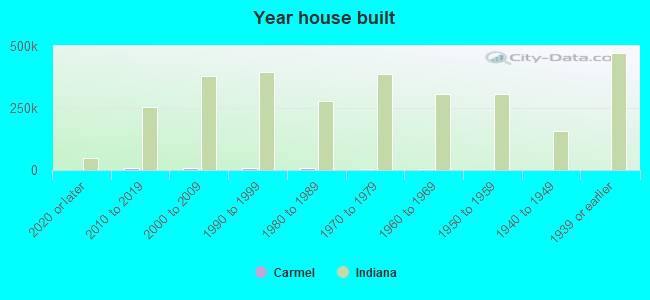
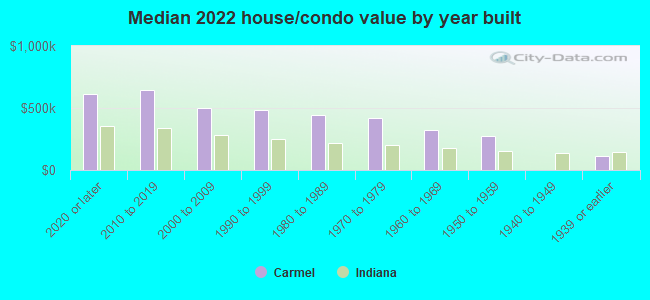
Year house built - Built 2010 or later (%)
Year house built - Built 2000 to 2009 (%)
Year house built - Built 1990 to 1999 (%)
Year house built - Built 1980 to 1989 (%)
Year house built - Built 1970 to 1979 (%)
Year house built - Built 1960 to 1969 (%)
Year house built - Built 1950 to 1959 (%)
Year house built - Built 1940 to 1949 (%)
Year house built - Built 1939 or earlier (%)
Median number of rooms in houses and condos
Median number of rooms in apartments
Median number of bedrooms in owner occupied houses
Mean number of bedrooms in owner occupied houses
Median number of bedrooms in renter occupied houses
Mean number of bedrooms in renter occupied houses
Median number of vehichles in owner occupied houses
Mean number of vehichles in owner occupied houses
Median number of vehichles in renter occupied houses
Mean number of vehichles in renter occupied houses
Rooms in owner-occupied houses - 1 room (%)
Rooms in owner-occupied houses - 2 rooms (%)
Rooms in owner-occupied houses - 3 rooms (%)
Rooms in owner-occupied houses - 4 rooms (%)
Rooms in owner-occupied houses - 5 rooms (%)
Rooms in owner-occupied houses - 6 rooms (%)
Rooms in owner-occupied houses - 7 rooms (%)
Rooms in owner-occupied houses - 8 rooms (%)
Rooms in owner-occupied houses - 9+ rooms (%)
Rooms in renter-occupied houses - 1 room (%)
Rooms in renter-occupied houses - 2 rooms (%)
Rooms in renter-occupied houses - 3 rooms (%)
Rooms in renter-occupied houses - 4 rooms (%)
Rooms in renter-occupied houses - 5 rooms (%)
Rooms in renter-occupied houses - 6 rooms (%)
Rooms in renter-occupied houses - 7 rooms (%)
Rooms in renter-occupied houses - 8 rooms (%)
Rooms in renter-occupied houses - 9+ rooms (%)
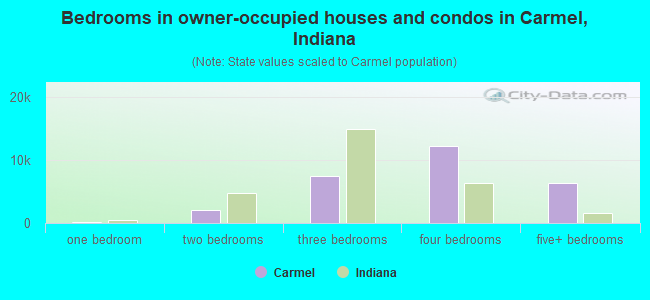
Bedrooms in owner-occupied houses - no bedrooms (%)
Bedrooms in owner-occupied houses - 1 bedroom (%)
Bedrooms in owner-occupied houses - 2 bedrooms (%)
Bedrooms in owner-occupied houses - 3 bedrooms (%)
Bedrooms in owner-occupied houses - 4 bedrooms (%)
Bedrooms in owner-occupied houses - 5+ bedrooms (%)
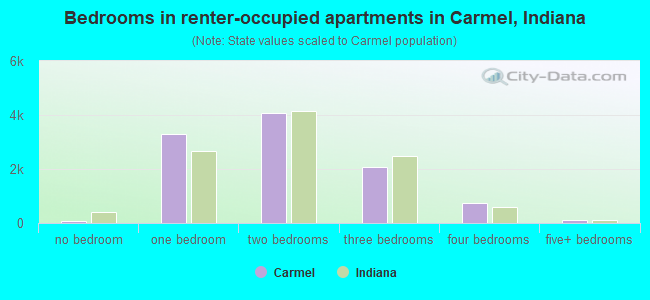
Bedrooms in renter-occupied houses - no bedrooms (%)
Bedrooms in renter-occupied houses - 1 bedroom (%)
Bedrooms in renter-occupied houses - 2 bedrooms (%)
Bedrooms in renter-occupied houses - 3 bedrooms (%)
Bedrooms in renter-occupied houses - 4 bedrooms (%)
Bedrooms in renter-occupied houses - 5+ bedrooms (%)
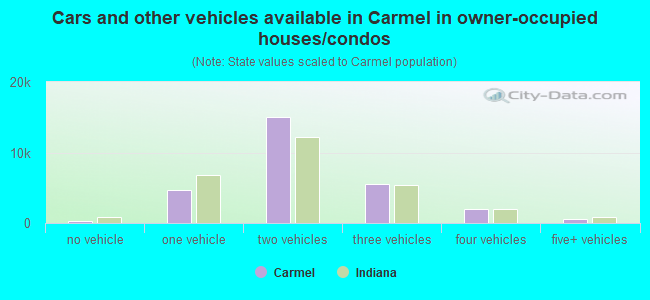
Vehicles available in owner-occupied houses - no vehicle available (%)
Vehicles available in owner-occupied houses - 1 vehicle available(%)
Vehicles available in owner-occupied houses - 2 Vehicles available (%)
Vehicles available in owner-occupied houses - 3 Vehicles available (%)
Vehicles available in owner-occupied houses - 4 Vehicles available (%)
Vehicles available in owner-occupied houses - 5+ Vehicles available (%)
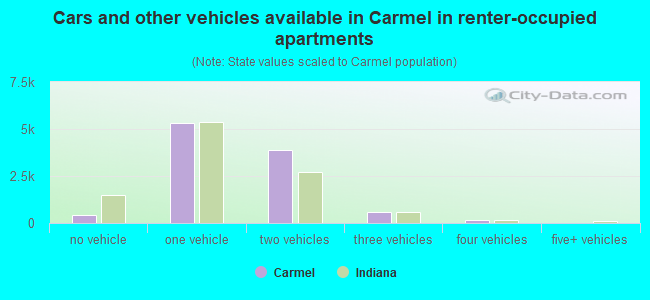
Vehicles available in renter-occupied houses - no vehicle available (%)
Vehicles available in renter-occupied houses - 1 vehicle available (%)
Vehicles available in renter-occupied houses - 2 Vehicles available (%)
Vehicles available in renter-occupied houses - 3 Vehicles available (%)
Vehicles available in renter-occupied houses - 4 Vehicles available (%)
Vehicles available in renter-occupied houses - 5+ Vehicles available (%)
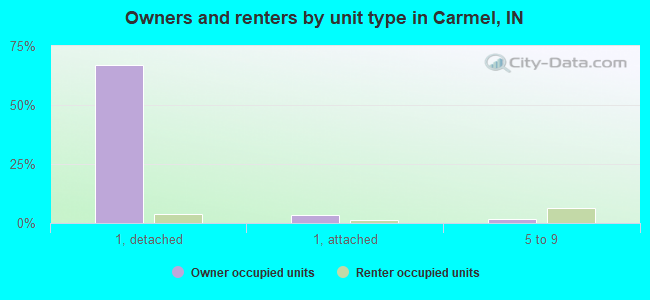
Housing units in structures - 1, detached (%)
Housing units in structures - 1, attached (%)
Housing units in structures - 2 (%)
Housing units in structures - 3 or 4 (%)
Housing units in structures - 5 to 9 (%)
Housing units in structures - 10 to 19 (%)
Housing units in structures - 20 to 49 (%)
Housing units in structures - 50 or more (%)
Housing units in structures - Mobile home (%)
Housing units in structures - Boat, RV, van, etc. (%)
Housing units in structures - Owners - 1, detached (%)
Housing units in structures - Owners - 1, attached (%)
Housing units in structures - Owners - 2 (%)
Housing units in structures - Owners - 3 or 4 (%)
Housing units in structures - Owners - 5 to 9 (%)
Housing units in structures - Owners - 10 to 19 (%)
Housing units in structures - Owners - 20 to 49 (%)
Housing units in structures - Owners - 50 or more (%)
Housing units in structures - Owners - Mobile home (%)
Housing units in structures - Owners - Boat, RV, van, etc. (%)
Housing units in structures - Renters - 1, detached (%)
Housing units in structures - Renters - 1, attached (%)
Housing units in structures - Renters - 2 (%)
Housing units in structures - Renters - 3 or 4 (%)
Housing units in structures - Renters - 5 to 9 (%)
Housing units in structures - Renters - 10 to 19 (%)
Housing units in structures - Renters - 20 to 49 (%)
Housing units in structures - Renters - 50 or more (%)
Housing units in structures - Renters - Mobile home (%)
Housing units in structures - Renters - Boat, RV, van, etc. (%)
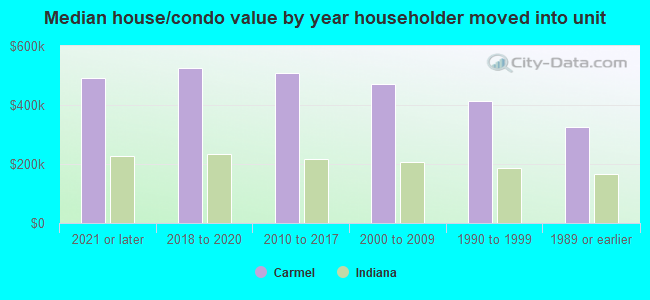
House/condo owner moved in on average (years ago)
Renter moved in on average (years ago)
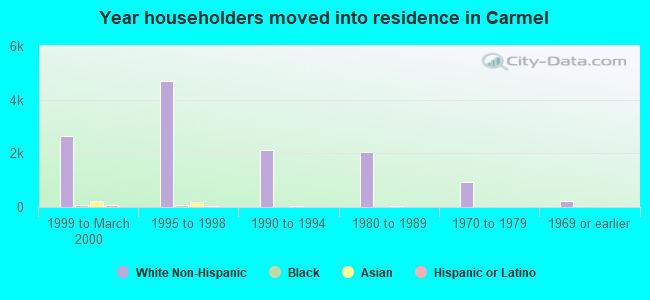
Year householder moved into unit - Moved in 1999 to March 2000 (%)
Year householder moved into unit - Moved in 1999 to March 2000 (%) - White
Year householder moved into unit - Moved in 1999 to March 2000 (%) - Black or African American
Year householder moved into unit - Moved in 1999 to March 2000 (%) - Asian
Year householder moved into unit - Moved in 1999 to March 2000 (%) - Hispanic or Latino
Year householder moved into unit - Moved in 1999 to March 2000 (%) - American Indian and Alaska Native
Year householder moved into unit - Moved in 1999 to March 2000 (%) - Multirace
Year householder moved into unit - Moved in 1999 to March 2000 (%) - Other Race
Year householder moved into unit - Moved in 1995 to 1998 (%)
Year householder moved into unit - Moved in 1995 to 1998 (%) - White
Year householder moved into unit - Moved in 1995 to 1998 (%) - Black or African American
Year householder moved into unit - Moved in 1995 to 1998 (%) - Asian
Year householder moved into unit - Moved in 1995 to 1998 (%) - Hispanic or Latino
Year householder moved into unit - Moved in 1995 to 1998 (%) - American Indian and Alaska Native
Year householder moved into unit - Moved in 1995 to 1998 (%) - Multirace
Year householder moved into unit - Moved in 1995 to 1998 (%) - Other Race
Year householder moved into unit - Moved in 1990 to 1994 (%)
Year householder moved into unit - Moved in 1990 to 1994 (%) - White
Year householder moved into unit - Moved in 1990 to 1994 (%) - Black or African American
Year householder moved into unit - Moved in 1990 to 1994 (%) - Asian
Year householder moved into unit - Moved in 1990 to 1994 (%) - Hispanic or Latino
Year householder moved into unit - Moved in 1990 to 1994 (%) - American Indian and Alaska Native
Year householder moved into unit - Moved in 1990 to 1994 (%) - Multirace
Year householder moved into unit - Moved in 1990 to 1994 (%) - Other Race
Year householder moved into unit - Moved in 1980 to 1989 (%)
Year householder moved into unit - Moved in 1980 to 1989 (%) - White
Year householder moved into unit - Moved in 1980 to 1989 (%) - Black or African American
Year householder moved into unit - Moved in 1980 to 1989 (%) - Asian
Year householder moved into unit - Moved in 1980 to 1989 (%) - Hispanic or Latino
Year householder moved into unit - Moved in 1980 to 1989 (%) - American Indian and Alaska Native
Year householder moved into unit - Moved in 1980 to 1989 (%) - Multirace
Year householder moved into unit - Moved in 1980 to 1989 (%) - Other Race
Year householder moved into unit - Moved in 1970 to 1979 (%)
Year householder moved into unit - Moved in 1970 to 1979 (%) - White
Year householder moved into unit - Moved in 1970 to 1979 (%) - Black or African American
Year householder moved into unit - Moved in 1970 to 1979 (%) - Asian
Year householder moved into unit - Moved in 1970 to 1979 (%) - Hispanic or Latino
Year householder moved into unit - Moved in 1970 to 1979 (%) - American Indian and Alaska Native
Year householder moved into unit - Moved in 1970 to 1979 (%) - Multirace
Year householder moved into unit - Moved in 1970 to 1979 (%) - Other Race
Year householder moved into unit - Moved in 1969 or earlier (%)
Year householder moved into unit - Moved in 1969 or earlier (%) - White
Year householder moved into unit - Moved in 1969 or earlier (%) - Black or African American
Year householder moved into unit - Moved in 1969 or earlier (%) - Asian
Year householder moved into unit - Moved in 1969 or earlier (%) - Hispanic or Latino
Year householder moved into unit - Moved in 1969 or earlier (%) - American Indian and Alaska Native
Year householder moved into unit - Moved in 1969 or earlier (%) - Multirace
Year householder moved into unit - Moved in 1969 or earlier (%) - Other Race
Housing units lacking complete plumbing facilities (%)
Housing units lacking complete kitchen facilities (%)
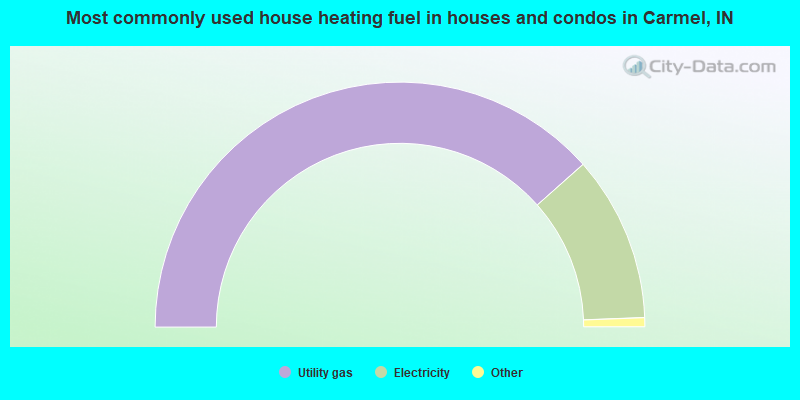
House heating fuel used in houses and condos - Utility gas (%)
House heating fuel used in houses and condos - Bottled, tank, or LP gas (%)
House heating fuel used in houses and condos - Electricity (%)
House heating fuel used in houses and condos - Fuel oil, kerosene, etc. (%)
House heating fuel used in houses and condos - Coal or coke (%)
House heating fuel used in houses and condos - Wood (%)
House heating fuel used in houses and condos - Solar energy (%)
House heating fuel used in houses and condos - Other fuel (%)
House heating fuel used in houses and condos - No fuel used (%)
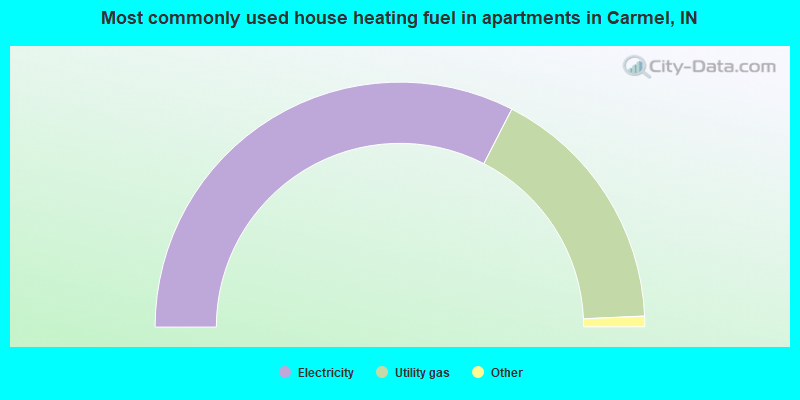
House heating fuel used in apartments - Utility gas (%)
House heating fuel used in apartments - Bottled, tank, or LP gas (%)
House heating fuel used in apartments - Electricity (%)
House heating fuel used in apartments - Fuel oil, kerosene, etc. (%)
House heating fuel used in apartments - Coal or coke (%)
House heating fuel used in apartments - Wood (%)
House heating fuel used in apartments - Solar energy (%)
House heating fuel used in apartments - Other fuel (%)
House heating fuel used in apartments - No fuel used (%)
Latest news about housing in Carmel, IN collected exclusively by city-data.com from local newspapers, TV, and radio stations
Median year house/condo built: 1994Median year apartment built: 2003Household type by relationship:
Households: 101,286
Male householders: 21,217 (3,363 living alone ), Female householders: 17,340 (5,280 living alone )23,619 spouses (23,559 opposite-sex spouses ), 1,338 unmarried partners , (1,338 opposite-sex unmarried partners ), 32,285 children (30,482 natural , 945 adopted , 858 stepchildren ), 238 grandchildren , 991 brothers or sisters , 1,227 parents , 131 foster children , 677 other relatives , 1,700 non-relatives In group quarters: 523
Size of family households: 12,707 2-persons , 6,213 3-persons , 4,908 4-persons , 3,318 5-persons , 401 6-persons , 171 7-or-more-persons .
Size of nonfamily households: 8,643 1-person , 2,035 2-persons , 105 3-persons , 56 4-persons .
20,834 married couples with children. single-parent households (361 men , 2,828 women ).
83.8% of residents of Carmel speak English at home. of residents speak Spanish at home (72% speak English very well , 18% speak English well , 7% speak English not well , 3% don't speak English at all ).of residents speak other Indo-European language at home (82% speak English very well , 13% speak English well , 5% speak English not well , 1% don't speak English at all ).of residents speak Asian or Pacific Island language at home (71% speak English very well , 18% speak English well , 9% speak English not well , 1% don't speak English at all ).of residents speak other language at home (67% speak English very well , 22% speak English well , 8% speak English not well , 3% don't speak English at all ).
Foreign born population: 13,393 (13.2%)of them are naturalized citizens )
Median number of rooms in houses and condos:
Median number of rooms in apartments
Owner-occupied Renter-occupied
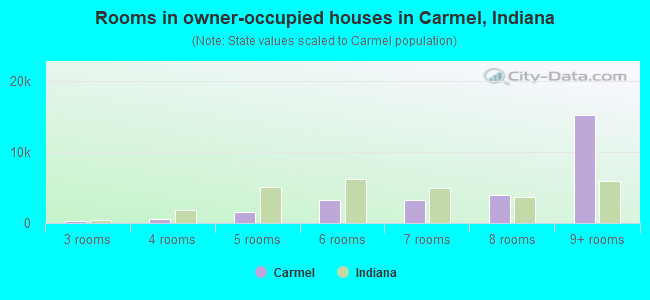
Rooms in owner-occupied houses in Carmel, Indiana
0 1 room 0 2 rooms 295 3 rooms 573 4 rooms 1,607 5 rooms 3,296 6 rooms 3,288 7 rooms 3,914 8 rooms 15,212 9+ rooms
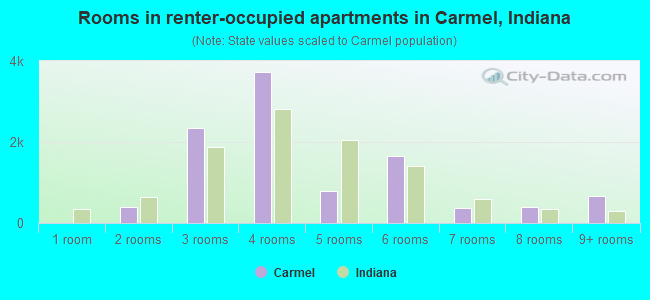
Rooms in renter-occupied apartments in Carmel, Indiana
9 1 room 400 2 rooms 2,350 3 rooms 3,729 4 rooms 780 5 rooms 1,663 6 rooms 367 7 rooms 403 8 rooms 671 9+ rooms
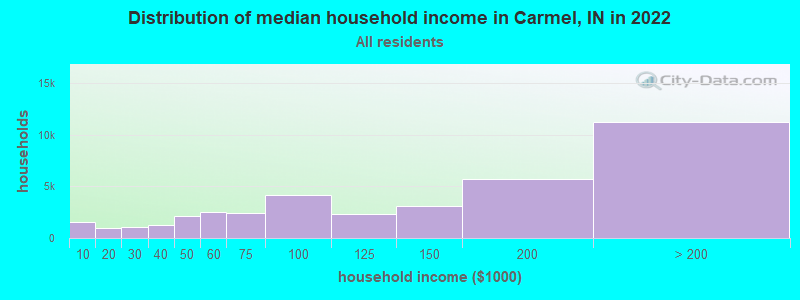
Carmel, IN household income distribution 1,533 Less than $10,000978 $10,000 to $19,9991,034 $20,000 to $29,9991,291 $30,000 to $39,9992,174 $40,000 to $49,9992,516 $50,000 to $59,9992,455 $60,000 to $74,9994,212 $75,000 to $99,9992,341 $100,000 to $124,9993,123 $125,000 to $149,9995,668 $150,000 to $199,99911,232 $200,000 or more
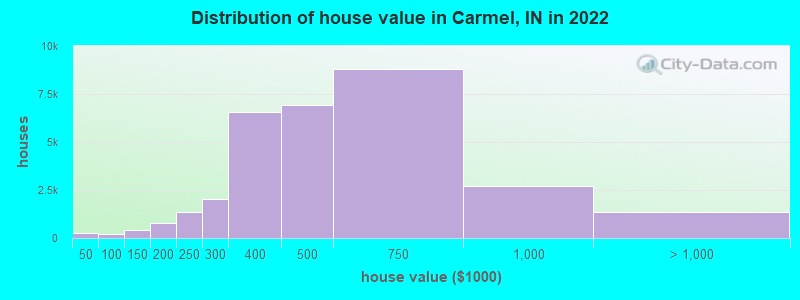
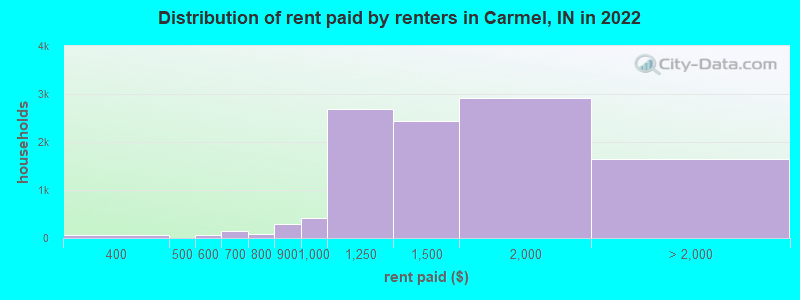
Home value of owner - occupied houses in 2022 in Carmel, IN 84 Less than $10,00014 $15,000 to $19,99947 $20,000 to $24,99916 $25,000 to $29,99947 $35,000 to $39,99946 $40,000 to $49,99942 $50,000 to $59,9996 $60,000 to $69,9996 $70,000 to $79,99937 $80,000 to $89,99978 $90,000 to $99,999241 $100,000 to $124,999150 $125,000 to $149,999341 $150,000 to $174,999461 $175,000 to $199,9991,362 $200,000 to $249,9992,036 $250,000 to $299,9996,579 $300,000 to $399,9996,920 $400,000 to $499,9998,803 $500,000 to $749,9992,707 $750,000 to $999,999865 $1,000,000 to $1,499,999303 $1,500,000 to $1,999,999161 $2,000,000 or moreRent paid by renters in 2022 in Carmel, IN 8 $100 to $1499 $150 to $1996 $250 to $29951 $300 to $34915 $350 to $3996 $450 to $49939 $500 to $54932 $550 to $59995 $600 to $64949 $650 to $69958 $700 to $74922 $750 to $799300 $800 to $899424 $900 to $9992,679 $1,000 to $1,2492,435 $1,250 to $1,4992,927 $1,500 to $1,999601 $2,000 to $2,499586 $2,500 to $2,99981 $3,000 to $3,499227 $3,500 or more149 No cash rent
Percentage of workers working in this county: 60.2%Number of people working at home: 12,921 (23.4% of all workers )
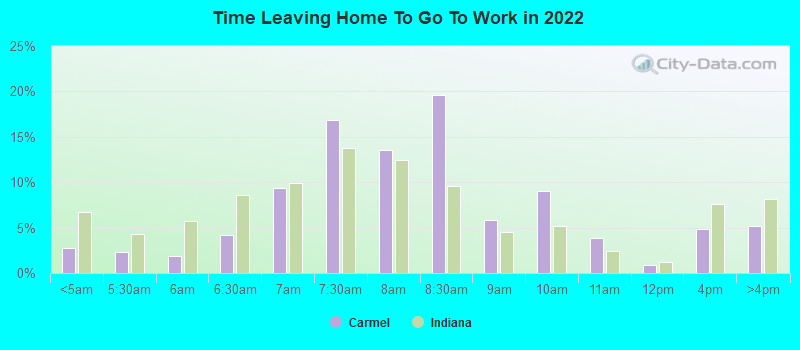
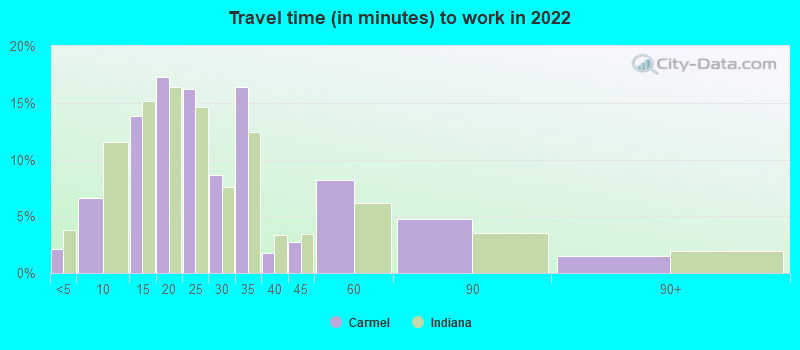
Travel time to work (commute)
Less than 5 minutes: 1,3285 to 9 minutes: 3,60310 to 14 minutes: 5,87015 to 19 minutes: 6,07620 to 24 minutes: 4,94425 to 29 minutes: 3,60730 to 34 minutes: 4,64735 to 39 minutes: 1,03640 to 44 minutes: 2,83845 to 59 minutes: 2,55460 to 89 minutes: 1,07690 or more minutes: 943
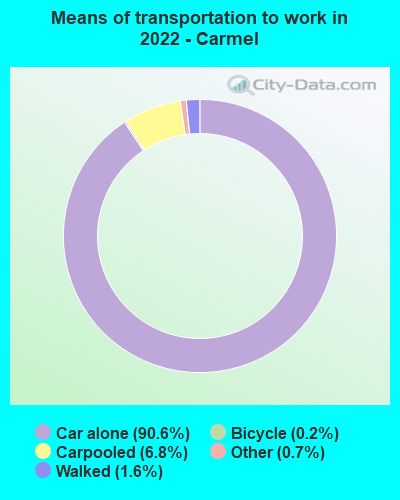
Means of transportation to work:
Drove a car alone: 47,149 (70.1%)Carpooled: 5,010 (7.4%)Bus : 42 (0.1%)Ferryboat: 15 (0.0%)Taxi: 510 (0.8%)Bicycle: 189 (0.3%)Walked: 786 (1.2%)Worked at home: 12,921 (19.2%)
Unemployment by race in 2022
Unemployment rate for White non-Hispanic residents 1.4% Males1.7% FemalesUnemployment rate for Black residents 2.2% Males4.4% FemalesUnemployment rate for Asian residents 3.4% Males2.9% FemalesUnemployment rate for two or more race residents 1.2% Males2.0% FemalesUnemployment rate for Hispanic or Latino residents 0.9% Males1.6% Females
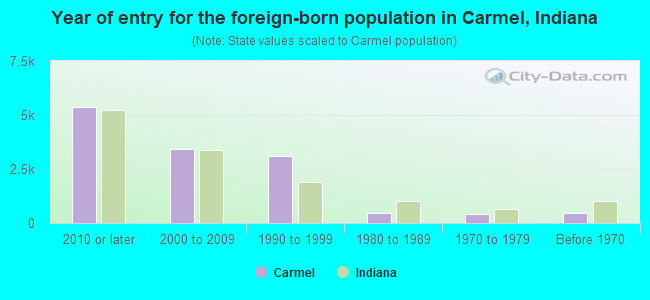
Year of entry for the foreign-born population in Carmel, Indiana
5,366 2010 or later 3,404 2000 to 2009 3,101 1990 to 1999 478 1980 to 1989 402 1970 to 1979 446 Before 1970
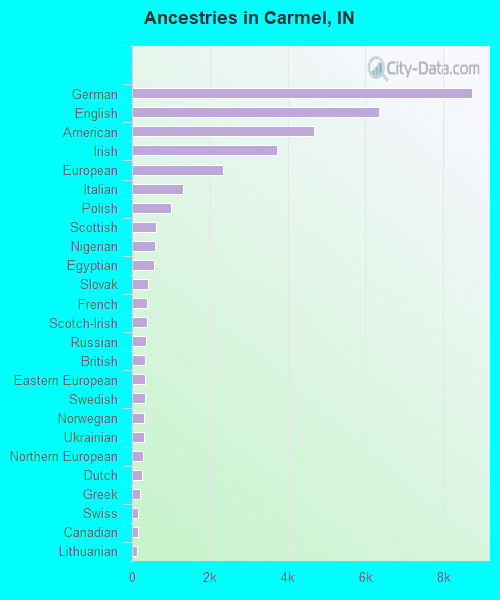
First ancestries reported:
German: 8,744 (16.8%)
English: 6,356 (12.2%)
American: 4,673 (9.0%)
Irish: 3,725 (7.1%)
European: 2,345 (4.5%)
Italian: 1,307 (2.5%)
Polish: 992 (1.9%)
Scottish: 608 (1.2%)
Nigerian: 581 (1.1%)
Egyptian: 573 (1.1%)
Slovak: 409 (0.8%)
French: 398 (0.8%)
Scotch-Irish: 387 (0.7%)
Russian: 367 (0.7%)
British: 345 (0.7%)
Eastern European: 329 (0.6%)
Swedish: 323 (0.6%)
Norwegian: 308 (0.6%)
Ukrainian: 297 (0.6%)
Northern European: 278 (0.5%)
Dutch: 262 (0.5%)
Greek: 216 (0.4%)
Swiss: 161 (0.3%)
Canadian: 151 (0.3%)
Lithuanian: 133 (0.3%)
Portuguese: 128 (0.2%)
Serbian: 123 (0.2%)
Hungarian: 122 (0.2%)
French Canadian: 114 (0.2%)
Scandinavian: 94 (0.2%)
Czechoslovakian: 88 (0.2%)
African: 87 (0.2%)
Latvian: 75 (0.1%)
Lebanese: 72 (0.1%)
Jordanian: 72 (0.1%)
Turkish: 70 (0.1%)
Welsh: 61 (0.1%)
Somali: 59 (0.1%)
Brazilian: 57 (0.1%)
Sierra Leonean: 49 (0.09%)
Palestinian: 48 (0.09%)
Iraqi: 45 (0.09%)
Austrian: 38 (0.07%)
Danish: 37 (0.07%)
Czech: 36 (0.07%)
Slovene: 36 (0.07%)
Haitian: 35 (0.07%)
Armenian: 25 (0.05%)
Romanian: 25 (0.05%)
Macedonian: 22 (0.04%)
Croatian: 21 (0.04%)
South African: 21 (0.04%)
Belgian: 15 (0.03%)
Iranian: 14 (0.03%)
Bulgarian: 14 (0.03%)
Slavic: 12 (0.02%)
Assyrian: 10 (0.02%)
Australian: 9 (0.02%)
Pennsylvania German: 9 (0.02%)
Alsatian: 9 (0.02%)
Icelander: 6 (0.01%)
Most common places of birth for foreign-born residents (%): India Carmel:
22.4% (3,221)Indiana:
8.5% (32,127)
China, excluding Hong Kong and Taiwan Carmel:
14.3% (2,056)Indiana:
5.3% (19,877)
Egypt Carmel:
4.6% (654)Indiana:
0.6% (2,303)
Canada Carmel:
3.7% (529)Indiana:
2.1% (7,834)
Nigeria Carmel:
3.6% (515)Indiana:
3.3% (12,337)
Mexico Carmel:
3.4% (494)Indiana:
27.0% (101,996)
Venezuela Carmel:
3.4% (488)Indiana:
1.8% (6,718)
Korea Carmel:
2.5% (359)Indiana:
2.0% (7,653)
Taiwan Carmel:
2.3% (337)Indiana:
0.6% (2,272)
England Carmel:
2.3% (324)Indiana:
0.8% (2,847)
Russia Carmel:
2.1% (308)Indiana:
0.9% (3,307)
Colombia Carmel:
2.1% (303)Indiana:
0.8% (3,114)
Germany Carmel:
2.0% (281)Indiana:
1.7% (6,439)
Brazil Carmel:
1.7% (248)Indiana:
0.7% (2,626)
Place of birth for U.S.-born residents:
This state: 49,822Other state: 36,685Northeast: 6,136Midwest: 18,188South: 8,506West: 3,855 88.1% of Carmel residents lived in the same house 1 years ago.
Out of people who lived in different houses, 23.1% lived in this county.
Out of people who lived in different counties, 44.6% lived in Indiana.
Carmel:
88.1%State average:
87.1%
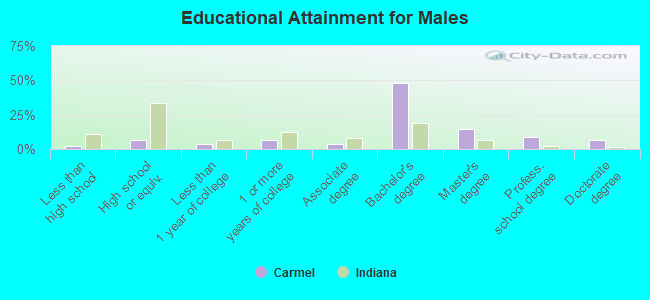
Education attainment for males 25 years and older:
No schooling: 289Nursery to 4th grade: 1185th and 6th grade: 07th and 8th grade: 809th grade: 21010th grade: 011th grade: 012th grade, no diploma: 60High school graduate (or equivalency): 2,039Less than 1 year of college: 1,152Some college more than 1 year, no degree: 2,201Associate degree: 1,075Bachelor's degree: 15,615Master's degree: 4,622Professional school degree: 2,871Doctorate degree: 2,071
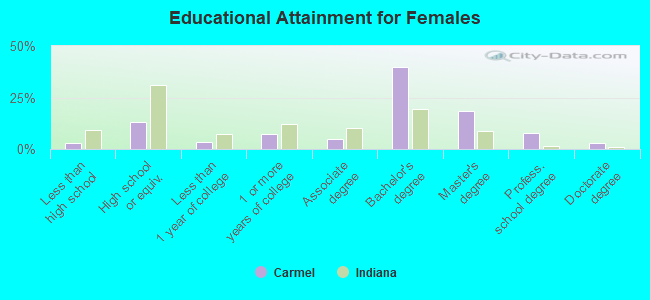
Education attainment for females 25 years and older:
No schooling: 204Nursery to 4th grade: 3545th and 6th grade: 07th and 8th grade: 09th grade: 7810th grade: 13911th grade: 012th grade, no diploma: 221High school graduate (or equivalency): 4,555Less than 1 year of college: 1,101Some college more than 1 year, no degree: 2,456Associate degree: 1,776Bachelor's degree: 13,849Master's degree: 6,482Professional school degree: 2,679Doctorate degree: 992
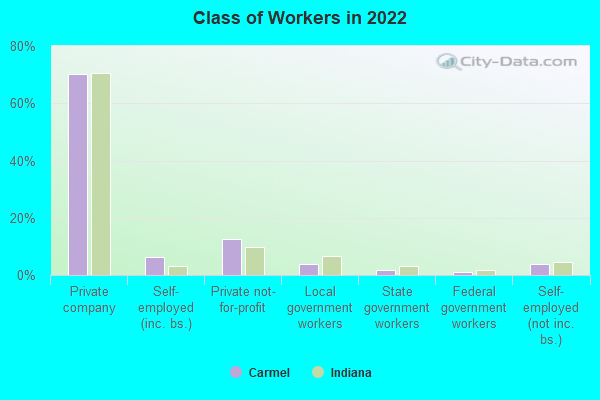
Housing units in structures:
One, detached: 28,351One, attached: 2,139Two: 1303 or 4: 1,6825 to 9: 3,34510 to 19: 1,89720 to 49: 95650 or more: 2,675Mobile homes: 281Housing units lacking complete plumbing facilities in 2022: 0.2%Housing units lacking complete kitchen facilities in 2022: 0.7%House/condo owner moved in on average 10 years ago
Renter moved in on average 1 years ago
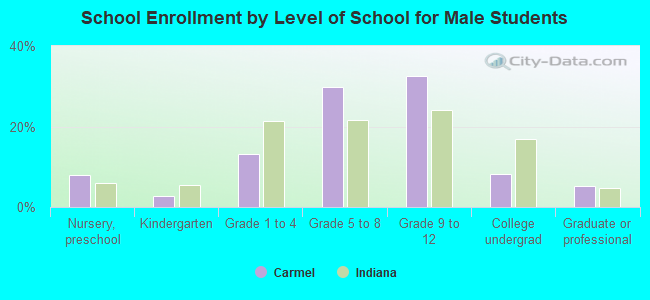
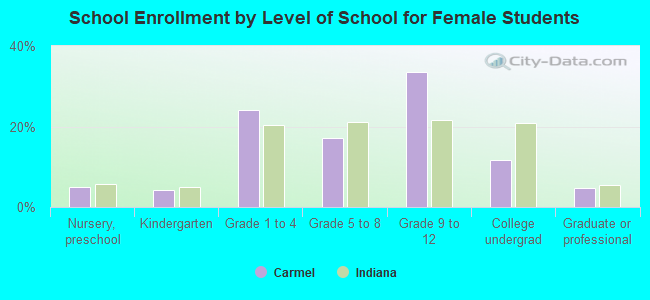
Private vs. public school enrollment:
Students in private schools in grades 1 to 8 (elementary and middle school): 1,829 Students in private schools in grades 9 to 12 (high school): 1,498 Students in private undergraduate colleges: 818