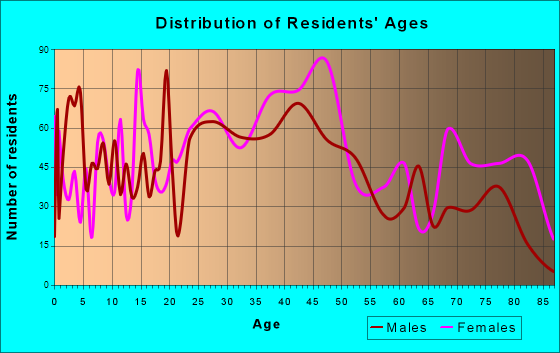
Carnegie, PA (Pennsylvania) Houses and Residents
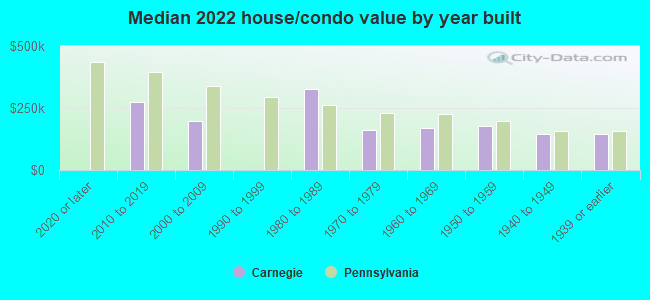
| Carnegie: | $176,075 |
| Pennsylvania: | $245,500 |
Mean price in 2022:
Detached houses: $177,513
Here: $177,513 State: $317,202 Townhouses or other attached units: $219,225
Here: $219,225 State: $254,369 In 2-unit structures: $148,563
Here: $148,563 State: $249,182
Total population: 7,912 (All urban)
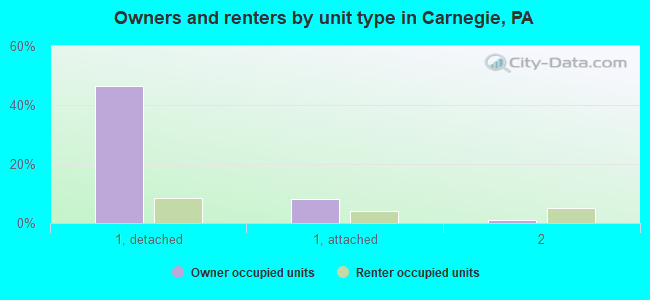
Houses: 4,506 (4,096 occupied: 2,265 owner occupied, 1,759 renter occupied)
| % of renters here: | 44% |
| State: | 31% |
Housing density: 2,727 houses/condos per square mile
Median price asked for vacant for-sale houses and condos in 2022: $288,148.
Median contract rent in 2022: $717 (lower quartile is $508, upper quartile is $906)
Median rent asked for vacant for-rent units in 2022: $671
Median gross rent in Carnegie, PA in 2022: $833
Housing units in Carnegie with a mortgage: 1,523 (178 second mortgage, 5 home equity loan, 111 both second mortgage and home equity loan)
Houses without a mortgage: 150
Median household income for houses/condos with a mortgage: $91,098
Median household income for apartments without a mortgage: $62,934
Median monthly housing costs: $1,002
Compare current foreclosures near Carnegie, PA:
| Photo | Address | Area | Beds / Baths | Price | Details |
|---|---|---|---|---|---|

|
#1
Grant St
Carnegie, PA 15106
|
1,345 sq. feet
|
2 baths 4 beds |
$225,500
|
show details |

|
#2
Chartiers Ave
Carnegie, PA 15106
|
1,700 sq. feet
|
2 baths 4 beds |
show details | |

|
#3
Morrow Ave
Carnegie, PA 15106
|
1,296 sq. feet
|
1 baths 3 beds |
show details | |

|
#4
Noblestown Rd
Carnegie, PA 15106
|
1,420 sq. feet
|
2 baths 3 beds |
show details | |

|
#5
2nd Ave
Carnegie, PA 15106
|
2,035 sq. feet
|
3 baths 3 beds |
show details | |

|
#6
3rd Ave
Carnegie, PA 15106
|
1,620 sq. feet
|
2 baths 3 beds |
show details | |

|
#7
Walnut St
Carnegie, PA 15106
|
1,606 sq. feet
|
2 baths 2 beds |
show details | |

|
#8
Carothers Ave
Carnegie, PA 15106
|
1,785 sq. feet
|
3 baths 3 beds |
show details | |

|
#9
5th Ave
Carnegie, PA 15106
|
2,282 sq. feet
|
2 baths 4 beds |
show details | |

|
#10
Lindsay Rd
Carnegie, PA 15106
|
758 sq. feet
|
1 baths 3 beds |
show details |
| Photo | Address | Area | Beds / Baths | Price | Details |
|---|---|---|---|---|---|

|
#11
Lincoln Ave
Carnegie, PA 15106
|
893 sq. feet
|
1 baths 2 beds |
show details | |

|
#12
Noblestown Rd
Carnegie, PA 15106
|
2,017 sq. feet
|
2 baths 3 beds |
show details | |

|
#13
Lindsay Rd
Carnegie, PA 15106
|
1,118 sq. feet
|
1 baths 3 beds |
show details | |

|
#14
Carothers Ave
Carnegie, PA 15106
|
- sq. feet
|
- baths - beds |
show details | |

|
#15
Freedom Dr
Carnegie, PA 15106
|
- sq. feet
|
- baths - beds |
show details | |

|
#16
Bluff St
Carnegie, PA 15106
|
- sq. feet
|
- baths - beds |
show details | |

|
#17
Federal Ave
Carnegie, PA 15106
|
- sq. feet
|
- baths - beds |
show details | |

|
#18
Patriot Dr
Carnegie, PA 15106
|
- sq. feet
|
- baths - beds |
show details | |

|
#19
Lexington Ct
Carnegie, PA 15106
|
- sq. feet
|
- baths - beds |
show details | |

|
#20
Punta Gorda St
East Mc Keesport, PA 15035
|
1,200 sq. feet
|
1 baths 3 beds |
$171,500
|
show details |
| Photo | Address | Area | Beds / Baths | Price | Details |
|---|---|---|---|---|---|

|
#21
Kirk Ave
Pittsburgh, PA 15227
|
1,500 sq. feet
|
2 baths 3 beds |
$207,500
|
show details |

|
#22
Shady Ln
Aliquippa, PA 15001
|
1,440 sq. feet
|
2 baths 3 beds |
$169,900
|
show details |

|
#23
Venetia Rd
Venetia, PA 15367
|
1,098 sq. feet
|
2 baths 3 beds |
$236,500
|
show details |

|
#24
9th Ave
Elizabeth, PA 15037
|
1,554 sq. feet
|
1 baths 3 beds |
$180,000
|
show details |

|
#25
Olga St
Ambridge, PA 15003
|
2,629 sq. feet
|
2 baths 4 beds |
$144,900
|
show details |

|
#26
Muirfield Dr
Presto, PA 15142
|
4,801 sq. feet
|
4 baths 5 beds |
$749,500
|
show details |

|
#27
Joan Dr
Pittsburgh, PA 15235
|
1,725 sq. feet
|
2 baths 3 beds |
$219,900
|
show details |

|
#28
Collins St
Mckeesport, PA 15132
|
1,176 sq. feet
|
1 baths 3 beds |
$43,700
|
show details |

|
#29
Leslie St
East Mc Keesport, PA 15035
|
1,144 sq. feet
|
1 baths 2 beds |
$64,900
|
show details |

|
#30
Triana St
Pittsburgh, PA 15210
|
1,184 sq. feet
|
1 baths 3 beds |
$157,500
|
show details |
| Photo | Address | Area | Beds / Baths | Price | Details |
|---|---|---|---|---|---|

|
#31
Semicir St
Pittsburgh, PA 15214
|
537 sq. feet
|
1 baths 1 beds |
$21,000
|
show details |

|
#32
Dorothy Dr
Pittsburgh, PA 15235
|
956 sq. feet
|
1 baths 3 beds |
$66,500
|
show details |

|
#33
Brinwood Ave
Pittsburgh, PA 15227
|
1,000 sq. feet
|
2 baths 3 beds |
$239,900
|
show details |

|
#34
Noblestown Rd Ste 100
Carnegie, PA 15106
|
- sq. feet
|
- baths - beds |
show details | |

|
#35
Baldwin Rd
Carnegie, PA 15106
|
- sq. feet
|
- baths - beds |
show details | |

|
#36
Lindsay Rd
Carnegie, PA 15106
|
- sq. feet
|
- baths - beds |
show details | |

|
#37
Adams Ave
West Mifflin, PA 15122
|
3,106 sq. feet
|
4 baths 5 beds |
show details | |

|
#38
Catherine St
Mc Kees Rocks, PA 15136
|
2,688 sq. feet
|
2 baths 4 beds |
show details | |

|
#39
Millbridge St
Pittsburgh, PA 15210
|
1,464 sq. feet
|
1 baths 3 beds |
show details | |

|
#40
13th St
Mc Kees Rocks, PA 15136
|
1,404 sq. feet
|
1 baths 3 beds |
show details |
| Photo | Address | Area | Beds / Baths | Price | Details |
|---|---|---|---|---|---|

|
#41
Bluff St
Pittsburgh, PA 15236
|
1,386 sq. feet
|
1 baths 4 beds |
show details | |

|
#42
Dublin Rd
Bethel Park, PA 15102
|
1,184 sq. feet
|
1 baths 3 beds |
show details | |

|
#43
Western Ave
Pittsburgh, PA 15233
|
4,800 sq. feet
|
3 baths 5 beds |
show details | |

|
#44
Orchard Ave
Pittsburgh, PA 15202
|
1,180 sq. feet
|
1 baths 3 beds |
show details | |

|
#45
Fort Duquesne Blvd Apt 4a
Pittsburgh, PA 15222
|
1,032 sq. feet
|
1 baths 1 beds |
show details | |

|
#46
Woodward Ave
Mc Kees Rocks, PA 15136
|
1,958 sq. feet
|
2 baths 4 beds |
show details | |

|
#47
Outlook Dr
West Mifflin, PA 15122
|
1,075 sq. feet
|
1 baths 2 beds |
show details | |

|
#48
Woodward Ave
Mc Kees Rocks, PA 15136
|
1,266 sq. feet
|
1 baths 2 beds |
show details | |

|
#49
Verona Blvd
Pittsburgh, PA 15235
|
1,138 sq. feet
|
1 baths 3 beds |
show details | |

|
Check over 1 million property listings on Foreclosure.com!
|
browse all offers | |||

Latest news about housing in Carnegie, PA collected exclusively by city-data.com from local newspapers, TV, and radio stations

 | Are any of you flipping homes here? (70 replies) |
| Looking to rent a 2 bedroom house in Carnegie (1 reply) |
| New apartments planned on north shore (2 replies) |
| Looking to buy a home, $120K range, commute to downtown (Carnegie, Brookline, Millvale) (19 replies) |
| Renting in East Carnegie (3 replies) |
| Terrain apartments or Maiden Bridge/Canongate apartments?? (5 replies) |
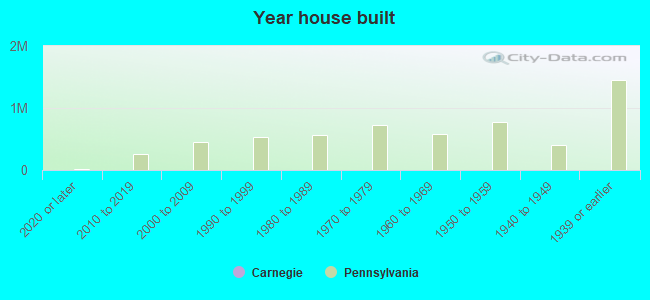
Median year apartment built: 1958
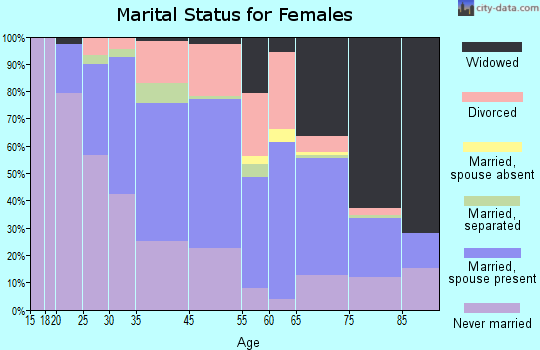
Household type by relationship:
Households: 7,988- Male householders: 1,722 (903 living alone), Female householders: 2,312 (1,053 living alone)
1,278 spouses (1,176 opposite-sex spouses), 207 unmarried partners, (193 opposite-sex unmarried partners), 1,883 children (1,827 natural, 49 adopted, 6 stepchildren), 112 grandchildren, 124 brothers or sisters, 59 parents, 0 foster children, 55 other relatives, 209 non-relatives
- In group quarters: 21
Size of family households: 1,088 2-persons, 315 3-persons, 254 4-persons, 108 5-persons, 39 6-persons.
Size of nonfamily households: 2,008 1-person, 202 2-persons, 30 3-persons.
597 married couples with children.
553 single-parent households (51 men, 502 women).
93.7% of residents of Carnegie speak English at home.
1.0% of residents speak Spanish at home (100% speak English very well).
3.6% of residents speak other Indo-European language at home (77% speak English very well, 9% speak English well, 14% speak English not well).
1.4% of residents speak Asian or Pacific Island language at home (87% speak English very well, 13% speak English well).
Foreign born population: 312 (3.9%)
(38.1% of them are naturalized citizens)
| Here: | 6.2 |
| State: | 6.8 |
| Here: | 4.2 |
| State: | 4.3 |
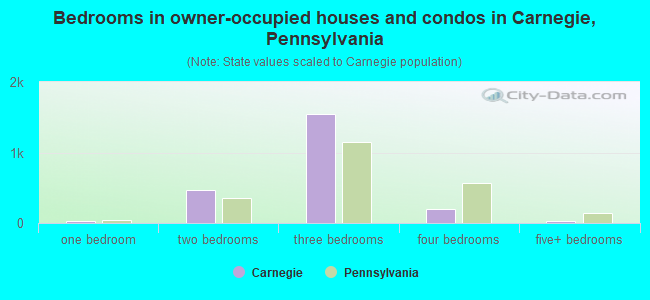
- Bedrooms in owner-occupied houses and condos in Carnegie, Pennsylvania
- 0no bedroom
- 221 bedroom
- 4732 bedrooms
- 1,5413 bedrooms
- 2004 bedrooms
- 305+ bedrooms
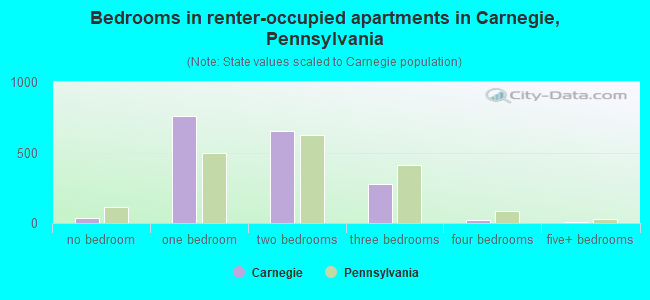
- Bedrooms in renter-occupied apartments in Carnegie, Pennsylvania
- 38no bedroom
- 7621 bedroom
- 6512 bedrooms
- 2763 bedrooms
- 244 bedrooms
- 105+ bedrooms
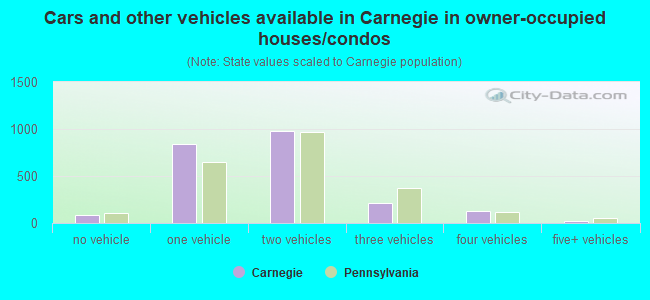
- Cars and other vehicles available in Carnegie in owner-occupied houses/condos
- 85no vehicle
- 8431 vehicle
- 9802 vehicles
- 2093 vehicles
- 1284 vehicles
- 205+ vehicles
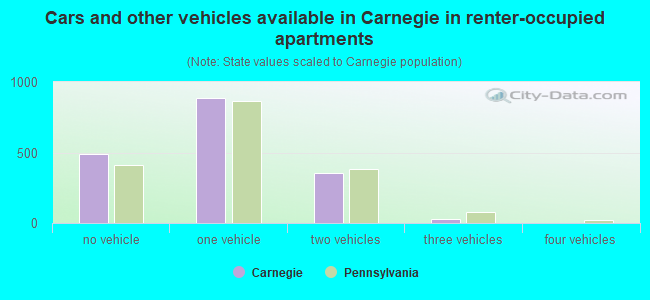
- Cars and other vehicles available in Carnegie in renter-occupied apartments
- 486no vehicle
- 8871 vehicle
- 3562 vehicles
- 313 vehicles
- 04 vehicles
- 05+ vehicles
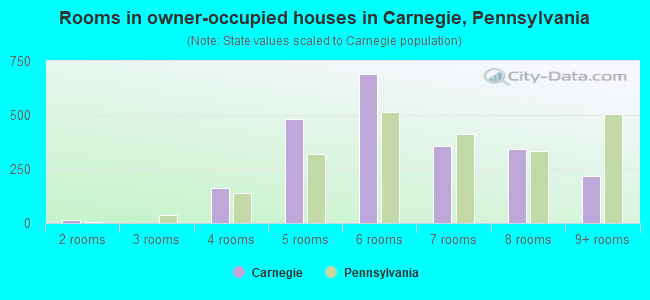
- Rooms in owner-occupied houses in Carnegie, Pennsylvania
- 01 room
- 142 rooms
- 03 rooms
- 1624 rooms
- 4805 rooms
- 6916 rooms
- 3557 rooms
- 3448 rooms
- 2199+ rooms
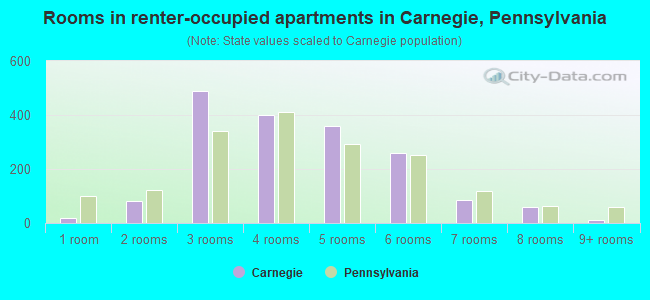
- Rooms in renter-occupied apartments in Carnegie, Pennsylvania
- 191 room
- 812 rooms
- 4893 rooms
- 3994 rooms
- 3585 rooms
- 2596 rooms
- 877 rooms
- 588 rooms
- 109+ rooms
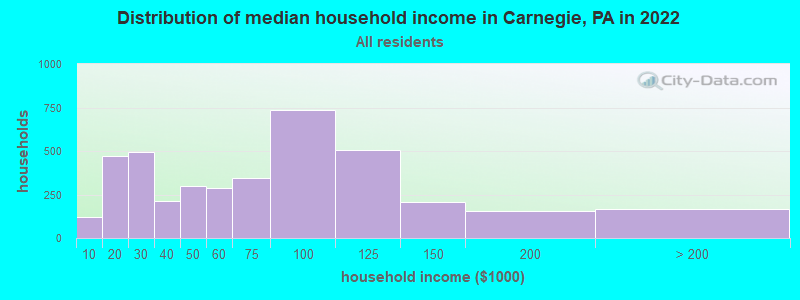
Carnegie, PA household income distribution

- 120Less than $10,000
- 473$10,000 to $19,999
- 493$20,000 to $29,999
- 214$30,000 to $39,999
- 301$40,000 to $49,999
- 287$50,000 to $59,999
- 344$60,000 to $74,999
- 734$75,000 to $99,999
- 505$100,000 to $124,999
- 209$125,000 to $149,999
- 155$150,000 to $199,999
- 166$200,000 or more
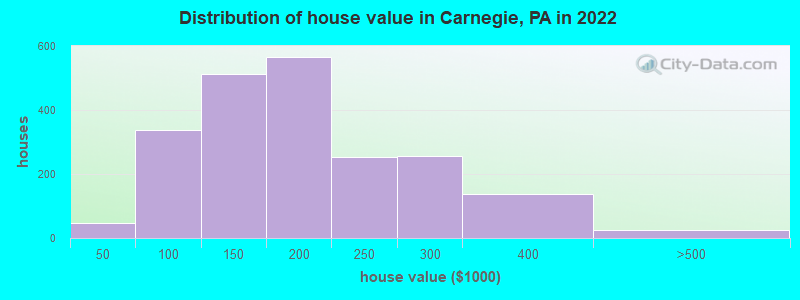
Home value of owner - occupied houses in 2022 in Carnegie, PA
-
- 2$15,000 to $19,999
- 14$20,000 to $24,999
- 7$35,000 to $39,999
- 23$40,000 to $49,999
- 58$50,000 to $59,999
- 65$60,000 to $69,999
- 38$70,000 to $79,999
- 68$80,000 to $89,999
- 80$90,000 to $99,999
- 298$100,000 to $124,999
- 213$125,000 to $149,999
- 265$150,000 to $174,999
- 301$175,000 to $199,999
- 251$200,000 to $249,999
- 255$250,000 to $299,999
- 138$300,000 to $399,999
- 24$400,000 to $499,999
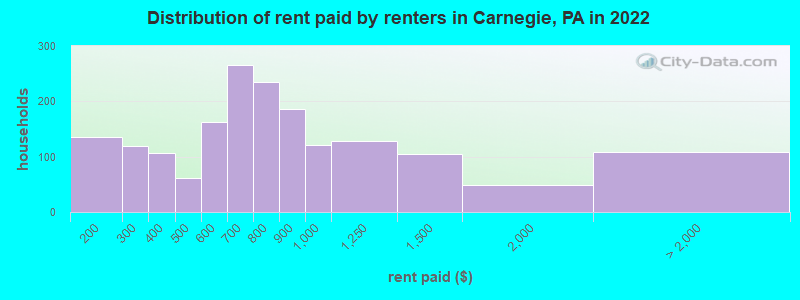
Rent paid by renters in 2022 in Carnegie, PA
-
- 10$100 to $149
- 124$150 to $199
- 78$200 to $249
- 40$250 to $299
- 74$300 to $349
- 32$350 to $399
- 47$400 to $449
- 14$450 to $499
- 112$500 to $549
- 49$550 to $599
- 170$600 to $649
- 95$650 to $699
- 102$700 to $749
- 131$750 to $799
- 186$800 to $899
- 121$900 to $999
- 129$1,000 to $1,249
- 103$1,250 to $1,499
- 48$1,500 to $1,999
- 11$2,000 to $2,499
- 97No cash rent
Percentage of workers working in this county: 95.4%
Number of people working at home: 1,091 (23.1% of all workers)
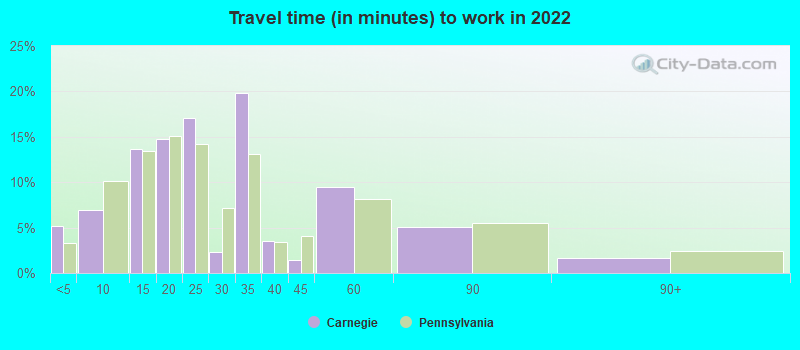
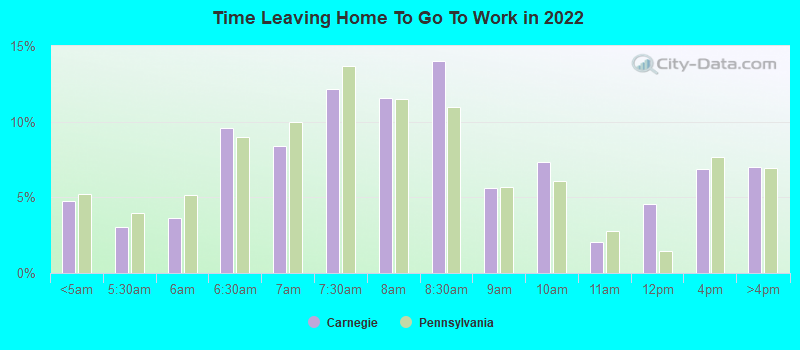
Travel time to work (commute)
- Less than 5 minutes: 60
- 5 to 9 minutes: 352
- 10 to 14 minutes: 547
- 15 to 19 minutes: 660
- 20 to 24 minutes: 469
- 25 to 29 minutes: 228
- 30 to 34 minutes: 628
- 35 to 39 minutes: 157
- 40 to 44 minutes: 165
- 45 to 59 minutes: 200
- 60 to 89 minutes: 136
- 90 or more minutes: 56
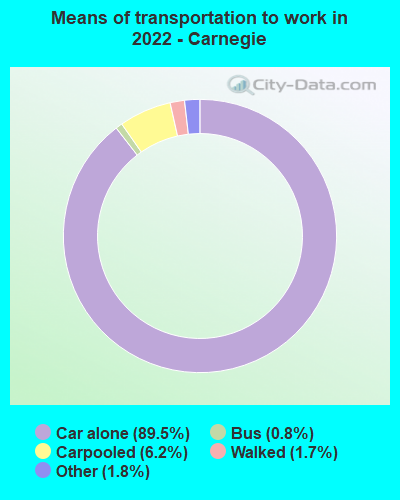
Means of transportation to work:
- Drove a car alone: 2,683 (68.1%)
- Carpooled: 180 (4.6%)
- Bus: 17 (0.4%)
- Taxi: 62 (1.6%)
- Walked: 52 (1.3%)
- Worked at home: 1,091 (27.7%)
- Unemployment by race in 2022
- Unemployment rate for White non-Hispanic residents
- 3.5%Males
- 0.7%Females
- Unemployment rate for Black residents
- 4.8%Males
- 3.0%Females
- Unemployment rate for two or more race residents
- 9.0%Males
- 18.8%Females
- Unemployment rate for Hispanic or Latino residents
- 5.2%Males
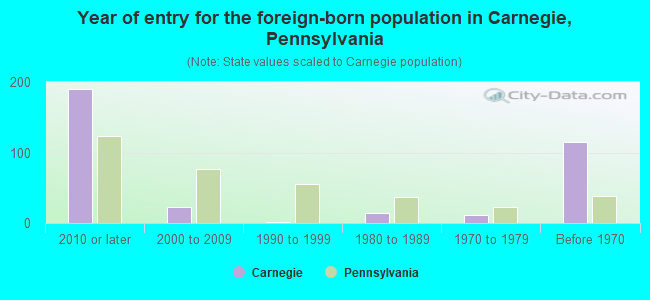
- Year of entry for the foreign-born population in Carnegie, Pennsylvania
- 1902010 or later
- 222000 to 2009
- 11990 to 1999
- 141980 to 1989
- 111970 to 1979
- 115Before 1970
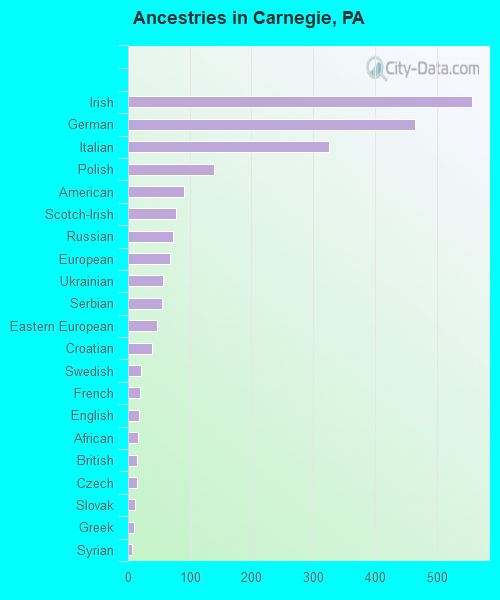
First ancestries reported:
- Irish: 557 (18.0%)
- German: 465 (15.0%)
- Italian: 325 (10.5%)
- Polish: 139 (4.5%)
- American: 91 (2.9%)
- Scotch-Irish: 78 (2.5%)
- Russian: 73 (2.4%)
- European: 68 (2.2%)
- Ukrainian: 56 (1.8%)
- Serbian: 55 (1.8%)
- Eastern European: 47 (1.5%)
- Croatian: 39 (1.3%)
- Swedish: 21 (0.7%)
- French: 19 (0.6%)
- English: 18 (0.6%)
- African: 16 (0.5%)
- British: 15 (0.5%)
- Czech: 15 (0.5%)
- Slovak: 12 (0.4%)
- Greek: 9 (0.3%)
- Syrian: 6 (0.2%)
- Czechoslovakian: 5 (0.2%)
- Scandinavian: 3 (0.10%)
Most common places of birth for foreign-born residents (%):
| Carnegie: | 42.2% (148) |
| Pennsylvania: | 10.7% (100,596) |
| Carnegie: | 10.0% (35) |
| Pennsylvania: | 1.8% (16,884) |
| Carnegie: | 7.4% (26) |
| Pennsylvania: | 2.1% (19,841) |
| Carnegie: | 6.6% (23) |
| Pennsylvania: | 0.5% (5,121) |
| Carnegie: | 4.8% (17) |
| Pennsylvania: | 1.4% (13,268) |
| Carnegie: | 4.0% (14) |
| Pennsylvania: | 0.6% (5,479) |
| Carnegie: | 3.1% (11) |
| Pennsylvania: | 0.5% (4,424) |
| Carnegie: | 3.1% (11) |
| Pennsylvania: | 1.0% (9,205) |
| Carnegie: | 2.3% (8) |
| Pennsylvania: | 1.9% (18,065) |
| Carnegie: | 2.3% (8) |
| Pennsylvania: | 0.5% (4,593) |
| Carnegie: | 1.7% (6) |
| Pennsylvania: | 1.2% (11,211) |
Place of birth for U.S.-born residents:
- This state: 6,096
- Other state: 1,526
- Northeast: 349
- Midwest: 340
- South: 667
- West: 164
88.6% of Carnegie residents lived in the same house 1 years ago.
Out of people who lived in different houses, 43.1% lived in this county.
Out of people who lived in different counties, 31.5% lived in Pennsylvania.
| Carnegie: | 88.6% |
| State average: | 89.3% |
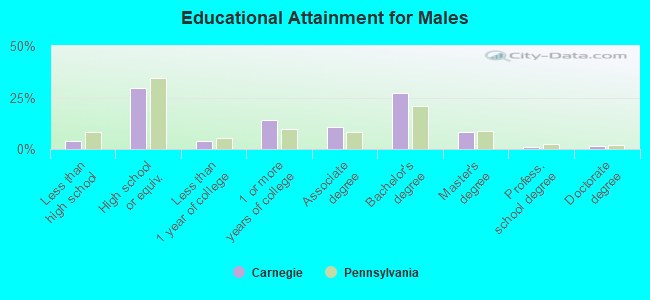
Education attainment for males 25 years and older:
- No schooling: 39
- Nursery to 4th grade: 0
- 5th and 6th grade: 0
- 7th and 8th grade: 36
- 9th grade: 0
- 10th grade: 15
- 11th grade: 12
- 12th grade, no diploma: 12
- High school graduate (or equivalency): 850
- Less than 1 year of college: 108
- Some college more than 1 year, no degree: 412
- Associate degree: 314
- Bachelor's degree: 781
- Master's degree: 237
- Professional school degree: 27
- Doctorate degree: 45
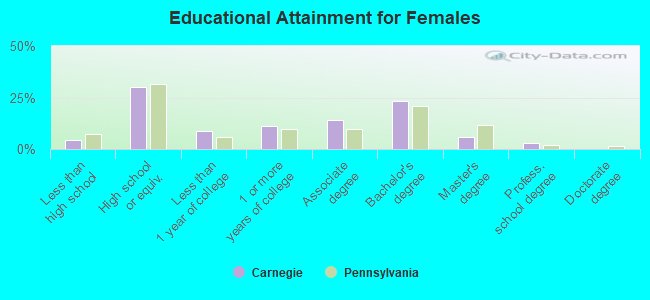
Education attainment for females 25 years and older:
- No schooling: 37
- Nursery to 4th grade: 4
- 5th and 6th grade: 0
- 7th and 8th grade: 15
- 9th grade: 0
- 10th grade: 0
- 11th grade: 39
- 12th grade, no diploma: 49
- High school graduate (or equivalency): 1,004
- Less than 1 year of college: 292
- Some college more than 1 year, no degree: 372
- Associate degree: 464
- Bachelor's degree: 776
- Master's degree: 194
- Professional school degree: 94
- Doctorate degree: 0
Housing units in structures:
- One, detached: 2,357
- One, attached: 558
- Two: 453
- 3 or 4: 241
- 5 to 9: 119
- 10 to 19: 187
- 20 to 49: 91
- 50 or more: 488
- Mobile homes: 9
Housing units lacking complete kitchen facilities in 2022: 4.0%
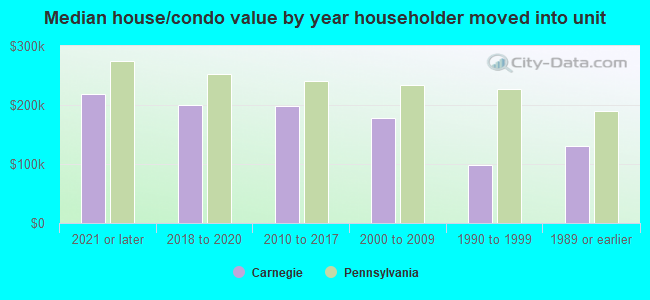
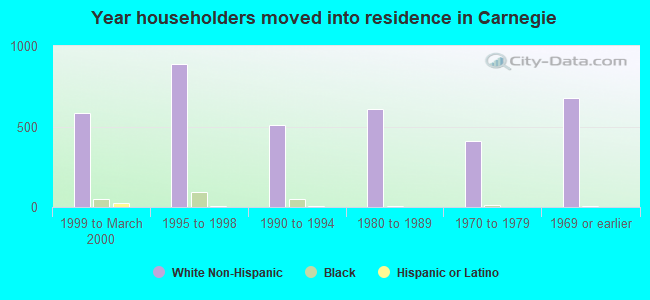
House/condo owner moved in on average 14 years ago
Renter moved in on average 5 years ago
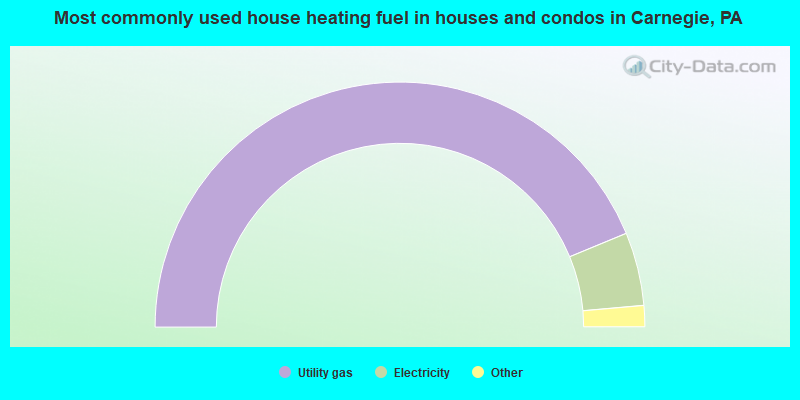
- 87.6%Utility gas
- 9.7%Electricity
- 1.3%Fuel oil, kerosene, etc.
- 0.8%Bottled, tank, or LP gas
- 0.7%Wood
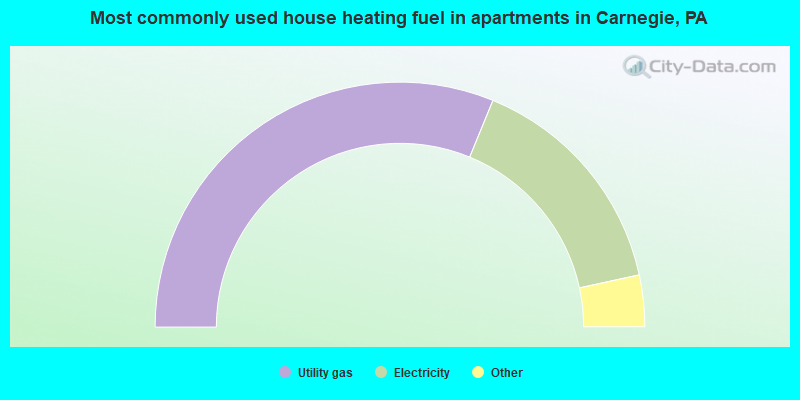
- 62.4%Utility gas
- 30.8%Electricity
- 3.9%Fuel oil, kerosene, etc.
- 2.4%Bottled, tank, or LP gas
- 0.4%Other fuel
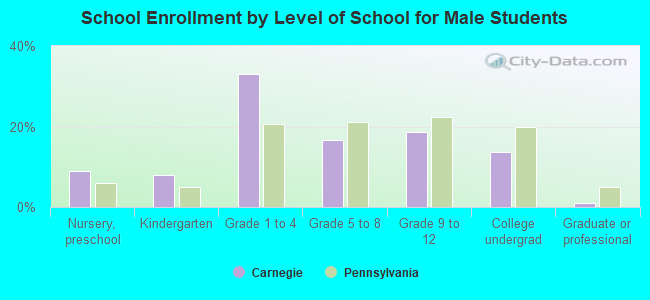
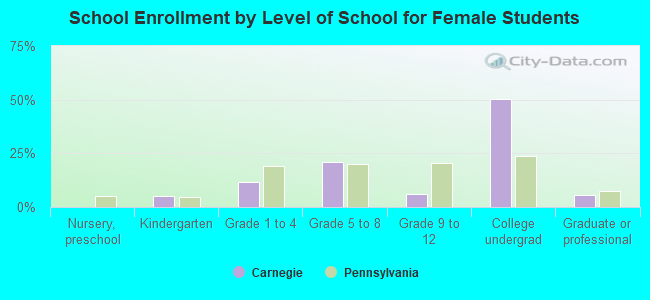
Private vs. public school enrollment:
| Here: | 7.5% |
| Pennsylvania: | 15.7% |
| Here: | 33.8% |
| Pennsylvania: | 13.4% |
| Here: | 2.6% |
| Pennsylvania: | 39.8% |