Carol Stream, IL (Illinois) Houses and Residents
Estimated median house or condo value in 2022: $300,233 (it was $166,200 in 2000 )
Carol Stream:
$300,233Illinois:
$251,600
Lower value quartile - upper value quartile: $242,572 - $372,719Mean price in 2022: Detached houses: $354,071 Here:
$354,071State:
$310,164
Townhouses or other attached units: $225,915 Here:
$225,915State:
$286,230
In 3-to-4-unit structures: $219,768 Here:
$219,768State:
$330,907
In 5-or-more-unit structures: $160,443 Here:
$160,443State:
$318,887
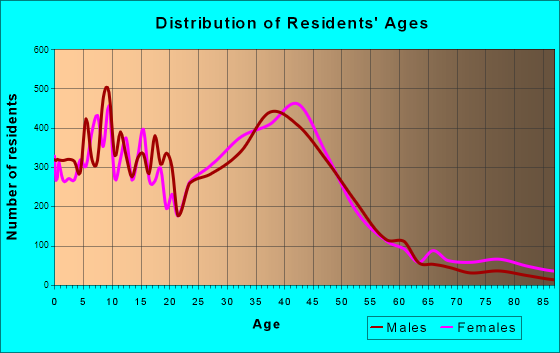
Total population: 40,349 (Urban population: 39,790, Rural population: 0)
Houses: 14,884 (14,501 occupied: 9,817 owner occupied, 4,699 renter occupied )
% of renters here:
32%State:
33%
Housing density: 1,673 houses/condos per square mile
Median price asked for vacant for-sale houses and condos in 2022: $282,164.
Median contract rent in 2022: $1,261 (lower quartile is $1,020, upper quartile is $1,544)
Median rent asked for vacant for-rent units in 2022: $1,426
Median gross rent in Carol Stream, IL in 2022: $1,342
Housing units in Carol Stream with a mortgage: 6,657 (599 second mortgage, 12 home equity loan, 486 both second mortgage and home equity loan )Houses without a mortgage: 291
Median household income for houses/condos with a mortgage: $133,337
Median household income for apartments without a mortgage: $91,518
Median monthly housing costs: $1,528
Data:
Median house or condo value ($)
Median house or condo value ($ change since 2000)
Median house or condo value ($) - White
Median house or condo value ($) - Black or African American
Median house or condo value ($) - Asian
Median house or condo value ($) - Hispanic or Latino
Median house or condo value ($) - American Indian and Alaska Native
Median house or condo value ($) - Multirace
Median house or condo value ($) - Other Race
Median price asked for mobile homes ($)
Household density (households per square mile)
Mean house or condo value by units in structure - 1, detached ($)
Mean house or condo value by units in structure - 1, attached ($)
Mean house or condo value by units in structure - 2 ($)
Mean house or condo value by units in structure by units in structure - 3 or 4 ($)
Mean house or condo value by units in structure - 5 or more ($)
Mean house or condo value by units in structure - Boat, RV, van, etc. ($)
Mean house or condo value by units in structure - Mobile home ($)
Median contract rent ($)
Median contract rent - Lower quartile ($)
Median contract rent - Upper quartile ($)
Median gross rent ($)
Urban houses (%)
Rural houses (%)
Houses occupied (%)
Houses occupied (% change since 2000)
Houses owner occupied (%)
Houses owner occupied (% change since 2000)
Houses renter occupied (%)
Houses renter occupied (% change since 2000)
Vacant housing units - For rent (%)
Vacant housing units - For rent (% change since 2000)
Vacant housing units - For sale only (%)
Vacant housing units - For sale only (% change since 2000)
Vacant housing units - Rented or sold, not occupied (%)
Vacant housing units - Rented or sold, not occupied (% change since 2000)
Vacant housing units - For seasonal, recreational, or occasional use (%)
Vacant housing units - For seasonal, recreational, or occasional use (% change since 2000)
Vacant housing units - For migrant workers (%)
Vacant housing units - For migrant workers (% change since 2000)
Vacant housing units - Other vacant (%)
Vacant housing units - Other vacant (% change since 2000)
Median monthly housing costs ($)
Median household income for houses/condos with a mortgage ($)
Median household income for houses/condos without a mortgage ($)
Median household income ($)
Median household income ($) - White
Median household income ($) - Black or African American
Median household income ($) - Asian
Median household income ($) - Hispanic or Latino
Median household income ($) - American Indian and Alaska Native
Median household income ($) - Multirace
Median household income ($) - Other Race
Mortgage status - with mortgage (%)
Mortgage status - with second mortgage (%)
Mortgage status - with home equity loan (%)
Mortgage status - with both second mortgage and home equity loan (%)
Mortgage status - without a mortgage (%)
Median year house/condo built
Median year apartment built
Household type by relationship - Male householder living alone (%)
Household type by relationship - Male householder not living alone (%)
Household type by relationship - Female householder living alone (%)
Household type by relationship - Female householder not living alone (%)
Household type by relationship - Opposite-Sex spouse (%)
Household type by relationship - Same-Sex spouse (%)
Household type by relationship - Opposite-Sex unmarried partner (%)
Household type by relationship - Same-Sex unmarried partner (%)
Household type by relationship - In group quarters (%)
Size of family households - 2-person household (%)
Size of family households - 3-person household (%)
Size of family households - 4-person household (%)
Size of family households - 5-person household (%)
Size of family households - 6-person household (%)
Size of family households - 7-or-more-person household (%)
Size of nonfamily households - 1-person household (%)
Size of nonfamily households - 2-person household (%)
Size of nonfamily households - 3-person household (%)
Size of nonfamily households - 4-person household (%)
Size of nonfamily households - 5-person household (%)
Size of nonfamily households - 6-person household (%)
Size of nonfamily households - 7-or-moreperson household (%)
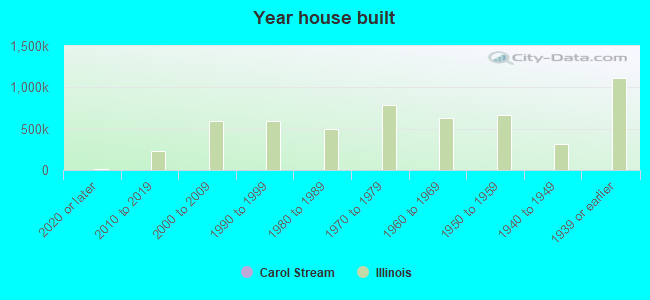
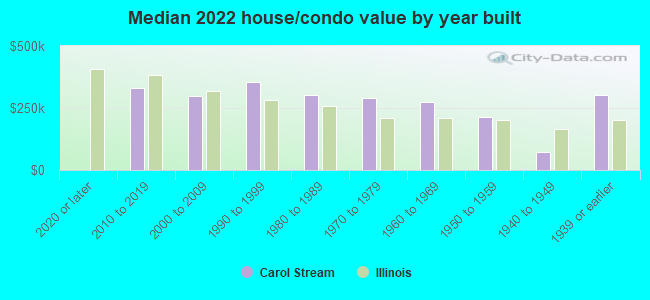
Year house built - Built 2010 or later (%)
Year house built - Built 2000 to 2009 (%)
Year house built - Built 1990 to 1999 (%)
Year house built - Built 1980 to 1989 (%)
Year house built - Built 1970 to 1979 (%)
Year house built - Built 1960 to 1969 (%)
Year house built - Built 1950 to 1959 (%)
Year house built - Built 1940 to 1949 (%)
Year house built - Built 1939 or earlier (%)
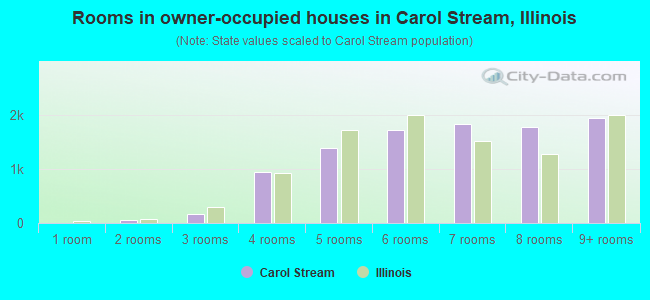
Median number of rooms in houses and condos
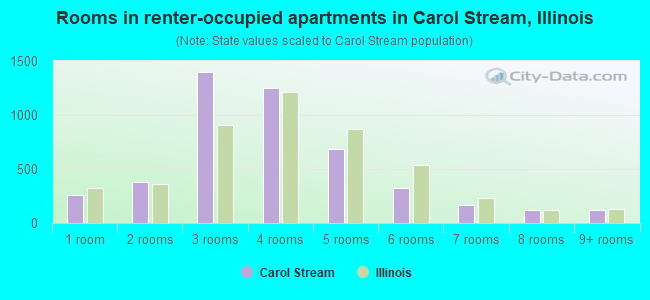
Median number of rooms in apartments
Median number of bedrooms in owner occupied houses
Mean number of bedrooms in owner occupied houses
Median number of bedrooms in renter occupied houses
Mean number of bedrooms in renter occupied houses
Median number of vehichles in owner occupied houses
Mean number of vehichles in owner occupied houses
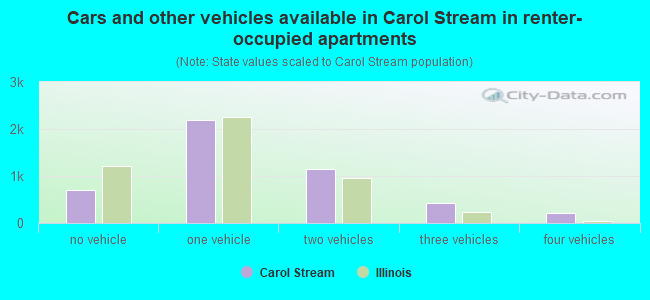
Median number of vehichles in renter occupied houses
Mean number of vehichles in renter occupied houses
Rooms in owner-occupied houses - 1 room (%)
Rooms in owner-occupied houses - 2 rooms (%)
Rooms in owner-occupied houses - 3 rooms (%)
Rooms in owner-occupied houses - 4 rooms (%)
Rooms in owner-occupied houses - 5 rooms (%)
Rooms in owner-occupied houses - 6 rooms (%)
Rooms in owner-occupied houses - 7 rooms (%)
Rooms in owner-occupied houses - 8 rooms (%)
Rooms in owner-occupied houses - 9+ rooms (%)
Rooms in renter-occupied houses - 1 room (%)
Rooms in renter-occupied houses - 2 rooms (%)
Rooms in renter-occupied houses - 3 rooms (%)
Rooms in renter-occupied houses - 4 rooms (%)
Rooms in renter-occupied houses - 5 rooms (%)
Rooms in renter-occupied houses - 6 rooms (%)
Rooms in renter-occupied houses - 7 rooms (%)
Rooms in renter-occupied houses - 8 rooms (%)
Rooms in renter-occupied houses - 9+ rooms (%)
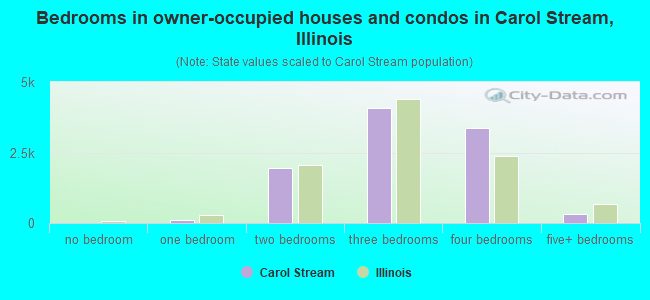
Bedrooms in owner-occupied houses - no bedrooms (%)
Bedrooms in owner-occupied houses - 1 bedroom (%)
Bedrooms in owner-occupied houses - 2 bedrooms (%)
Bedrooms in owner-occupied houses - 3 bedrooms (%)
Bedrooms in owner-occupied houses - 4 bedrooms (%)
Bedrooms in owner-occupied houses - 5+ bedrooms (%)
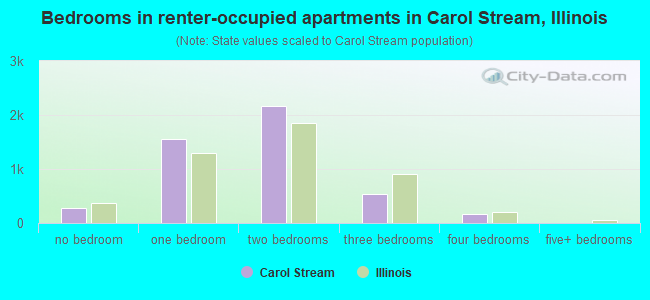
Bedrooms in renter-occupied houses - no bedrooms (%)
Bedrooms in renter-occupied houses - 1 bedroom (%)
Bedrooms in renter-occupied houses - 2 bedrooms (%)
Bedrooms in renter-occupied houses - 3 bedrooms (%)
Bedrooms in renter-occupied houses - 4 bedrooms (%)
Bedrooms in renter-occupied houses - 5+ bedrooms (%)
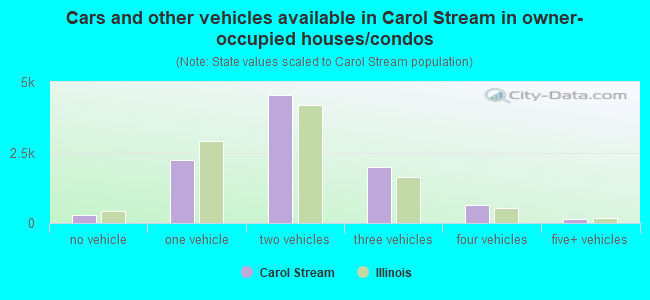
Vehicles available in owner-occupied houses - no vehicle available (%)
Vehicles available in owner-occupied houses - 1 vehicle available(%)
Vehicles available in owner-occupied houses - 2 Vehicles available (%)
Vehicles available in owner-occupied houses - 3 Vehicles available (%)
Vehicles available in owner-occupied houses - 4 Vehicles available (%)
Vehicles available in owner-occupied houses - 5+ Vehicles available (%)
Vehicles available in renter-occupied houses - no vehicle available (%)
Vehicles available in renter-occupied houses - 1 vehicle available (%)
Vehicles available in renter-occupied houses - 2 Vehicles available (%)
Vehicles available in renter-occupied houses - 3 Vehicles available (%)
Vehicles available in renter-occupied houses - 4 Vehicles available (%)
Vehicles available in renter-occupied houses - 5+ Vehicles available (%)
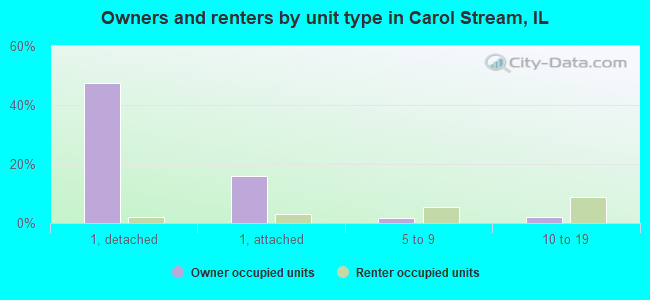
Housing units in structures - 1, detached (%)
Housing units in structures - 1, attached (%)
Housing units in structures - 2 (%)
Housing units in structures - 3 or 4 (%)
Housing units in structures - 5 to 9 (%)
Housing units in structures - 10 to 19 (%)
Housing units in structures - 20 to 49 (%)
Housing units in structures - 50 or more (%)
Housing units in structures - Mobile home (%)
Housing units in structures - Boat, RV, van, etc. (%)
Housing units in structures - Owners - 1, detached (%)
Housing units in structures - Owners - 1, attached (%)
Housing units in structures - Owners - 2 (%)
Housing units in structures - Owners - 3 or 4 (%)
Housing units in structures - Owners - 5 to 9 (%)
Housing units in structures - Owners - 10 to 19 (%)
Housing units in structures - Owners - 20 to 49 (%)
Housing units in structures - Owners - 50 or more (%)
Housing units in structures - Owners - Mobile home (%)
Housing units in structures - Owners - Boat, RV, van, etc. (%)
Housing units in structures - Renters - 1, detached (%)
Housing units in structures - Renters - 1, attached (%)
Housing units in structures - Renters - 2 (%)
Housing units in structures - Renters - 3 or 4 (%)
Housing units in structures - Renters - 5 to 9 (%)
Housing units in structures - Renters - 10 to 19 (%)
Housing units in structures - Renters - 20 to 49 (%)
Housing units in structures - Renters - 50 or more (%)
Housing units in structures - Renters - Mobile home (%)
Housing units in structures - Renters - Boat, RV, van, etc. (%)
House/condo owner moved in on average (years ago)
Renter moved in on average (years ago)
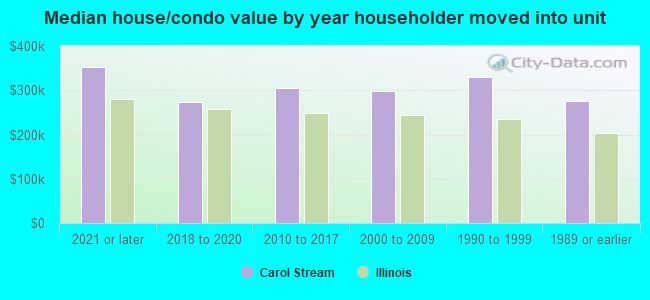
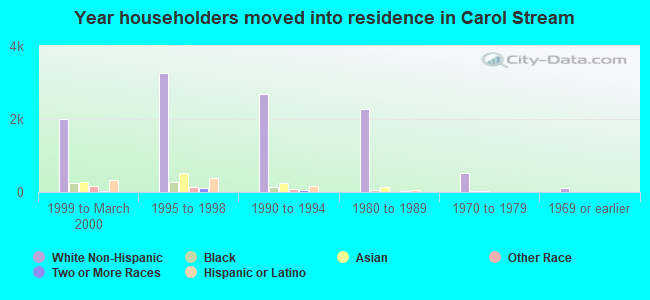
Year householder moved into unit - Moved in 1999 to March 2000 (%)
Year householder moved into unit - Moved in 1999 to March 2000 (%) - White
Year householder moved into unit - Moved in 1999 to March 2000 (%) - Black or African American
Year householder moved into unit - Moved in 1999 to March 2000 (%) - Asian
Year householder moved into unit - Moved in 1999 to March 2000 (%) - Hispanic or Latino
Year householder moved into unit - Moved in 1999 to March 2000 (%) - American Indian and Alaska Native
Year householder moved into unit - Moved in 1999 to March 2000 (%) - Multirace
Year householder moved into unit - Moved in 1999 to March 2000 (%) - Other Race
Year householder moved into unit - Moved in 1995 to 1998 (%)
Year householder moved into unit - Moved in 1995 to 1998 (%) - White
Year householder moved into unit - Moved in 1995 to 1998 (%) - Black or African American
Year householder moved into unit - Moved in 1995 to 1998 (%) - Asian
Year householder moved into unit - Moved in 1995 to 1998 (%) - Hispanic or Latino
Year householder moved into unit - Moved in 1995 to 1998 (%) - American Indian and Alaska Native
Year householder moved into unit - Moved in 1995 to 1998 (%) - Multirace
Year householder moved into unit - Moved in 1995 to 1998 (%) - Other Race
Year householder moved into unit - Moved in 1990 to 1994 (%)
Year householder moved into unit - Moved in 1990 to 1994 (%) - White
Year householder moved into unit - Moved in 1990 to 1994 (%) - Black or African American
Year householder moved into unit - Moved in 1990 to 1994 (%) - Asian
Year householder moved into unit - Moved in 1990 to 1994 (%) - Hispanic or Latino
Year householder moved into unit - Moved in 1990 to 1994 (%) - American Indian and Alaska Native
Year householder moved into unit - Moved in 1990 to 1994 (%) - Multirace
Year householder moved into unit - Moved in 1990 to 1994 (%) - Other Race
Year householder moved into unit - Moved in 1980 to 1989 (%)
Year householder moved into unit - Moved in 1980 to 1989 (%) - White
Year householder moved into unit - Moved in 1980 to 1989 (%) - Black or African American
Year householder moved into unit - Moved in 1980 to 1989 (%) - Asian
Year householder moved into unit - Moved in 1980 to 1989 (%) - Hispanic or Latino
Year householder moved into unit - Moved in 1980 to 1989 (%) - American Indian and Alaska Native
Year householder moved into unit - Moved in 1980 to 1989 (%) - Multirace
Year householder moved into unit - Moved in 1980 to 1989 (%) - Other Race
Year householder moved into unit - Moved in 1970 to 1979 (%)
Year householder moved into unit - Moved in 1970 to 1979 (%) - White
Year householder moved into unit - Moved in 1970 to 1979 (%) - Black or African American
Year householder moved into unit - Moved in 1970 to 1979 (%) - Asian
Year householder moved into unit - Moved in 1970 to 1979 (%) - Hispanic or Latino
Year householder moved into unit - Moved in 1970 to 1979 (%) - American Indian and Alaska Native
Year householder moved into unit - Moved in 1970 to 1979 (%) - Multirace
Year householder moved into unit - Moved in 1970 to 1979 (%) - Other Race
Year householder moved into unit - Moved in 1969 or earlier (%)
Year householder moved into unit - Moved in 1969 or earlier (%) - White
Year householder moved into unit - Moved in 1969 or earlier (%) - Black or African American
Year householder moved into unit - Moved in 1969 or earlier (%) - Asian
Year householder moved into unit - Moved in 1969 or earlier (%) - Hispanic or Latino
Year householder moved into unit - Moved in 1969 or earlier (%) - American Indian and Alaska Native
Year householder moved into unit - Moved in 1969 or earlier (%) - Multirace
Year householder moved into unit - Moved in 1969 or earlier (%) - Other Race
Housing units lacking complete plumbing facilities (%)
Housing units lacking complete kitchen facilities (%)
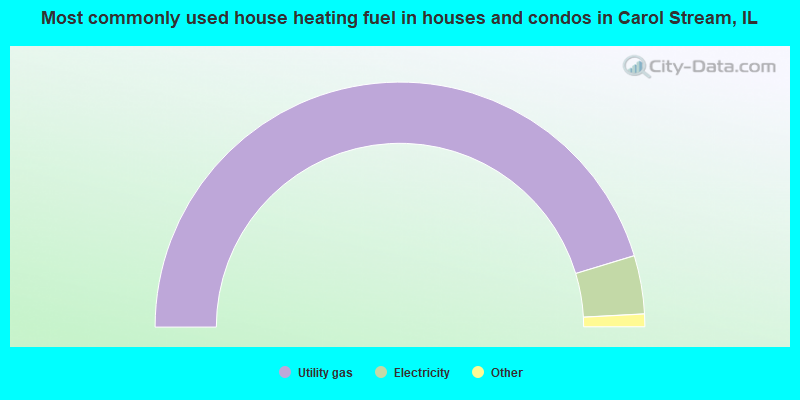
House heating fuel used in houses and condos - Utility gas (%)
House heating fuel used in houses and condos - Bottled, tank, or LP gas (%)
House heating fuel used in houses and condos - Electricity (%)
House heating fuel used in houses and condos - Fuel oil, kerosene, etc. (%)
House heating fuel used in houses and condos - Coal or coke (%)
House heating fuel used in houses and condos - Wood (%)
House heating fuel used in houses and condos - Solar energy (%)
House heating fuel used in houses and condos - Other fuel (%)
House heating fuel used in houses and condos - No fuel used (%)
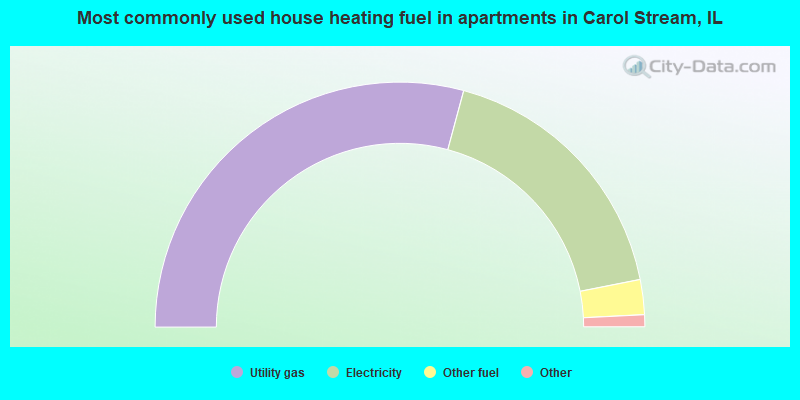
House heating fuel used in apartments - Utility gas (%)
House heating fuel used in apartments - Bottled, tank, or LP gas (%)
House heating fuel used in apartments - Electricity (%)
House heating fuel used in apartments - Fuel oil, kerosene, etc. (%)
House heating fuel used in apartments - Coal or coke (%)
House heating fuel used in apartments - Wood (%)
House heating fuel used in apartments - Solar energy (%)
House heating fuel used in apartments - Other fuel (%)
House heating fuel used in apartments - No fuel used (%)
Median year house/condo built: 1986Median year apartment built: 1981Household type by relationship:
Households: 39,244
Male householders: 7,806 (1,403 living alone ), Female householders: 6,472 (1,752 living alone )8,145 spouses (8,081 opposite-sex spouses ), 789 unmarried partners , (789 opposite-sex unmarried partners ), 12,178 children (11,649 natural , 219 adopted , 308 stepchildren ), 373 grandchildren , 587 brothers or sisters , 1,040 parents , 0 foster children , 705 other relatives , 790 non-relatives In group quarters: 355
Size of family households: 3,988 2-persons , 2,890 3-persons , 2,209 4-persons , 907 5-persons , 395 6-persons , 94 7-or-more-persons .
Size of nonfamily households: 3,270 1-person , 547 2-persons , 109 3-persons , 17 4-persons .
5,892 married couples with children. single-parent households (71 men , 1,435 women ).
63.8% of residents of Carol Stream speak English at home. of residents speak Spanish at home (64% speak English very well , 20% speak English well , 10% speak English not well , 6% don't speak English at all ).of residents speak other Indo-European language at home (54% speak English very well , 28% speak English well , 15% speak English not well , 3% don't speak English at all ).of residents speak Asian or Pacific Island language at home (48% speak English very well , 31% speak English well , 17% speak English not well , 3% don't speak English at all ).of residents speak other language at home (82% speak English very well , 7% speak English well , 11% speak English not well ).
Foreign born population: 10,287 (26.2%)of them are naturalized citizens )
Median number of rooms in houses and condos:
Median number of rooms in apartments
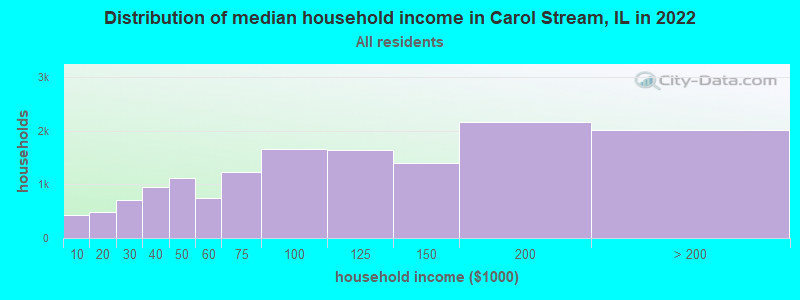
Carol Stream, IL household income distribution 435 Less than $10,000479 $10,000 to $19,999716 $20,000 to $29,999947 $30,000 to $39,9991,116 $40,000 to $49,999748 $50,000 to $59,9991,231 $60,000 to $74,9991,648 $75,000 to $99,9991,642 $100,000 to $124,9991,396 $125,000 to $149,9992,160 $150,000 to $199,9992,015 $200,000 or more
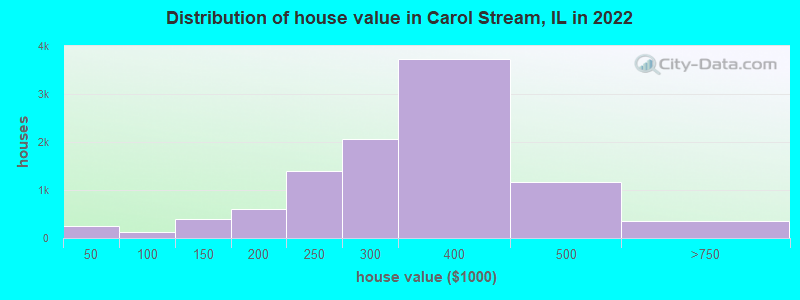
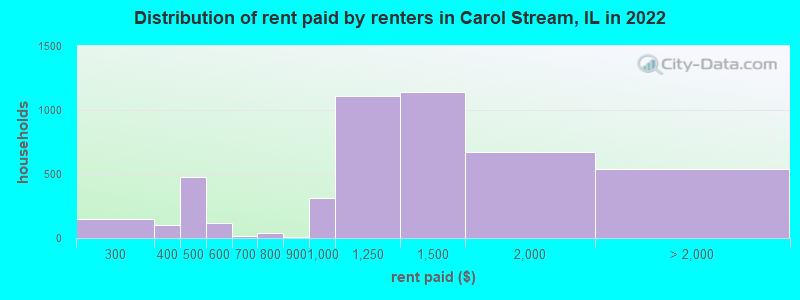
Home value of owner - occupied houses in 2022 in Carol Stream, IL 78 Less than $10,00027 $15,000 to $19,99952 $20,000 to $24,99954 $25,000 to $29,99914 $30,000 to $34,99917 $35,000 to $39,99921 $50,000 to $59,99942 $60,000 to $69,99939 $70,000 to $79,9994 $80,000 to $89,99916 $90,000 to $99,999175 $100,000 to $124,999225 $125,000 to $149,999211 $150,000 to $174,999384 $175,000 to $199,9991,395 $200,000 to $249,9992,058 $250,000 to $299,9993,723 $300,000 to $399,9991,176 $400,000 to $499,999310 $500,000 to $749,99942 $750,000 to $999,999Rent paid by renters in 2022 in Carol Stream, IL 61 $200 to $24983 $250 to $29935 $300 to $34968 $350 to $399474 $400 to $449116 $500 to $54914 $650 to $69941 $750 to $7999 $800 to $899314 $900 to $9991,108 $1,000 to $1,2491,141 $1,250 to $1,499669 $1,500 to $1,999200 $2,000 to $2,49954 $2,500 to $2,99975 $3,000 to $3,499117 $3,500 or more90 No cash rent
Percentage of workers working in this county: 70.4%Number of people working at home: 2,952 (14.0% of all workers )
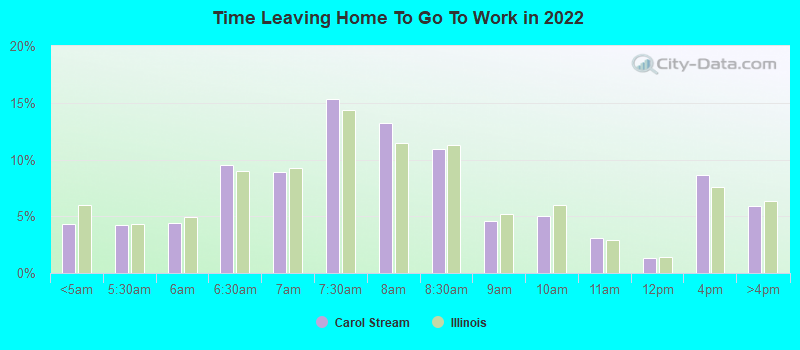
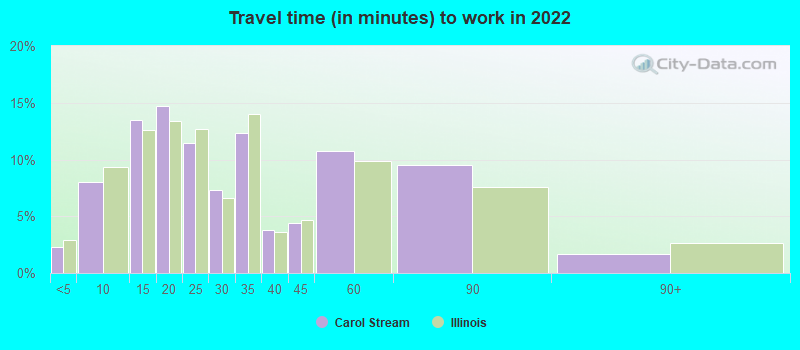
Travel time to work (commute)
Less than 5 minutes: 3285 to 9 minutes: 1,26510 to 14 minutes: 2,45215 to 19 minutes: 2,46120 to 24 minutes: 2,10825 to 29 minutes: 1,40430 to 34 minutes: 2,36035 to 39 minutes: 88440 to 44 minutes: 1,25245 to 59 minutes: 1,64660 to 89 minutes: 1,22090 or more minutes: 453
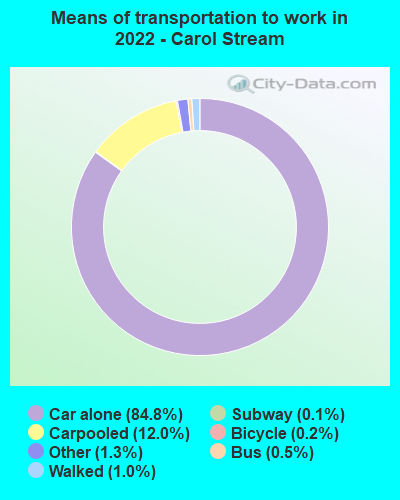
Means of transportation to work:
Drove a car alone: 18,728 (72.6%)Carpooled: 3,246 (12.6%)Bus : 171 (0.7%)Subway or elevated rail : 13 (0.1%)Long-distance train or commuter rail : 26 (0.1%)Ferryboat: 9 (0.0%)Taxi: 324 (1.3%)Bicycle: 45 (0.2%)Walked: 197 (0.8%)Worked at home: 2,952 (11.4%)
Unemployment by race in 2022
Unemployment rate for White non-Hispanic residents 3.2% Males0.6% FemalesUnemployment rate for Black residents 13.1% Males29.0% FemalesUnemployment rate for Asian residents 5.6% Males4.3% FemalesUnemployment rate for other race residents 17.6% Males1.3% FemalesUnemployment rate for two or more race residents 1.8% Males2.7% FemalesUnemployment rate for Hispanic or Latino residents 6.9% Males0.5% Females
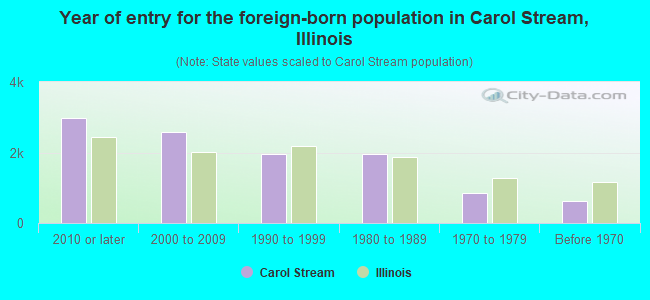
Year of entry for the foreign-born population in Carol Stream, Illinois
2,987 2010 or later 2,583 2000 to 2009 1,971 1990 to 1999 1,944 1980 to 1989 852 1970 to 1979 628 Before 1970
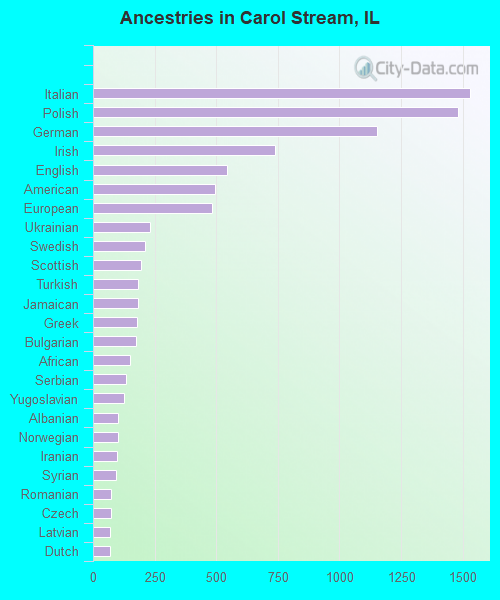
First ancestries reported:
Italian: 1,530 (7.2%)
Polish: 1,479 (7.0%)
German: 1,152 (5.4%)
Irish: 738 (3.5%)
English: 542 (2.5%)
American: 493 (2.3%)
European: 483 (2.3%)
Ukrainian: 232 (1.1%)
Swedish: 211 (1.0%)
Scottish: 194 (0.9%)
Turkish: 184 (0.9%)
Jamaican: 183 (0.9%)
Greek: 177 (0.8%)
Bulgarian: 175 (0.8%)
African: 149 (0.7%)
Serbian: 134 (0.6%)
Yugoslavian: 127 (0.6%)
Albanian: 102 (0.5%)
Norwegian: 100 (0.5%)
Iranian: 97 (0.5%)
Syrian: 94 (0.4%)
Romanian: 74 (0.3%)
Czech: 74 (0.3%)
Latvian: 69 (0.3%)
Dutch: 68 (0.3%)
Croatian: 54 (0.3%)
Scotch-Irish: 50 (0.2%)
Lithuanian: 41 (0.2%)
Russian: 37 (0.2%)
Iraqi: 33 (0.2%)
Eastern European: 27 (0.1%)
Canadian: 27 (0.1%)
Egyptian: 27 (0.1%)
Macedonian: 26 (0.1%)
Brazilian: 24 (0.1%)
Icelander: 17 (0.08%)
Danish: 15 (0.07%)
Slovak: 15 (0.07%)
Scandinavian: 11 (0.05%)
Belgian: 11 (0.05%)
Swiss: 11 (0.05%)
Finnish: 10 (0.05%)
Northern European: 10 (0.05%)
Austrian: 9 (0.04%)
Czechoslovakian: 8 (0.04%)
Estonian: 7 (0.03%)
Haitian: 7 (0.03%)
French: 6 (0.03%)
British: 6 (0.03%)
Slavic: 6 (0.03%)
Moroccan: 6 (0.03%)
Cajun: 5 (0.02%)
Arab: 5 (0.02%)
French Canadian: 3 (0.01%)
Most common places of birth for foreign-born residents (%): India Carol Stream:
23.1% (2,389)Illinois:
9.2% (166,409)
Mexico Carol Stream:
13.2% (1,368)Illinois:
34.7% (626,958)
Pakistan Carol Stream:
6.5% (677)Illinois:
1.6% (29,519)
Philippines Carol Stream:
6.5% (674)Illinois:
5.2% (93,003)
Vietnam Carol Stream:
6.4% (657)Illinois:
1.2% (22,269)
Colombia Carol Stream:
4.9% (509)Illinois:
0.9% (16,553)
Poland Carol Stream:
3.5% (361)Illinois:
6.9% (124,474)
Nepal Carol Stream:
2.4% (246)Illinois:
0.2% (3,231)
Bangladesh Carol Stream:
2.2% (225)Illinois:
0.2% (2,731)
Italy Carol Stream:
2.1% (220)Illinois:
0.9% (15,679)
Ukraine Carol Stream:
1.8% (186)Illinois:
1.6% (29,316)
Canada Carol Stream:
1.7% (177)Illinois:
1.1% (19,306)
Bosnia and Herzegovina Carol Stream:
1.6% (166)Illinois:
0.6% (10,776)
Guatemala Carol Stream:
1.6% (164)Illinois:
1.3% (22,793)
Place of birth for U.S.-born residents:
This state: 23,073Other state: 5,203Northeast: 796Midwest: 2,401South: 1,115West: 869 87.5% of Carol Stream residents lived in the same house 1 years ago.
Out of people who lived in different houses, 36.1% lived in this county.
Out of people who lived in different counties, 76.6% lived in Illinois.
Carol Stream:
87.5%State average:
88.3%
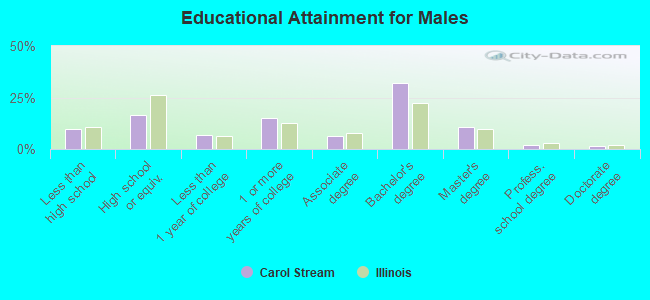
Education attainment for males 25 years and older:
No schooling: 302Nursery to 4th grade: 255th and 6th grade: 377th and 8th grade: 1439th grade: 2410th grade: 27411th grade: 10512th grade, no diploma: 382High school graduate (or equivalency): 2,140Less than 1 year of college: 861Some college more than 1 year, no degree: 1,972Associate degree: 824Bachelor's degree: 4,193Master's degree: 1,385Professional school degree: 260Doctorate degree: 172
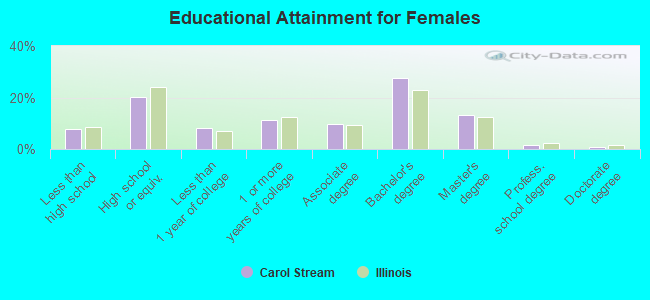
Education attainment for females 25 years and older:
No schooling: 271Nursery to 4th grade: 245th and 6th grade: 1997th and 8th grade: 679th grade: 7710th grade: 19811th grade: 6112th grade, no diploma: 190High school graduate (or equivalency): 2,823Less than 1 year of college: 1,118Some college more than 1 year, no degree: 1,572Associate degree: 1,383Bachelor's degree: 3,868Master's degree: 1,866Professional school degree: 196Doctorate degree: 118
Housing units in structures:
One, detached: 7,376One, attached: 2,468Two: 483 or 4: 4695 to 9: 87610 to 19: 1,94920 to 49: 90550 or more: 781Mobile homes: 8Housing units lacking complete plumbing facilities in 2022: 1.9%Housing units lacking complete kitchen facilities in 2022: 1.3%House/condo owner moved in on average 16 years ago
Renter moved in on average 2 years ago
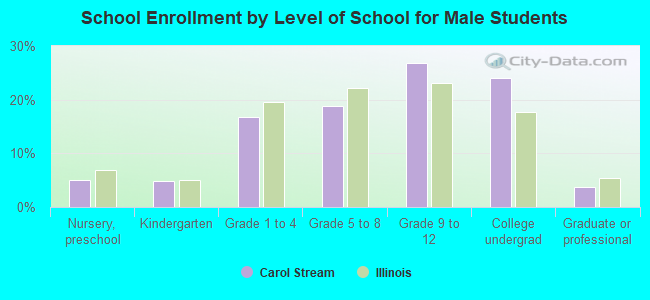
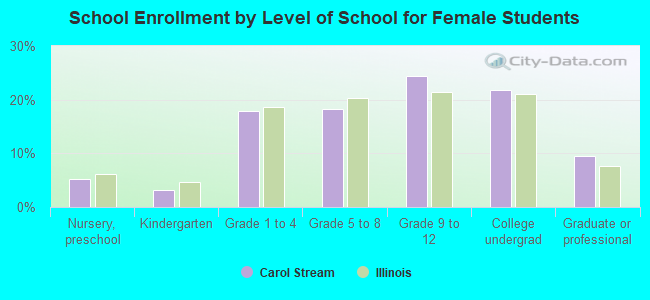
Private vs. public school enrollment:
Students in private schools in grades 1 to 8 (elementary and middle school): 607 Students in private schools in grades 9 to 12 (high school): 140 Students in private undergraduate colleges: 473