Castle Hills, TX (Texas) Houses and Residents
| Castle Hills: | $467,330 |
| Texas: | $275,400 |
Total population: 4,362 (Urban population: 4,202, Rural population: 0)
Houses: 2,022 (1,546 occupied: 1,275 owner occupied, 269 renter occupied)
| % of renters here: | 17% |
| State: | 38% |
Housing density: 815 houses/condos per square mile
Median price asked for vacant for-sale houses and condos in 2022: $387,591.
Median contract rent in 2022: $1,348 (lower quartile is $1,043, upper quartile is $1,991)
Median rent asked for vacant for-rent units in 2022: $2,023
Median gross rent in Castle Hills, TX in 2022: $1,519
Housing units in Castle Hills with a mortgage: 732 (57 second mortgage, 0 home equity loan, 56 both second mortgage and home equity loan)
Houses without a mortgage: 19
Median household income for houses/condos with a mortgage: $130,961
Median household income for apartments without a mortgage: $108,435
Median monthly housing costs: $1,828
Compare current foreclosures near Castle Hills, TX:
| Photo | Address | Area | Beds / Baths | Price | Details |
|---|---|---|---|---|---|

|
#1
Sunrise Pass
San Antonio, TX 78244
|
912 sq. feet
|
1 baths 3 beds |
$32,500
|
show details |

|
#2
Tractor Pass
Schertz, TX 78154
|
1,873 sq. feet
|
2 baths 3 beds |
$315,000
|
show details |

|
#3
Treehouse Dr
San Antonio, TX 78222
|
1,342 sq. feet
|
2 baths 3 beds |
$204,250
|
show details |

|
#4
Wind Crown
San Antonio, TX 78239
|
- sq. feet
|
2 baths 3 beds |
$285,000
|
show details |

|
#5
Morningside Pl
Schertz, TX 78154
|
2,109 sq. feet
|
2 baths 3 beds |
$369,900
|
show details |

|
#6
Timber Park St
San Antonio, TX 78250
|
1,750 sq. feet
|
2 baths 3 beds |
$239,900
|
show details |

|
#7
S Flores St Ste 2102
San Antonio, TX 78204
|
758 sq. feet
|
1 baths 1 beds |
show details | |

|
#8
Twin Oaks Path
San Antonio, TX 78254
|
- sq. feet
|
2 baths 3 beds |
show details | |

|
#9
White Crown
San Antonio, TX 78254
|
- sq. feet
|
2 baths 3 beds |
show details | |

|
#10
Interstate 35
San Antonio, TX 78208
|
- sq. feet
|
2 baths 2 beds |
show details |
| Photo | Address | Area | Beds / Baths | Price | Details |
|---|---|---|---|---|---|

|
#11
Briarbend St
San Antonio, TX 78247
|
1,335 sq. feet
|
2 baths 3 beds |
show details | |

|
#12
N Center Apt 109
San Antonio, TX 78202
|
1,717 sq. feet
|
2 baths 2 beds |
show details | |

|
#13
Gazelle Clf
San Antonio, TX 78245
|
- sq. feet
|
2 baths 4 beds |
show details | |

|
#14
Sunbend Fls
San Antonio, TX 78224
|
1,688 sq. feet
|
2 baths 4 beds |
show details | |

|
#15
Nubuck Br
Converse, TX 78109
|
1,845 sq. feet
|
2 baths 4 beds |
show details | |

|
#16
Rosemont Dr
San Antonio, TX 78228
|
2,081 sq. feet
|
2 baths 3 beds |
show details | |

|
#17
Richland Pl
San Antonio, TX 78244
|
1,955 sq. feet
|
2 baths 3 beds |
show details | |

|
#18
Tianna Lace
San Antonio, TX 78253
|
- sq. feet
|
3 baths 5 beds |
show details | |

|
#19
Lark Ave
San Antonio, TX 78228
|
1,472 sq. feet
|
1 baths 2 beds |
show details | |

|
#20
Autumn Sun
San Antonio, TX 78254
|
- sq. feet
|
2 baths 4 beds |
show details |
| Photo | Address | Area | Beds / Baths | Price | Details |
|---|---|---|---|---|---|

|
#21
Pima S 1
San Antonio, TX 78211
|
1,672 sq. feet
|
1 baths 2 beds |
show details | |

|
#22
S Shaenridge
San Antonio, TX 78254
|
1,390 sq. feet
|
2 baths 3 beds |
show details | |

|
#23
Eagle Peak
Helotes, TX 78023
|
2,520 sq. feet
|
4 baths 4 beds |
show details | |

|
#24
Prairie Flower St
San Antonio, TX 78242
|
- sq. feet
|
2 baths 3 beds |
show details | |

|
#25
Fern Hl
San Antonio, TX 78259
|
3,635 sq. feet
|
2 baths 3 beds |
show details | |

|
#26
Lark Ave
San Antonio, TX 78228
|
1,092 sq. feet
|
2 baths 4 beds |
show details | |

|
#27
Tallulah Dr
San Antonio, TX 78218
|
1,436 sq. feet
|
2 baths 3 beds |
show details | |

|
#28
Indigo Crk
San Antonio, TX 78239
|
2,651 sq. feet
|
3 baths 4 beds |
show details | |

|
#29
Gray Fox Crk
San Antonio, TX 78245
|
- sq. feet
|
2 baths 4 beds |
show details | |

|
#30
Gypsy Pt
San Antonio, TX 78245
|
- sq. feet
|
2 baths 3 beds |
show details |
| Photo | Address | Area | Beds / Baths | Price | Details |
|---|---|---|---|---|---|

|
#31
Kingsbridge
San Antonio, TX 78253
|
1,097 sq. feet
|
2 baths 2 beds |
show details | |

|
#32
Hallie Pass
San Antonio, TX 78227
|
2,160 sq. feet
|
2 baths 3 beds |
show details | |

|
#33
Amber Coral
San Antonio, TX 78245
|
1,605 sq. feet
|
3 baths 3 beds |
show details | |

|
#34
Liberty Grn
San Antonio, TX 78245
|
1,126 sq. feet
|
2 baths 3 beds |
show details | |

|
#35
Fort Sumter St
San Antonio, TX 78245
|
1,986 sq. feet
|
2 baths 4 beds |
show details | |

|
#36
Antrim Dr
San Antonio, TX 78218
|
1,509 sq. feet
|
1 baths 3 beds |
show details | |

|
#37
Watering Point Dr
San Antonio, TX 78247
|
1,551 sq. feet
|
2 baths 3 beds |
show details | |

|
#38
Santa Anna
San Antonio, TX 78201
|
1,220 sq. feet
|
2 baths 3 beds |
show details | |

|
#39
Kate Schenck Ave
San Antonio, TX 78223
|
1,434 sq. feet
|
2 baths 3 beds |
show details | |

|
#40
Mission Ledge
Boerne, TX 78015
|
2,737 sq. feet
|
3 baths 3 beds |
show details |
| Photo | Address | Area | Beds / Baths | Price | Details |
|---|---|---|---|---|---|

|
#41
Revlon Dr
San Antonio, TX 78227
|
1,029 sq. feet
|
1 baths 3 beds |
show details | |

|
#42
Forest Mill St
San Antonio, TX 78240
|
2,021 sq. feet
|
2 baths 4 beds |
show details | |

|
#43
Orchard Acres
San Antonio, TX 78261
|
2,102 sq. feet
|
2 baths 3 beds |
show details | |

|
#44
Princeton Ave
San Antonio, TX 78201
|
1,466 sq. feet
|
2 baths 3 beds |
show details | |

|
#45
Wayfarer Pl
San Antonio, TX 78242
|
972 sq. feet
|
1 baths 3 beds |
show details | |

|
#46
Greenham
San Antonio, TX 78239
|
1,772 sq. feet
|
2 baths 4 beds |
show details | |

|
#47
Colonia
San Antonio, TX 78254
|
3,288 sq. feet
|
2 baths 4 beds |
show details | |

|
#48
Honeysuckle Ln
San Antonio, TX 78213
|
2,973 sq. feet
|
3 baths 4 beds |
show details | |

|
#49
Cielo Trce
San Antonio, TX 78261
|
2,936 sq. feet
|
2 baths 3 beds |
show details | |

|
Check over 1 million property listings on Foreclosure.com!
|
browse all offers | |||


Median year apartment built: 1959
Household type by relationship:
Households: 4,071- Male householders: 984 (215 living alone), Female householders: 544 (192 living alone)
855 spouses (828 opposite-sex spouses), 60 unmarried partners, (60 opposite-sex unmarried partners), 1,256 children (1,162 natural, 58 adopted, 35 stepchildren), 39 grandchildren, 34 brothers or sisters, 85 parents, 0 foster children, 36 other relatives, 127 non-relatives
- In group quarters: 44
Size of family households: 464 2-persons, 242 3-persons, 212 4-persons, 79 5-persons, 15 6-persons, 27 7-or-more-persons.
Size of nonfamily households: 422 1-person, 73 2-persons, 11 3-persons.
755 married couples with children.
52 single-parent households (27 men, 25 women).
64.1% of residents of Castle Hills speak English at home.
33.4% of residents speak Spanish at home (66% speak English very well, 20% speak English well, 12% speak English not well, 2% don't speak English at all).
0.5% of residents speak other Indo-European language at home (100% speak English very well).
1.9% of residents speak Asian or Pacific Island language at home (69% speak English very well, 31% speak English not well).
Foreign born population: 584 (14.3%)
(55.3% of them are naturalized citizens)
| Here: | 7.1 |
| State: | 6.3 |
| Here: | 4.1 |
| State: | 4.0 |

- Bedrooms in owner-occupied houses and condos in Castle Hills, Texas
- 0no bedroom
- 01 bedroom
- 712 bedrooms
- 6463 bedrooms
- 4594 bedrooms
- 995+ bedrooms

- Bedrooms in renter-occupied apartments in Castle Hills, Texas
- 25no bedroom
- 611 bedroom
- 1112 bedrooms
- 303 bedrooms
- 104 bedrooms
- 335+ bedrooms

- Cars and other vehicles available in Castle Hills in owner-occupied houses/condos
- 5no vehicle
- 2401 vehicle
- 6522 vehicles
- 2823 vehicles
- 504 vehicles
- 475+ vehicles

- Cars and other vehicles available in Castle Hills in renter-occupied apartments
- 74no vehicle
- 1251 vehicle
- 302 vehicles
- 203 vehicles
- 04 vehicles
- 215+ vehicles

- Rooms in owner-occupied houses in Castle Hills, Texas
- 01 room
- 02 rooms
- 123 rooms
- 204 rooms
- 995 rooms
- 3196 rooms
- 3107 rooms
- 2138 rooms
- 3029+ rooms

- Rooms in renter-occupied apartments in Castle Hills, Texas
- 251 room
- 82 rooms
- 433 rooms
- 1044 rooms
- 305 rooms
- 06 rooms
- 207 rooms
- 78 rooms
- 329+ rooms


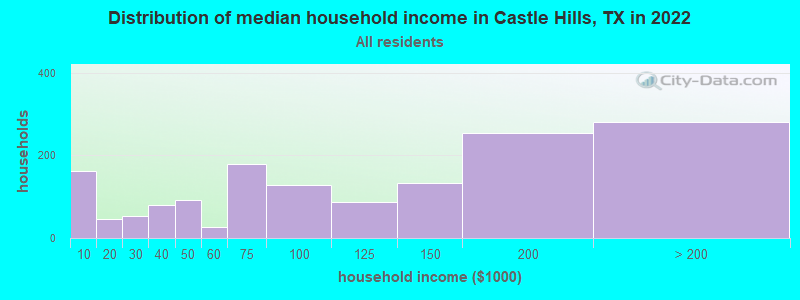
Castle Hills, TX household income distribution

- 163Less than $10,000
- 47$10,000 to $19,999
- 54$20,000 to $29,999
- 80$30,000 to $39,999
- 92$40,000 to $49,999
- 27$50,000 to $59,999
- 180$60,000 to $74,999
- 129$75,000 to $99,999
- 86$100,000 to $124,999
- 133$125,000 to $149,999
- 254$150,000 to $199,999
- 281$200,000 or more
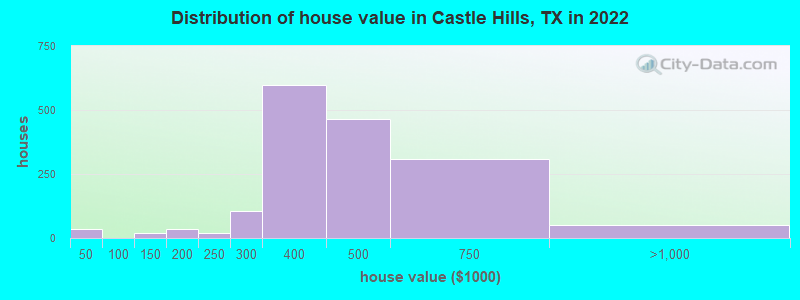
Home value of owner - occupied houses in 2022 in Castle Hills, TX
-
- 27Less than $10,000
- 6$30,000 to $34,999
- 7$100,000 to $124,999
- 10$125,000 to $149,999
- 16$150,000 to $174,999
- 21$175,000 to $199,999
- 20$200,000 to $249,999
- 104$250,000 to $299,999
- 599$300,000 to $399,999
- 465$400,000 to $499,999
- 309$500,000 to $749,999
- 49$750,000 to $999,999
- 2$1,500,000 to $1,999,999
Rent paid by renters in 2022 in Castle Hills, TX
-
- 31$750 to $799
- 38$1,000 to $1,249
- 38$1,250 to $1,499
- 24$1,500 to $1,999
- 15$2,000 to $2,499
- 11$2,500 to $2,999
- 8$3,000 to $3,499
- 92No cash rent


Percentage of workers working in this county: 90.2%
Number of people working at home: 215 (11.2% of all workers)
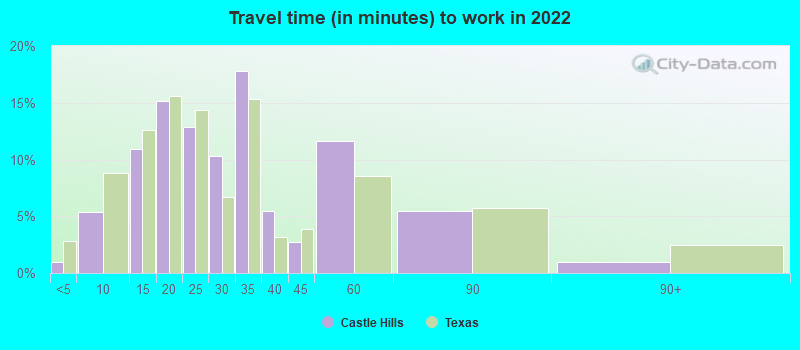
Travel time to work (commute)
- Less than 5 minutes: 93
- 5 to 9 minutes: 292
- 10 to 14 minutes: 185
- 15 to 19 minutes: 396
- 20 to 24 minutes: 365
- 25 to 29 minutes: 81
- 30 to 34 minutes: 176
- 35 to 39 minutes: 6
- 40 to 44 minutes: 0
- 45 to 59 minutes: 15
- 60 to 89 minutes: 70
- 90 or more minutes: 0
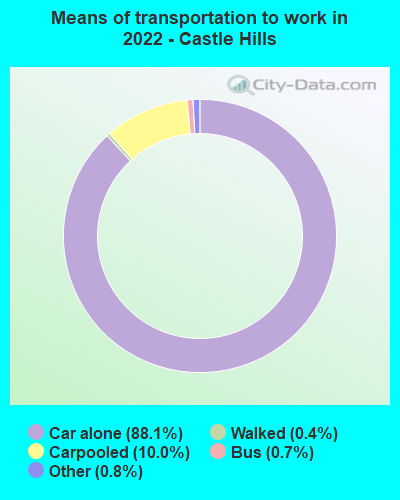
Means of transportation to work:
- Drove a car alone: 3,997 (79.6%)
- Carpooled: 513 (10.2%)
- Bus: 36 (0.7%)
- Taxi: 42 (0.8%)
- Walked: 21 (0.4%)
- Worked at home: 215 (4.3%)

- Unemployment by race in 2022
- Unemployment rate for White non-Hispanic residents
- 2.4%Males
- 1.4%Females
- Unemployment rate for Black residents
- 100.0%Males
- Unemployment rate for two or more race residents
- 0.3%Males
- Unemployment rate for Hispanic or Latino residents
- 0.2%Males

- Year of entry for the foreign-born population in Castle Hills, Texas
- 2702010 or later
- 432000 to 2009
- 1661990 to 1999
- 281980 to 1989
- 221970 to 1979
- 189Before 1970

First ancestries reported:
- English: 297 (11.0%)
- German: 159 (5.9%)
- American: 103 (3.8%)
- Irish: 66 (2.5%)
- Scottish: 57 (2.1%)
- Scotch-Irish: 52 (1.9%)
- Greek: 41 (1.5%)
- Italian: 32 (1.2%)
- Polish: 30 (1.1%)
- European: 13 (0.5%)
- Ethiopian: 13 (0.5%)
- Hungarian: 10 (0.4%)
- Swiss: 10 (0.4%)
- British: 8 (0.3%)
- Eastern European: 7 (0.3%)
- Danish: 5 (0.2%)
- French Canadian: 5 (0.2%)
- Czech: 4 (0.1%)
- Norwegian: 4 (0.1%)
- Russian: 1 (0.04%)
Most common places of birth for foreign-born residents (%):
| Castle Hills: | 45.8% (276) |
| Texas: | 48.4% (2,411,723) |
| Castle Hills: | 18.6% (112) |
| Texas: | 3.0% (147,182) |
| Castle Hills: | 5.1% (31) |
| Texas: | 0.4% (17,796) |
| Castle Hills: | 4.2% (25) |
| Texas: | 0.2% (12,456) |
| Castle Hills: | 4.0% (24) |
| Texas: | 1.2% (60,172) |
| Castle Hills: | 4.0% (24) |
| Texas: | 4.5% (224,455) |
| Castle Hills: | 3.8% (23) |
| Texas: | 3.7% (184,770) |
| Castle Hills: | 2.3% (14) |
| Texas: | 2.1% (103,148) |
| Castle Hills: | 2.2% (13) |
| Texas: | 2.3% (115,558) |
| Castle Hills: | 2.0% (12) |
| Texas: | 0.1% (3,811) |
| Castle Hills: | 1.8% (11) |
| Texas: | 0.5% (24,705) |
Place of birth for U.S.-born residents:
- This state: 2,422
- Other state: 1,002
- Northeast: 169
- Midwest: 302
- South: 334
- West: 189
92.5% of Castle Hills residents lived in the same house 1 years ago.
Out of people who lived in different houses, 48.0% lived in this county.
Out of people who lived in different counties, 22.7% lived in Texas.
| Castle Hills: | 92.5% |
| State average: | 85.7% |
Education attainment for males 25 years and older:
- No schooling: 16
- Nursery to 4th grade: 12
- 5th and 6th grade: 0
- 7th and 8th grade: 65
- 9th grade: 0
- 10th grade: 0
- 11th grade: 0
- 12th grade, no diploma: 20
- High school graduate (or equivalency): 294
- Less than 1 year of college: 80
- Some college more than 1 year, no degree: 189
- Associate degree: 52
- Bachelor's degree: 443
- Master's degree: 315
- Professional school degree: 61
- Doctorate degree: 68

Education attainment for females 25 years and older:
- No schooling: 3
- Nursery to 4th grade: 12
- 5th and 6th grade: 11
- 7th and 8th grade: 0
- 9th grade: 2
- 10th grade: 0
- 11th grade: 63
- 12th grade, no diploma: 0
- High school graduate (or equivalency): 221
- Less than 1 year of college: 101
- Some college more than 1 year, no degree: 124
- Associate degree: 91
- Bachelor's degree: 468
- Master's degree: 175
- Professional school degree: 45
- Doctorate degree: 23


Housing units in structures:
- One, detached: 1,618
- One, attached: 26
- 5 to 9: 43
- 10 to 19: 40
- 20 to 49: 49
- 50 or more: 230
- Mobile homes: 13
Housing units lacking complete kitchen facilities in 2022: 6.5%
House/condo owner moved in on average 12 years ago
Renter moved in on average 0 years ago

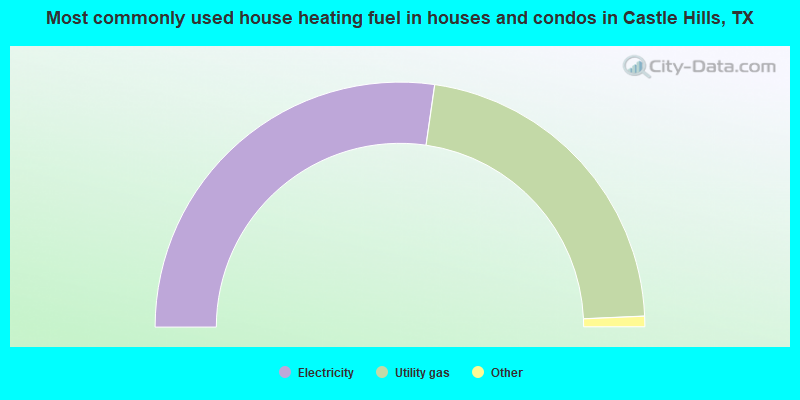
- 54.6%Electricity
- 44.1%Utility gas
- 0.6%Bottled, tank, or LP gas
- 0.4%Solar energy
- 0.2%Wood
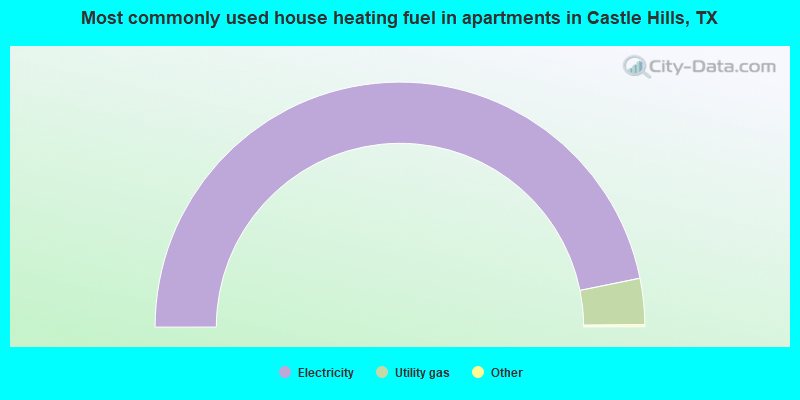
- 93.9%Electricity
- 6.1%Utility gas
Private vs. public school enrollment:
| Here: | 26.3% |
| Texas: | 8.8% |
| Here: | 39.1% |
| Texas: | 8.0% |
| Here: | 11.9% |
| Texas: | 16.2% |


