Housing density: 439 houses/condos per square mile
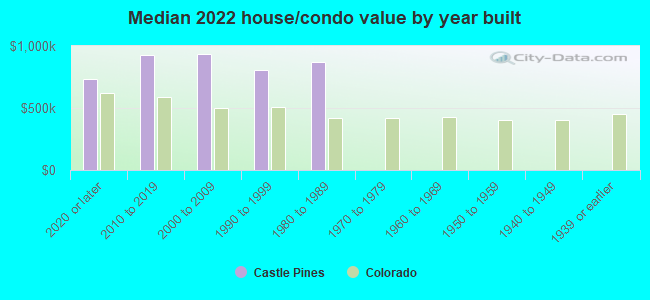
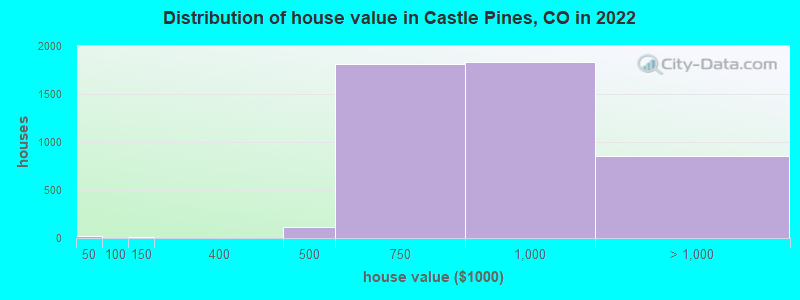
Median price asked for vacant for-sale houses and condos in 2022: $2,187,941.
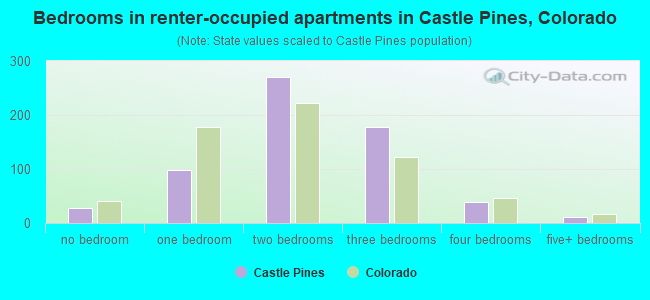
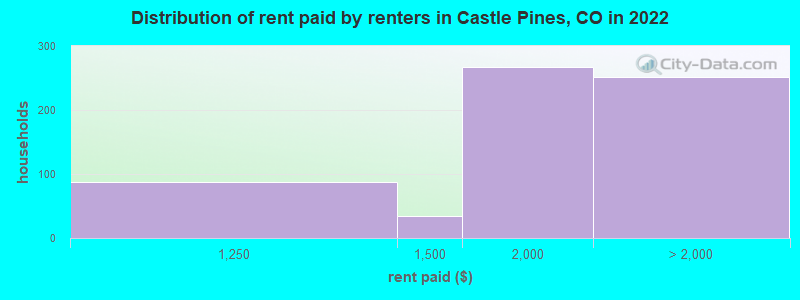
Median contract rent in 2022: over $1,854
Median rent asked for vacant for-rent units in 2022: $393
Median gross rent in Castle Pines, CO in 2022: over $1,935
Housing units in Castle Pines with a mortgage: 2,833 (485 second mortgage, 27 home equity loan, 364 both second mortgage and home equity loan) Houses without a mortgage: 87
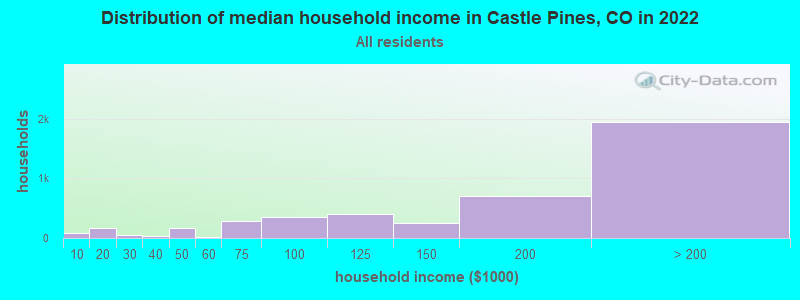
Median household income for houses/condos with a mortgage: $218,414
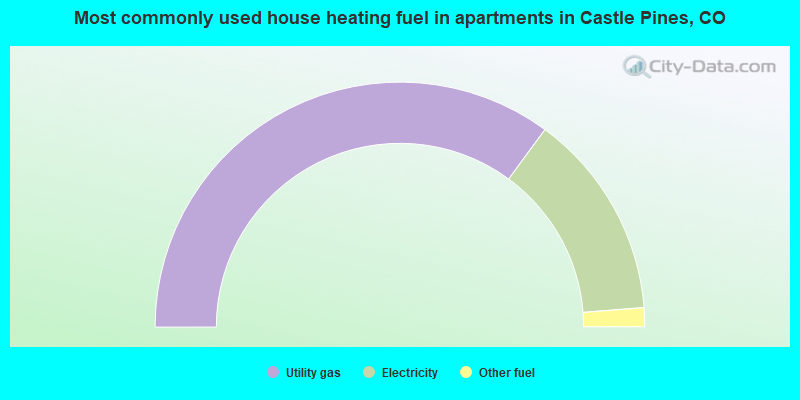
Median household income for apartments without a mortgage: $195,084
Median monthly housing costs: $2,687
Compare current foreclosures near Castle Pines, CO:
Size of family households: 1,598 2-persons, 1,007 3-persons, 812 4-persons, 194 5-persons, 61 6-persons, 12 7-or-more-persons.
Size of nonfamily households: 429 1-person, 226 2-persons, 6 3-persons.
2,228 married couples with children.
265 single-parent households (70 men, 195 women).
89.4% of residents of Castle Pines speak English at home.
2.9% of residents speak Spanish at home (60% speak English very well, 29% speak English well, 11% speak English not well).
3.4% of residents speak other Indo-European language at home (98% speak English very well, 2% speak English well).
2.3% of residents speak Asian or Pacific Island language at home (85% speak English very well, 15% speak English well).
2.2% of residents speak other language at home (60% speak English very well, 40% speak English well).
Foreign born population: 1,492 (12.1%)
(45.2% of them are naturalized citizens)
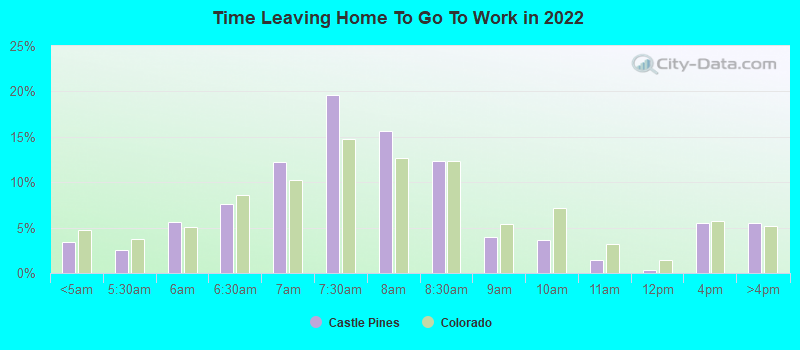
Percentage of workers working in this county: 65.3% Number of people working at home: 2,316 (34.4% of all workers)
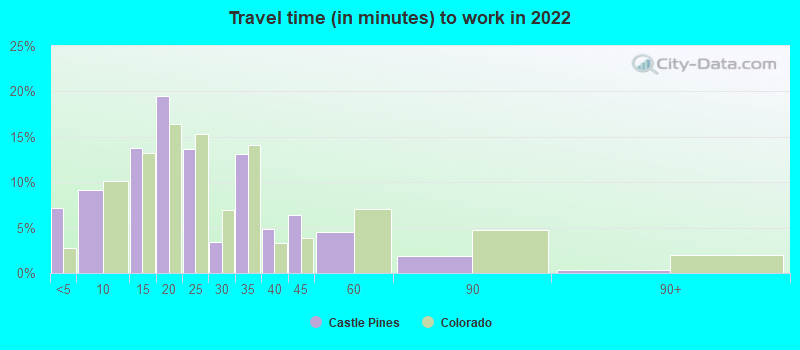
Travel time to work (commute)
Less than 5 minutes: 143
5 to 9 minutes: 346
10 to 14 minutes: 376
15 to 19 minutes: 926
20 to 24 minutes: 649
25 to 29 minutes: 277
30 to 34 minutes: 466
35 to 39 minutes: 140
40 to 44 minutes: 432
45 to 59 minutes: 452
60 to 89 minutes: 127
90 or more minutes: 57
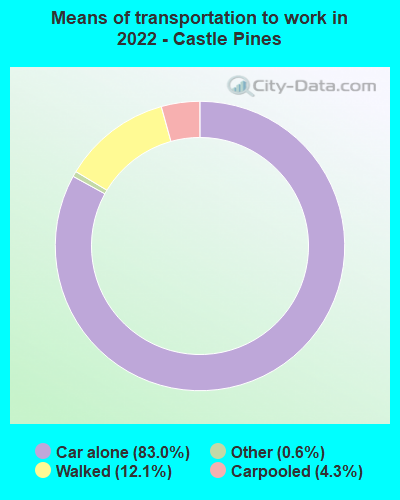
Means of transportation to work:
Drove a car alone: 1,894 (42.6%)
Carpooled: 111 (2.5%)
Taxi: 13 (0.3%)
Walked: 257 (5.8%)
Worked at home: 2,316 (52.0%)
Unemployment by race in 2022
Unemployment rate for White non-Hispanic residents
2.0%Males
3.9%Females
Unemployment rate for other race residents
37.1%Males
Unemployment rate for Hispanic or Latino residents
26.6%Males
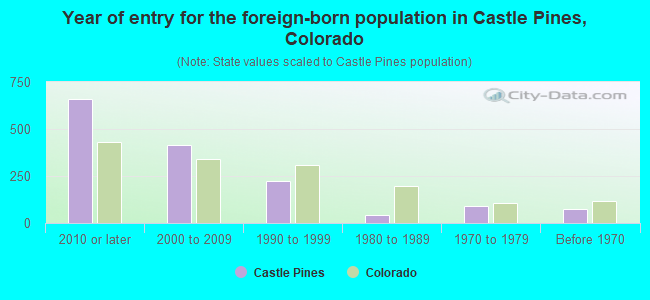
Year of entry for the foreign-born population in Castle Pines, Colorado
6612010 or later
4132000 to 2009
2251990 to 1999
401980 to 1989
881970 to 1979
76Before 1970
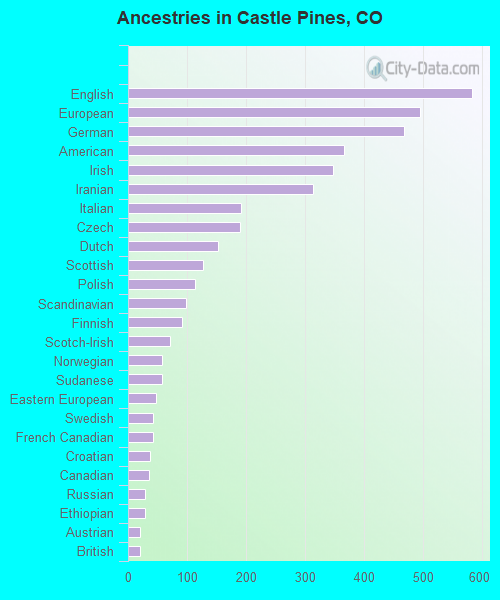
First ancestries reported:
English: 582 (10.2%)
European: 494 (8.7%)
German: 467 (8.2%)
American: 365 (6.4%)
Irish: 347 (6.1%)
Iranian: 313 (5.5%)
Italian: 191 (3.4%)
Czech: 190 (3.3%)
Dutch: 153 (2.7%)
Scottish: 127 (2.2%)
Polish: 113 (2.0%)
Scandinavian: 98 (1.7%)
Finnish: 91 (1.6%)
Scotch-Irish: 71 (1.2%)
Norwegian: 58 (1.0%)
Sudanese: 58 (1.0%)
Eastern European: 47 (0.8%)
Swedish: 43 (0.8%)
French Canadian: 42 (0.7%)
Croatian: 38 (0.7%)
Canadian: 35 (0.6%)
Russian: 28 (0.5%)
Ethiopian: 28 (0.5%)
Austrian: 21 (0.4%)
British: 21 (0.4%)
Czechoslovakian: 14 (0.2%)
Brazilian: 11 (0.2%)
Luxembourger: 11 (0.2%)
Portuguese: 10 (0.2%)
French: 8 (0.1%)
Lithuanian: 7 (0.1%)
Northern European: 7 (0.1%)
Yugoslavian: 6 (0.1%)
Hungarian: 2 (0.04%)
Most common places of birth for foreign-born residents (%):
Philippines
Castle Pines:
18.8% (261)
Colorado:
2.3% (12,342)
Venezuela
Castle Pines:
15.5% (214)
Colorado:
0.9% (4,829)
Sudan
Castle Pines:
15.4% (213)
Colorado:
0.4% (2,099)
Iran
Castle Pines:
14.9% (206)
Colorado:
0.7% (3,568)
India
Castle Pines:
7.4% (103)
Colorado:
4.0% (21,689)
Spain
Castle Pines:
4.8% (66)
Colorado:
0.3% (1,788)
Mexico
Castle Pines:
3.6% (50)
Colorado:
38.3% (209,491)
Canada
Castle Pines:
3.3% (46)
Colorado:
2.7% (15,026)
Tanzania
Castle Pines:
2.8% (39)
Colorado:
0.0% (213)
England
Castle Pines:
2.6% (36)
Colorado:
1.2% (6,672)
Russia
Castle Pines:
2.3% (32)
Colorado:
1.4% (7,860)
Ethiopia
Castle Pines:
2.2% (31)
Colorado:
1.9% (10,372)
Poland
Castle Pines:
1.6% (22)
Colorado:
0.9% (4,772)
Place of birth for U.S.-born residents:
This state: 4,099
Other state: 6,604
Northeast: 646
Midwest: 2,535
South: 1,604
West: 1,815
88.0% of Castle Pines residents lived in the same house 1 years ago. Out of people who lived in different houses, 41.2% lived in this county. Out of people who lived in different counties, 60.8% lived in Colorado.
Castle Pines:
88.0%
State average:
83.6%
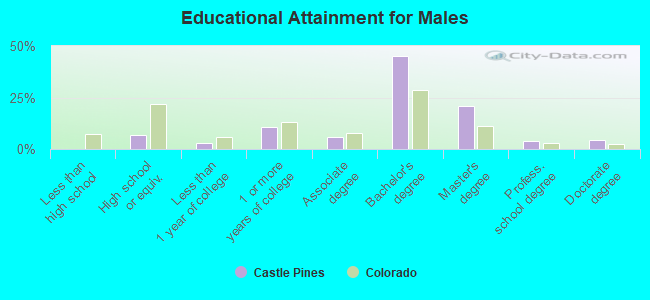
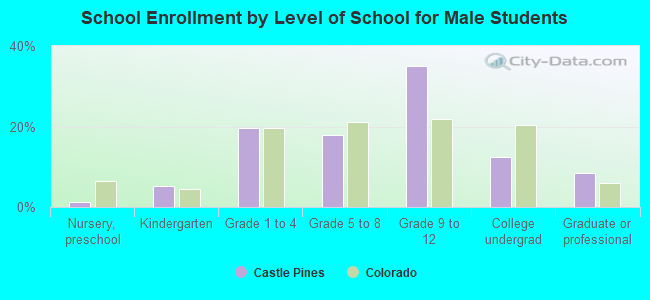
Education attainment for males 25 years and older:
No schooling: 0
Nursery to 4th grade: 0
5th and 6th grade: 0
7th and 8th grade: 6
9th grade: 0
10th grade: 1
11th grade: 0
12th grade, no diploma: 0
High school graduate (or equivalency): 289
Less than 1 year of college: 122
Some college more than 1 year, no degree: 473
Associate degree: 243
Bachelor's degree: 1,958
Master's degree: 898
Professional school degree: 160
Doctorate degree: 183
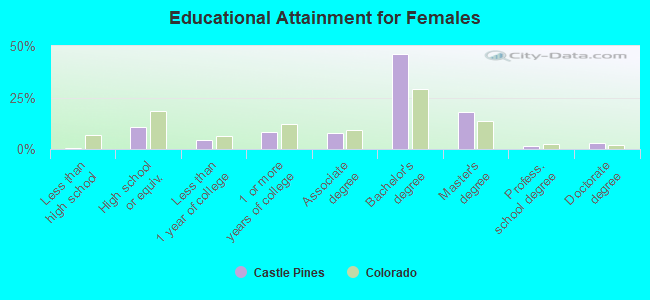
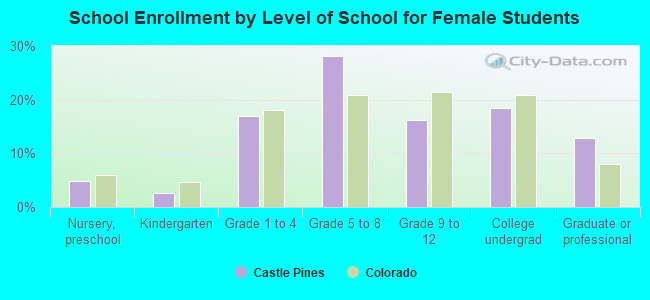
Education attainment for females 25 years and older:
No schooling: 0
Nursery to 4th grade: 0
5th and 6th grade: 0
7th and 8th grade: 0
9th grade: 0
10th grade: 20
11th grade: 0
12th grade, no diploma: 8
High school graduate (or equivalency): 476
Less than 1 year of college: 193
Some college more than 1 year, no degree: 368
Associate degree: 348
Bachelor's degree: 2,047
Master's degree: 790
Professional school degree: 59
Doctorate degree: 135
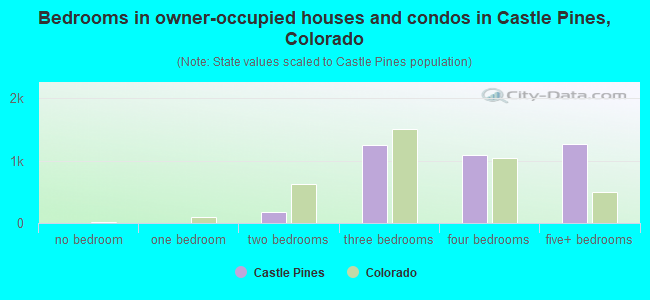
Housing units in structures:
One, detached: 3,811
One, attached: 219
Two: 35
3 or 4: 70
5 to 9: 163
10 to 19: 190
50 or more: 4
Housing units lacking complete kitchen facilities in 2022: 1.4%