Castle Rock, WA (Washington) Houses and Residents
| Castle Rock: | $347,031 |
| Washington: | $569,500 |
Mean price in 2022:
Detached houses: $319,997
Here: $319,997 State: $734,307 Mobile homes: $165,211
Here: $165,211 State: $218,362
Total population: 2,140 (Urban population: 0, Rural population: 2,145 (21 farm, 2,124 nonfarm))
Houses: 1,008 (954 occupied: 639 owner occupied, 320 renter occupied)
| % of renters here: | 33% |
| State: | 36% |
Housing density: 756 houses/condos per square mile
Median price asked for vacant for-sale houses and condos in 2022: $218,357.
Median contract rent in 2022: $942 (lower quartile is $593, upper quartile is $1,252)
Median rent asked for vacant for-rent units in 2022: $979
Median gross rent in Castle Rock, WA in 2022: $1,033
Housing units in Castle Rock with a mortgage: 519 (14 second mortgage, 0 home equity loan, 15 both second mortgage and home equity loan)
Houses without a mortgage: 0
Median household income for houses/condos with a mortgage: $77,906
Median household income for apartments without a mortgage: $60,811
Median monthly housing costs: $1,208
Compare current foreclosures near Castle Rock, WA:
| Photo | Address | Area | Beds / Baths | Price | Details |
|---|---|---|---|---|---|

|
#1
Allen Ave SE
Castle Rock, WA 98611
|
1,334 sq. feet
|
2 baths 3 beds |
show details | |

|
#2
Schutt Rd
Castle Rock, WA 98611
|
1,470 sq. feet
|
1 baths 2 beds |
show details | |

|
#3
Schaffran Rd
Castle Rock, WA 98611
|
1,394 sq. feet
|
2 baths 3 beds |
show details | |

|
#4
Delameter Rd
Castle Rock, WA 98611
|
2,500 sq. feet
|
2 baths 3 beds |
show details | |

|
#5
Hazel Dell Rd
Castle Rock, WA 98611
|
1,100 sq. feet
|
1 baths 2 beds |
show details | |

|
#6
Ph 10
Castle Rock, WA 98611
|
2,054 sq. feet
|
2 baths 3 beds |
show details | |

|
#7
Spirit Lake Hwy
Castle Rock, WA 98611
|
1,620 sq. feet
|
2 baths 3 beds |
show details | |

|
#8
Dublin Dr
Castle Rock, WA 98611
|
1,770 sq. feet
|
2 baths 3 beds |
show details | |

|
#9
Studebaker Pl
Castle Rock, WA 98611
|
1,484 sq. feet
|
1 baths 3 beds |
show details | |

|
#10
Northwood Ct NE
Castle Rock, WA 98611
|
2,160 sq. feet
|
3 baths 4 beds |
show details |
| Photo | Address | Area | Beds / Baths | Price | Details |
|---|---|---|---|---|---|

|
#11
Sandwood Dr
Castle Rock, WA 98611
|
2,464 sq. feet
|
1 baths 3 beds |
show details | |

|
#12
Coal Creek Rd
Longview, WA 98632
|
912 sq. feet
|
1 baths 2 beds |
show details | |

|
#13
Columbia Heights Rd
Longview, WA 98632
|
1,056 sq. feet
|
1 baths 3 beds |
show details | |

|
#14
Hansen Rd
Kalama, WA 98625
|
1,656 sq. feet
|
2 baths 3 beds |
show details | |

|
#15
Laurel St
Winlock, WA 98596
|
548 sq. feet
|
1 baths 1 beds |
show details | |

|
#16
Taylor St
Ryderwood, WA 98581
|
784 sq. feet
|
1 baths 2 beds |
show details | |

|
#17
Cedar Ct
Winlock, WA 98596
|
1,316 sq. feet
|
1 baths 3 beds |
show details | |

|
#18
Ocean Beach Hwy
Longview, WA 98632
|
- sq. feet
|
1 baths 3 beds |
show details | |

|
#19
S 5th Ave
Kelso, WA 98626
|
904 sq. feet
|
1 baths 3 beds |
show details | |

|
#20
Maple St
Longview, WA 98632
|
1,090 sq. feet
|
2 baths 3 beds |
show details |
| Photo | Address | Area | Beds / Baths | Price | Details |
|---|---|---|---|---|---|

|
#21
Sunset Pl
Longview, WA 98632
|
2,658 sq. feet
|
3 baths 3 beds |
show details | |

|
#22
Mason Rd
Silverlake, WA 98645
|
1,782 sq. feet
|
2 baths 3 beds |
show details | |

|
#23
Clark St
Kelso, WA 98626
|
939 sq. feet
|
1 baths 2 beds |
show details | |

|
#24
Tennessee Rd
Winlock, WA 98596
|
1,248 sq. feet
|
2 baths 3 beds |
show details | |

|
#25
Alpha Dr
Longview, WA 98632
|
1,782 sq. feet
|
2 baths 3 beds |
show details | |

|
#26
Vermillion Rd
Kelso, WA 98626
|
1,948 sq. feet
|
2 baths 3 beds |
show details | |

|
#27
Owens Rd
Silverlake, WA 98645
|
2,368 sq. feet
|
2 baths 3 beds |
show details | |

|
#28
Cowlitz Gardens Ln
Kelso, WA 98626
|
- sq. feet
|
1 baths 3 beds |
show details | |

|
#29
Cowlitz Gdns
Kelso, WA 98626
|
1,127 sq. feet
|
1 baths 2 beds |
show details | |

|
#30
Cimarron Dr
Kelso, WA 98626
|
1,852 sq. feet
|
2 baths 3 beds |
show details |
| Photo | Address | Area | Beds / Baths | Price | Details |
|---|---|---|---|---|---|

|
#31
Shadywood Ln
Kelso, WA 98626
|
2,111 sq. feet
|
2 baths 4 beds |
show details | |

|
#32
Ostrander Rd
Kelso, WA 98626
|
1,568 sq. feet
|
2 baths 3 beds |
show details | |

|
#33
Morse St
Ryderwood, WA 98581
|
1,008 sq. feet
|
2 baths 2 beds |
show details | |

|
#34
Maple St
Longview, WA 98632
|
1,414 sq. feet
|
2 baths 3 beds |
show details | |

|
#35
Dorothy St
Longview, WA 98632
|
1,655 sq. feet
|
2 baths 4 beds |
show details | |

|
#36
Horizon Ct
Longview, WA 98632
|
1,157 sq. feet
|
2 baths 2 beds |
show details | |

|
#37
Island Dr
Longview, WA 98632
|
2,150 sq. feet
|
2 baths 3 beds |
show details | |

|
#38
Larch St
Longview, WA 98632
|
1,110 sq. feet
|
1 baths 3 beds |
show details | |

|
#39
Cedar Dr
Rainier, OR 97048
|
2,000 sq. feet
|
2 baths 3 beds |
show details | |

|
#40
Harrison Rd
Kelso, WA 98626
|
2,024 sq. feet
|
2 baths 2 beds |
show details |
| Photo | Address | Area | Beds / Baths | Price | Details |
|---|---|---|---|---|---|

|
#41
19th Ave
Longview, WA 98632
|
2,106 sq. feet
|
3 baths 4 beds |
show details | |

|
#42
31st Ave
Longview, WA 98632
|
1,056 sq. feet
|
1 baths 3 beds |
show details | |

|
#43
S 4th Ave
Kelso, WA 98626
|
1,768 sq. feet
|
1 baths 3 beds |
show details | |

|
#44
Fir St
Longview, WA 98632
|
1,426 sq. feet
|
1 baths 4 beds |
show details | |

|
#45
Dover St
Longview, WA 98632
|
948 sq. feet
|
1 baths 2 beds |
show details | |

|
#46
Baltimore St
Longview, WA 98632
|
781 sq. feet
|
1 baths 3 beds |
show details | |

|
#47
Clinton St
Kelso, WA 98626
|
984 sq. feet
|
1 baths 2 beds |
show details | |

|
#48
16th Ave
Longview, WA 98632
|
1,406 sq. feet
|
1 baths 3 beds |
show details | |

|
#49
Old Rainier Rd
Rainier, OR 97048
|
1,485 sq. feet
|
2 baths 2 beds |
show details | |

|
Check over 1 million property listings on Foreclosure.com!
|
browse all offers | |||


 | Salmon Creek vs. Fishers Landing (222 replies) |
| Buying a home in Washington (13 replies) |
| Castle Rock, WA: Livability, Flooding, & Schools? (0 replies) |
| Investing in Ellensburg area, pros and cons? (38 replies) |
| I am looking for apartments in Vancouver, could use some help! (3 replies) |
| Retiring in Southern Washington? (38 replies) |

Median year apartment built: 1973
Household type by relationship:
Households: 2,655- Male householders: 421 (101 living alone), Female householders: 531 (197 living alone)
492 spouses (482 opposite-sex spouses), 57 unmarried partners, (50 opposite-sex unmarried partners), 865 children (749 natural, 29 adopted, 86 stepchildren), 153 grandchildren, 19 brothers or sisters, 1 parents, 21 foster children, 46 other relatives, 45 non-relatives
Size of family households: 193 2-persons, 138 3-persons, 193 4-persons, 64 5-persons, 4 6-persons, 42 7-or-more-persons.
Size of nonfamily households: 223 1-person, 54 2-persons.
447 married couples with children.
203 single-parent households (46 men, 157 women).
95.0% of residents of Castle Rock speak English at home.
3.1% of residents speak Spanish at home (85% speak English very well, 15% speak English well).
0.4% of residents speak other Indo-European language at home (100% speak English very well).
0.6% of residents speak Asian or Pacific Island language at home (20% speak English very well, 80% speak English well).
Foreign born population: 47 (1.8%)
(61.7% of them are naturalized citizens)
| Here: | 6.2 |
| State: | 6.5 |
| Here: | 4.3 |
| State: | 3.9 |

- Bedrooms in owner-occupied houses and condos in Castle Rock, Washington
- 10no bedroom
- 181 bedroom
- 662 bedrooms
- 4213 bedrooms
- 864 bedrooms
- 385+ bedrooms

- Bedrooms in renter-occupied apartments in Castle Rock, Washington
- 0no bedroom
- 681 bedroom
- 1942 bedrooms
- 273 bedrooms
- 324 bedrooms
- 05+ bedrooms

- Cars and other vehicles available in Castle Rock in owner-occupied houses/condos
- 29no vehicle
- 1381 vehicle
- 2112 vehicles
- 1853 vehicles
- 294 vehicles
- 495+ vehicles

- Cars and other vehicles available in Castle Rock in renter-occupied apartments
- 40no vehicle
- 1291 vehicle
- 1262 vehicles
- 223 vehicles
- 44 vehicles
- 05+ vehicles

- Rooms in owner-occupied houses in Castle Rock, Washington
- 101 room
- 182 rooms
- 163 rooms
- 274 rooms
- 1085 rooms
- 1896 rooms
- 1117 rooms
- 828 rooms
- 799+ rooms

- Rooms in renter-occupied apartments in Castle Rock, Washington
- 01 room
- 112 rooms
- 863 rooms
- 1174 rooms
- 585 rooms
- 376 rooms
- 07 rooms
- 118 rooms
- 09+ rooms


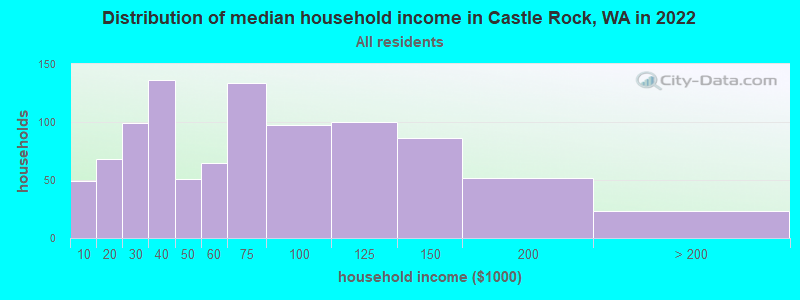
Castle Rock, WA household income distribution

- 49Less than $10,000
- 68$10,000 to $19,999
- 99$20,000 to $29,999
- 136$30,000 to $39,999
- 51$40,000 to $49,999
- 65$50,000 to $59,999
- 134$60,000 to $74,999
- 97$75,000 to $99,999
- 100$100,000 to $124,999
- 86$125,000 to $149,999
- 52$150,000 to $199,999
- 23$200,000 or more
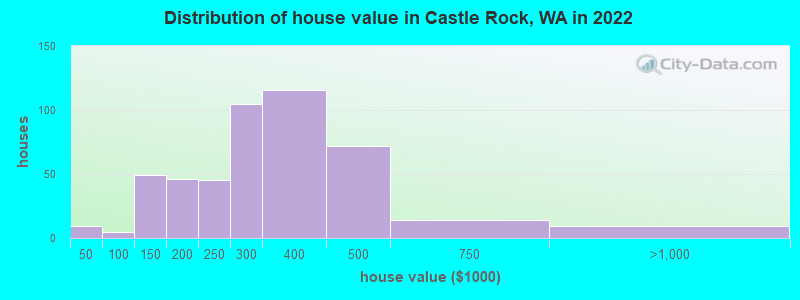
Home value of owner - occupied houses in 2022 in Castle Rock, WA
-
- 4$20,000 to $24,999
- 4$40,000 to $49,999
- 38$100,000 to $124,999
- 9$125,000 to $149,999
- 21$150,000 to $174,999
- 24$175,000 to $199,999
- 44$200,000 to $249,999
- 104$250,000 to $299,999
- 116$300,000 to $399,999
- 71$400,000 to $499,999
- 13$500,000 to $749,999
- 8$750,000 to $999,999
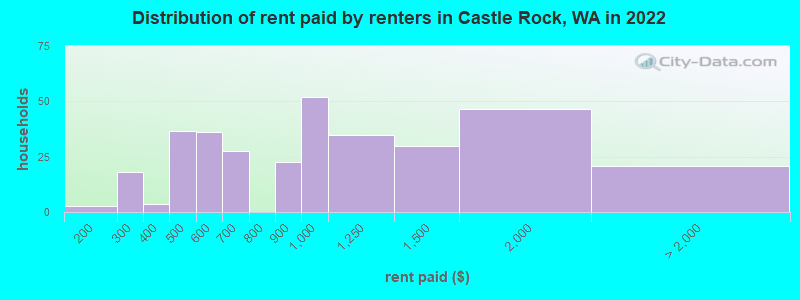
Rent paid by renters in 2022 in Castle Rock, WA
-
- 2$150 to $199
- 11$200 to $249
- 6$250 to $299
- 3$300 to $349
- 36$400 to $449
- 29$500 to $549
- 6$550 to $599
- 9$600 to $649
- 18$650 to $699
- 22$800 to $899
- 51$900 to $999
- 34$1,000 to $1,249
- 29$1,250 to $1,499
- 46$1,500 to $1,999
- 20No cash rent

Percentage of workers working in this county: 84.9%
Number of people working at home: 76 (8.5% of all workers)
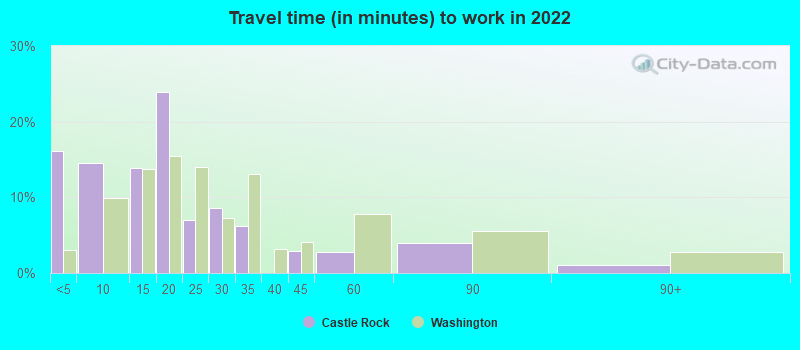
Travel time to work (commute)
- Less than 5 minutes: 34
- 5 to 9 minutes: 66
- 10 to 14 minutes: 78
- 15 to 19 minutes: 64
- 20 to 24 minutes: 232
- 25 to 29 minutes: 98
- 30 to 34 minutes: 122
- 35 to 39 minutes: 3
- 40 to 44 minutes: 59
- 45 to 59 minutes: 15
- 60 to 89 minutes: 17
- 90 or more minutes: 35
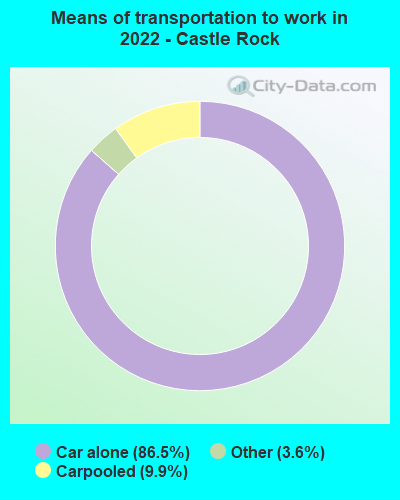
Means of transportation to work:
- Drove a car alone: 567 (76.0%)
- Carpooled: 67 (9.0%)
- Taxi: 22 (2.9%)
- Worked at home: 76 (10.2%)

- Unemployment by race in 2022
- Unemployment rate for White non-Hispanic residents
- 2.4%Males
- 9.3%Females
- Unemployment rate for American Indian and Alaska Native residents
- 68.7%Females
- Unemployment rate for other race residents
- 100.0%Males
- 100.0%Females
- Unemployment rate for Hispanic or Latino residents
- 36.4%Males
- 9.7%Females

- Year of entry for the foreign-born population in Castle Rock, Washington
- 122010 or later
- 32000 to 2009
- 241990 to 1999
- 01980 to 1989
- 31970 to 1979
- 15Before 1970

First ancestries reported:
- English: 173 (17.6%)
- American: 120 (12.2%)
- Irish: 102 (10.4%)
- French: 94 (9.6%)
- European: 65 (6.6%)
- German: 61 (6.2%)
- Italian: 24 (2.4%)
- Russian: 13 (1.3%)
- Norwegian: 12 (1.2%)
- Greek: 9 (0.9%)
- Scottish: 4 (0.4%)
Most common places of birth for foreign-born residents (%):
| Castle Rock: | 36.7% (18) |
| Washington: | 1.9% (21,540) |
| Castle Rock: | 16.3% (8) |
| Washington: | 0.4% (4,914) |
| Castle Rock: | 14.3% (7) |
| Washington: | 21.1% (241,655) |
| Castle Rock: | 8.2% (4) |
| Washington: | 6.3% (71,661) |
| Castle Rock: | 8.2% (4) |
| Washington: | 7.4% (84,470) |
| Castle Rock: | 6.1% (3) |
| Washington: | 0.7% (8,049) |
Place of birth for U.S.-born residents:
- This state: 1,669
- Other state: 881
- Northeast: 5
- Midwest: 102
- South: 66
- West: 713
86.4% of Castle Rock residents lived in the same house 1 years ago.
Out of people who lived in different houses, 41.7% lived in this county.
Out of people who lived in different counties, 57.3% lived in Washington.
| Castle Rock: | 86.4% |
| State average: | 85.2% |
Education attainment for males 25 years and older:
- No schooling: 0
- Nursery to 4th grade: 0
- 5th and 6th grade: 17
- 7th and 8th grade: 8
- 9th grade: 0
- 10th grade: 30
- 11th grade: 26
- 12th grade, no diploma: 0
- High school graduate (or equivalency): 289
- Less than 1 year of college: 37
- Some college more than 1 year, no degree: 99
- Associate degree: 121
- Bachelor's degree: 34
- Master's degree: 46
- Professional school degree: 0
- Doctorate degree: 1

Education attainment for females 25 years and older:
- No schooling: 0
- Nursery to 4th grade: 8
- 5th and 6th grade: 6
- 7th and 8th grade: 0
- 9th grade: 17
- 10th grade: 0
- 11th grade: 0
- 12th grade, no diploma: 4
- High school graduate (or equivalency): 303
- Less than 1 year of college: 86
- Some college more than 1 year, no degree: 202
- Associate degree: 137
- Bachelor's degree: 124
- Master's degree: 28
- Professional school degree: 3
- Doctorate degree: 0


Housing units in structures:
- One, detached: 736
- Two: 90
- 3 or 4: 13
- 5 to 9: 13
- 10 to 19: 13
- 20 to 49: 44
- 50 or more: 26
- Mobile homes: 71
Median worth of mobile homes: $211,918
Housing units lacking complete kitchen facilities in 2022: 0.3%
House/condo owner moved in on average 8 years ago
Renter moved in on average 2 years ago

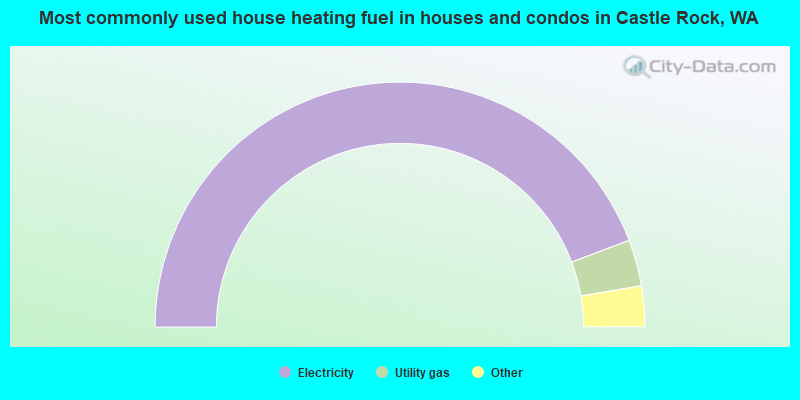
- 88.7%Electricity
- 6.1%Utility gas
- 2.9%Bottled, tank, or LP gas
- 1.1%Wood
- 0.6%Other fuel
- 0.6%No fuel used
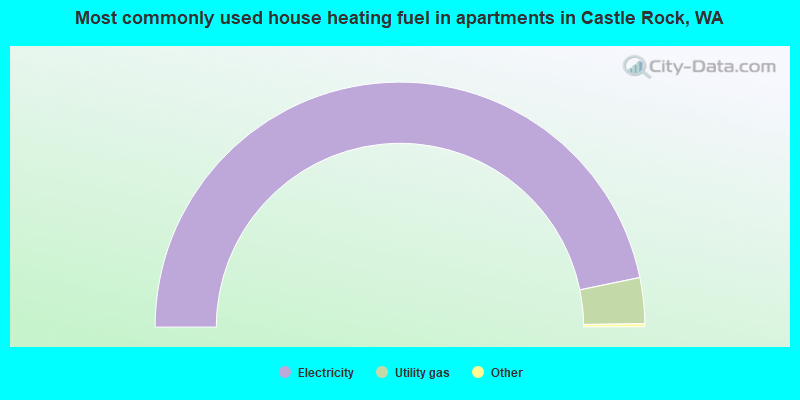
- 93.9%Electricity
- 6.1%Utility gas
Private vs. public school enrollment:
| Here: | 4.5% |
| Washington: | 12.4% |
| Here: | 1.3% |
| Washington: | 9.2% |
| Here: | 0.0% |
| Washington: | 16.5% |


