Jump to a detailed profile or search site with Google Custom Search

Cathedral City, CA (California) Houses and Residents

Estimated median house or condo value in 2022: $458,094 (it was $113,600 in 2000)
Cathedral City:

$458,094
California:

$715,900
Lower value quartile - upper value quartile: $329,650 - $570,574

Mean price in 2022:

Detached houses: $577,204
Here:

$577,204
State:

$988,808

Townhouses or other attached units: $465,119
Here:

$465,119
State:

$838,546

In 2-unit structures: $343,797
Here:

$343,797
State:

$1,138,100

In 3-to-4-unit structures: $322,021
Here:

$322,021
State:

$824,253

In 5-or-more-unit structures: $442,424
Here:

$442,424
State:

$730,996

Mobile homes: $118,419
Here:

$118,419
State:

$184,506

Occupied boats, RVs, vans, etc.: $90,169
Here:

$90,169
State:

$204,957

Total population: 53,437 (Urban population: 42,698, Rural population: 221 (all nonfarm))

Houses: 23,801 (19,229 occupied: 12,448 owner occupied, 6,910 renter occupied)

% of renters here:

36%
State:

44%

Housing density: 1,241 houses/condos per square mile

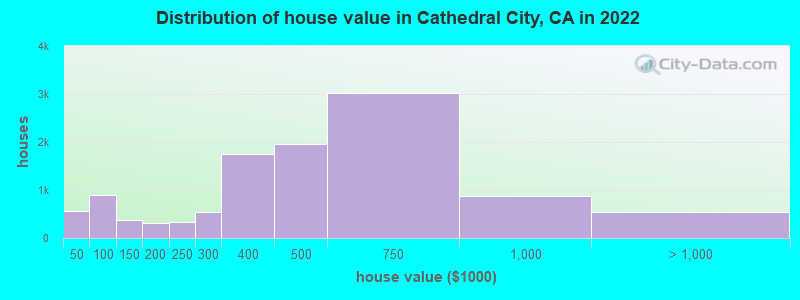
Median price asked for vacant for-sale houses and condos in 2022: $404,094.

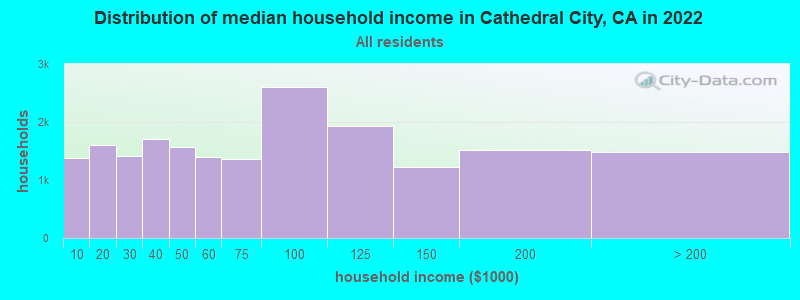
Median contract rent in 2022: $1,287 (lower quartile is $921, upper quartile is $1,738)


Median rent asked for vacant for-rent units in 2022: $2,522


Median gross rent in Cathedral City, CA in 2022: $1,488

Housing units in Cathedral City with a mortgage: 7,465 (407 second mortgage, 45 home equity loan, 298 both second mortgage and home equity loan)
Houses without a mortgage: 255

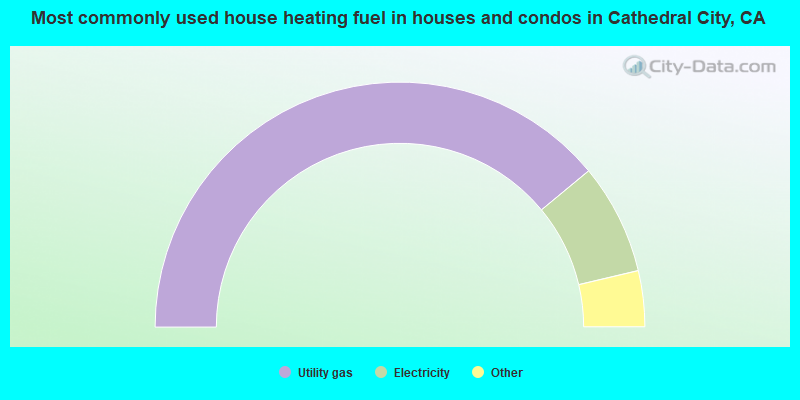
Median household income for houses/condos with a mortgage: $92,071

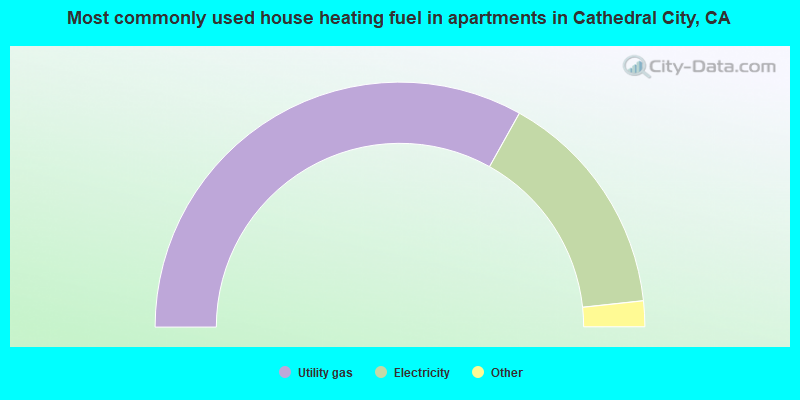
Median household income for apartments without a mortgage: $58,992

Median monthly housing costs: $1,520

Compare current foreclosures in Cathedral City, CA:

Check out more offers in Cathedral City, CA.
Powered by Foreclosure.com

Settings
X
Data:
Loading data...
Based on 2000-2022 data
Loading data...

123
Hide US histogram

Cathedral City, California Age and Sex of Residents
Median year house/condo built: 1988

Median year apartment built: 1987

Household type by relationship:

Households: 52,913
  • Male householders: 10,168 (3,213 living alone), Female householders: 9,044 (2,675 living alone)
  • 8,723 spouses (7,813 opposite-sex spouses), 1,263 unmarried partners, (843 opposite-sex unmarried partners), 15,055 children (14,164 natural, 372 adopted, 518 stepchildren), 1,487 grandchildren, 1,244 brothers or sisters, 1,361 parents, 0 foster children, 2,271 other relatives, 1,752 non-relatives
  • In group quarters: 540

Size of family households: 4,861 2-persons, 2,607 3-persons, 2,050 4-persons, 1,590 5-persons, 537 6-persons, 540 7-or-more-persons.

Size of nonfamily households: 5,708 1-person, 1,219 2-persons, 109 3-persons, 48 4-persons, 3 5-persons.

5,995 married couples with children.
2,340 single-parent households (622 men, 1,718 women).

47.3% of residents of Cathedral City speak English at home.
46.0% of residents speak Spanish at home (71% speak English very well, 14% speak English well, 12% speak English not well, 3% don't speak English at all).
1.7% of residents speak other Indo-European language at home (78% speak English very well, 13% speak English well, 9% speak English not well).
4.9% of residents speak Asian or Pacific Island language at home (48% speak English very well, 40% speak English well, 8% speak English not well, 4% don't speak English at all).
0.5% of residents speak other language at home (89% speak English very well, 11% speak English well).

Foreign born population: 15,832 (29.9%)
(53.5% of them are naturalized citizens)

Median number of rooms in houses and condos:
Here:

5.2
State:

6.0

Median number of rooms in apartments
Here:

4.1
State:

3.9

Owner-occupied Renter-occupied
Bedrooms in owner-occupied houses and condos in Cathedral City, California
  • Bedrooms in owner-occupied houses and condos in Cathedral City, California
  • 89no bedroom
  • 4641 bedroom
  • 3,1022 bedrooms
  • 6,1623 bedrooms
  • 2,3844 bedrooms
  • 2475+ bedrooms
Bedrooms in renter-occupied apartments in Cathedral City, California
  • Bedrooms in renter-occupied apartments in Cathedral City, California
  • 344no bedroom
  • 1,3091 bedroom
  • 2,5002 bedrooms
  • 2,3423 bedrooms
  • 3874 bedrooms
  • 285+ bedrooms
Owner-occupied Renter-occupied
Cars and other vehicles available in Cathedral City in owner-occupied houses/condos
  • Cars and other vehicles available in Cathedral City in owner-occupied houses/condos
  • 271no vehicle
  • 3,8071 vehicle
  • 4,5062 vehicles
  • 2,3133 vehicles
  • 9604 vehicles
  • 5915+ vehicles
Cars and other vehicles available in Cathedral City in renter-occupied apartments
  • Cars and other vehicles available in Cathedral City in renter-occupied apartments
  • 864no vehicle
  • 2,5171 vehicle
  • 1,8582 vehicles
  • 1,0493 vehicles
  • 5704 vehicles
  • 525+ vehicles
Owner-occupied Renter-occupied
Rooms in owner-occupied houses in Cathedral City, California
  • Rooms in owner-occupied houses in Cathedral City, California
  • 791 room
  • 1322 rooms
  • 5443 rooms
  • 2,3784 rooms
  • 3,7685 rooms
  • 2,8396 rooms
  • 1,3187 rooms
  • 7568 rooms
  • 6339+ rooms
Rooms in renter-occupied apartments in Cathedral City, California
  • Rooms in renter-occupied apartments in Cathedral City, California
  • 3331 room
  • 5432 rooms
  • 1,4003 rooms
  • 1,9804 rooms
  • 1,6495 rooms
  • 6146 rooms
  • 1077 rooms
  • 2208 rooms
  • 659+ rooms
Year house built
Median 2022 house/condo value by year built
Median house/condo value by year householder moved into unit
Breakdown of mean house values by ages of householders
Owners and renters by unit type in Cathedral City, CA
  • Cathedral City, CA household income distribution

  • Distribution of median household income in Cathedral City, CA in 2022
  • 1,382Less than $10,000
  • 1,607$10,000 to $19,999
  • 1,417$20,000 to $29,999
  • 1,702$30,000 to $39,999
  • 1,561$40,000 to $49,999
  • 1,403$50,000 to $59,999
  • 1,354$60,000 to $74,999
  • 2,602$75,000 to $99,999
  • 1,931$100,000 to $124,999
  • 1,227$125,000 to $149,999
  • 1,519$150,000 to $199,999
  • 1,477$200,000 or more
  • Home value of owner - occupied houses in 2022 in Cathedral City, CA

  • Distribution of house value in Cathedral City, CA in 2022
  • 111Less than $10,000
  • 36$10,000 to $14,999
  • 21$15,000 to $19,999
  • 37$20,000 to $24,999
  • 70$25,000 to $29,999
  • 25$30,000 to $34,999
  • 104$35,000 to $39,999
  • 147$40,000 to $49,999
  • 249$50,000 to $59,999
  • 170$60,000 to $69,999
  • 130$70,000 to $79,999
  • 134$80,000 to $89,999
  • 57$90,000 to $99,999
  • 273$100,000 to $124,999
  • 111$125,000 to $149,999
  • 221$150,000 to $174,999
  • 86$175,000 to $199,999
  • 333$200,000 to $249,999
  • 549$250,000 to $299,999
  • 1,742$300,000 to $399,999
  • 1,958$400,000 to $499,999
  • 3,031$500,000 to $749,999
  • 878$750,000 to $999,999
  • 238$1,000,000 to $1,499,999
  • 102$1,500,000 to $1,999,999
  • 202$2,000,000 or more
  • Rent paid by renters in 2022 in Cathedral City, CA

  • Distribution of rent paid by renters in Cathedral City, CA in 2022
  • 3Less than $100
  • 5$100 to $149
  • 32$150 to $199
  • 281$200 to $249
  • 65$250 to $299
  • 111$300 to $349
  • 55$350 to $399
  • 13$400 to $449
  • 27$450 to $499
  • 182$500 to $549
  • 21$550 to $599
  • 100$600 to $649
  • 79$650 to $699
  • 242$700 to $749
  • 55$750 to $799
  • 416$800 to $899
  • 409$900 to $999
  • 1,276$1,000 to $1,249
  • 982$1,250 to $1,499
  • 1,309$1,500 to $1,999
  • 631$2,000 to $2,499
  • 140$2,500 to $2,999
  • 39$3,000 to $3,499
  • 22$3,500 or more
  • 222No cash rent
Time Leaving Home To Go To Work in 2022

Percentage of workers working in this county: 95.3%
Number of people working at home: 2,499 (10.0% of all workers)

Travel time (in minutes) to work in 2022

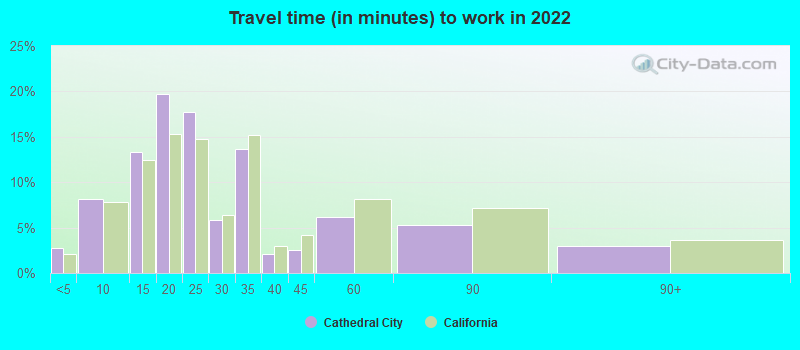
Travel time to work (commute)

  • Less than 5 minutes: 481
  • 5 to 9 minutes: 1,673
  • 10 to 14 minutes: 3,941
  • 15 to 19 minutes: 5,626
  • 20 to 24 minutes: 5,607
  • 25 to 29 minutes: 1,703
  • 30 to 34 minutes: 1,851
  • 35 to 39 minutes: 264
  • 40 to 44 minutes: 159
  • 45 to 59 minutes: 352
  • 60 to 89 minutes: 449
  • 90 or more minutes: 394
Means of transportation to work in 2022 - Cathedral City

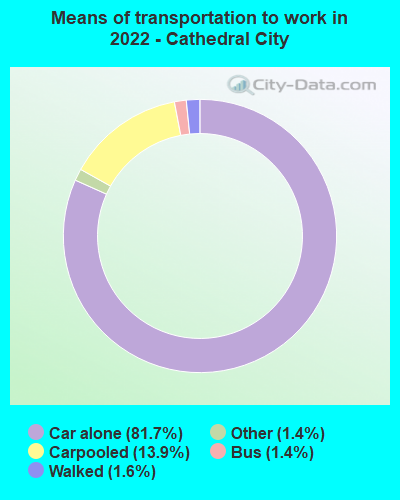
Means of transportation to work:

  • Drove a car alone: 11,313 (68.8%)
  • Carpooled: 2,095 (12.7%)
  • Bus: 170 (1.0%)
  • Taxi: 195 (1.2%)
  • Bicycle: 1 (0.0%)
  • Walked: 226 (1.4%)
  • Worked at home: 2,499 (15.2%)
Class of Workers in 2022
  • Unemployment by race in 2022
  • Unemployment rate for White non-Hispanic residents
  • 6.7%Males
  • 7.3%Females
  • Unemployment rate for Black residents
  • 5.2%Males
  • 25.1%Females
  • Unemployment rate for American Indian and Alaska Native residents
  • 7.4%Males
  • 25.4%Females
  • Unemployment rate for Asian residents
  • 0.9%Males
  • 10.7%Females
  • Unemployment rate for other race residents
  • 7.3%Males
  • 0.7%Females
  • Unemployment rate for two or more race residents
  • 0.9%Males
  • 2.2%Females
  • Unemployment rate for Hispanic or Latino residents
  • 4.8%Males
  • 2.9%Females
Year of entry for the foreign-born population in Cathedral City, California
  • Year of entry for the foreign-born population in Cathedral City, California
  • 2,0592010 or later
  • 4,2822000 to 2009
  • 3,9781990 to 1999
  • 4,7571980 to 1989
  • 1,8481970 to 1979
  • 1,223Before 1970
Ancestries in Cathedral City, CA

First ancestries reported:

  • English: 1,298 (3.5%)
  • American: 1,250 (3.4%)
  • German: 1,050 (2.9%)
  • Irish: 857 (2.3%)
  • Italian: 732 (2.0%)
  • Polish: 252 (0.7%)
  • French: 228 (0.6%)
  • European: 194 (0.5%)
  • Canadian: 179 (0.5%)
  • Eastern European: 165 (0.4%)
  • Romanian: 147 (0.4%)
  • Scottish: 145 (0.4%)
  • Scotch-Irish: 137 (0.4%)
  • Norwegian: 119 (0.3%)
  • British: 101 (0.3%)
  • Russian: 85 (0.2%)
  • Belizean: 76 (0.2%)
  • French Canadian: 56 (0.2%)
  • Egyptian: 47 (0.1%)
  • Swedish: 45 (0.1%)
  • African: 40 (0.1%)
  • Scandinavian: 38 (0.1%)
  • Swiss: 37 (0.1%)
  • Greek: 36 (0.10%)
  • Iranian: 36 (0.10%)
  • Dutch: 36 (0.10%)
  • Jamaican: 31 (0.08%)
  • Lebanese: 27 (0.07%)
  • Czech: 27 (0.07%)
  • South African: 27 (0.07%)
  • Hungarian: 26 (0.07%)
  • Belgian: 23 (0.06%)
  • Armenian: 22 (0.06%)
  • Yugoslavian: 17 (0.05%)
  • Ukrainian: 16 (0.04%)
  • Welsh: 16 (0.04%)
  • Syrian: 12 (0.03%)
  • Portuguese: 12 (0.03%)
  • Croatian: 12 (0.03%)
  • Northern European: 11 (0.03%)
  • Basque: 11 (0.03%)
  • Nigerian: 8 (0.02%)
  • West Indian: 8 (0.02%)
  • Danish: 5 (0.01%)
  • Czechoslovakian: 5 (0.01%)
  • Austrian: 5 (0.01%)
  • Australian: 5 (0.01%)
  • Finnish: 4 (0.01%)
  • Bulgarian: 4 (0.01%)
  • Brazilian: 4 (0.01%)
  • Cape Verdean: 2 (0.01%)
  • Slovak: 2 (0.01%)

Most common places of birth for foreign-born residents (%):

Mexico
Cathedral City:

58.0% (9,181)
California:

37.2% (3,881,193)

Philippines
Cathedral City:

9.1% (1,444)
California:

7.8% (818,297)

Guatemala
Cathedral City:

6.8% (1,081)
California:

2.8% (290,436)

Canada
Cathedral City:

3.7% (591)
California:

1.2% (127,477)

El Salvador
Cathedral City:

2.9% (464)
California:

4.2% (440,287)

Honduras
Cathedral City:

1.9% (300)
California:

0.6% (66,590)

Place of birth for U.S.-born residents:

  • This state: 27,346
  • Other state: 8,728
  • Northeast: 1,858
  • Midwest: 3,036
  • South: 2,145
  • West: 1,693

92.9% of Cathedral City residents lived in the same house 1 years ago.
   Out of people who lived in different houses, 35.6% lived in this county.
   Out of people who lived in different counties, 75.6% lived in California.


Cathedral City:

92.9%
State average:

88.9%

Education attainment for males 25 years and older:

  • No schooling: 774
  • Nursery to 4th grade: 498
  • 5th and 6th grade: 434
  • 7th and 8th grade: 204
  • 9th grade: 323
  • 10th grade: 266
  • 11th grade: 249
  • 12th grade, no diploma: 994
  • High school graduate (or equivalency): 5,633
  • Less than 1 year of college: 1,120
  • Some college more than 1 year, no degree: 2,855
  • Associate degree: 1,277
  • Bachelor's degree: 3,312
  • Master's degree: 1,199
  • Professional school degree: 718
  • Doctorate degree: 289
Educational Attainment for Males

Education attainment for females 25 years and older:

  • No schooling: 743
  • Nursery to 4th grade: 310
  • 5th and 6th grade: 638
  • 7th and 8th grade: 382
  • 9th grade: 334
  • 10th grade: 230
  • 11th grade: 229
  • 12th grade, no diploma: 707
  • High school graduate (or equivalency): 4,715
  • Less than 1 year of college: 898
  • Some college more than 1 year, no degree: 2,382
  • Associate degree: 1,340
  • Bachelor's degree: 2,684
  • Master's degree: 1,423
  • Professional school degree: 423
  • Doctorate degree: 124
Educational Attainment for Females
Cathedral City marital status for males
Cathedral City marital status for females

Housing units in structures:

  • One, detached: 13,685
  • One, attached: 1,767
  • Two: 1,204
  • 3 or 4: 1,581
  • 5 to 9: 1,224
  • 10 to 19: 775
  • 20 to 49: 389
  • 50 or more: 756
  • Mobile homes: 2,248
  • Boats, RVs, vans, etc.: 169

Median worth of mobile homes: $104,094

Housing units lacking complete plumbing facilities in 2022: 0.5%

Housing units lacking complete kitchen facilities in 2022: 0.5%

House/condo owner moved in on average 11 years ago

Renter moved in on average 5 years ago

Year householders moved into residence in Cathedral City
Houses and condos Apartments
Most commonly used house heating fuel in houses and condos in Cathedral City, CA
  • 78.0%Utility gas
  • 14.6%Electricity
  • 2.7%Bottled, tank, or LP gas
  • 2.2%Solar energy
  • 1.7%No fuel used
  • 0.8%Wood
Most commonly used house heating fuel in apartments in Cathedral City, CA
  • 66.3%Utility gas
  • 30.4%Electricity
  • 1.7%No fuel used
  • 1.4%Bottled, tank, or LP gas
  • 0.2%Other fuel

Private vs. public school enrollment:

Students in private schools in grades 1 to 8 (elementary and middle school): 167
Here:

3.7%
California:

10.5%

Students in private schools in grades 9 to 12 (high school): 141
Here:

5.1%
California:

8.5%

Students in private undergraduate colleges: 155
Here:

6.0%
California:

15.9%
School Enrollment by Level of School for Male Students
School Enrollment by Level of School for Female Students
Age and Sex of Sensory-Disabled Noninstitutionalized Residents
Age and Sex of Physically-Disabled Noninstitutionalized Residents
Age and Sex of Mentally-Disabled Noninstitutionalized Residents
Age and Sex of Self-Care Disabled Noninstitutionalized Residents
Age and Sex of Go-Outside-Home Disabled Noninstitutionalized Residents
Age and Sex of Noninstitutionalized Residents with Employment Disability