Cayce, SC (South Carolina) Houses and Residents
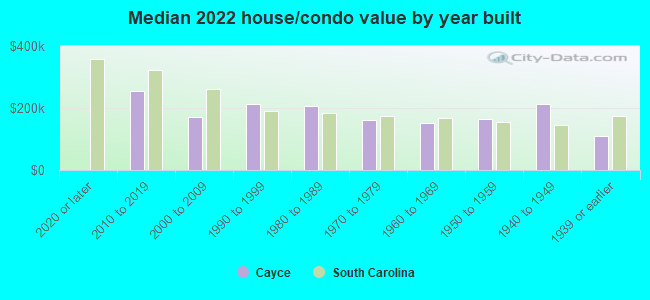
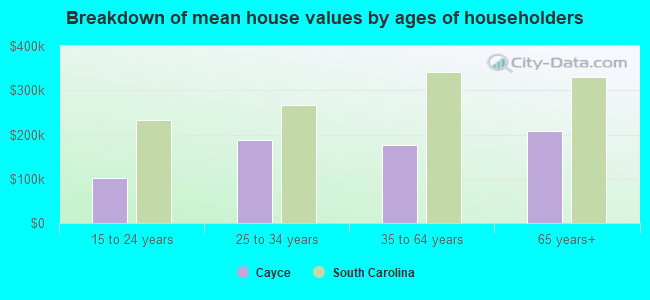
| Cayce: | $166,611 |
| South Carolina: | $254,600 |
Total population: 12,951 (Urban population: 11,601, Rural population: 369 (all nonfarm))
Houses: 7,314 (6,828 occupied: 3,949 owner occupied, 2,873 renter occupied)
| % of renters here: | 42% |
| State: | 28% |
Housing density: 671 houses/condos per square mile
Median price asked for vacant for-sale houses and condos in 2022: $493,940.
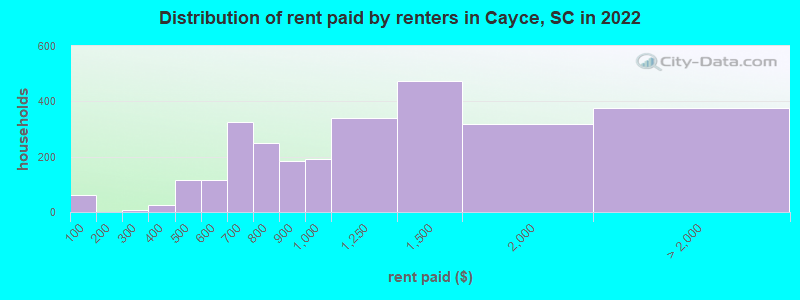
Median contract rent in 2022: $991 (lower quartile is $725, upper quartile is $1,445)
Median rent asked for vacant for-rent units in 2022: $1,222
Median gross rent in Cayce, SC in 2022: $1,235
Housing units in Cayce with a mortgage: 2,205 (181 second mortgage, 0 home equity loan, 185 both second mortgage and home equity loan)
Houses without a mortgage: 168
Median household income for houses/condos with a mortgage: $85,706
Median household income for apartments without a mortgage: $70,720
Median monthly housing costs: $880
Compare current foreclosures near Cayce, SC:
| Photo | Address | Area | Beds / Baths | Price | Details |
|---|---|---|---|---|---|

|
#1
Summerland Dr
Cayce, SC 29033
|
1,122 sq. feet
|
2 baths 3 beds |
show details | |

|
#2
Longleaf Dr
Cayce, SC 29033
|
1,527 sq. feet
|
2 baths 3 beds |
show details | |

|
#3
N Eden Dr
Cayce, SC 29033
|
2,256 sq. feet
|
2 baths 3 beds |
show details | |

|
#4
N Eden Dr
Cayce, SC 29033
|
2,256 sq. feet
|
2 baths 3 beds |
show details | |

|
#5
New State Rd
Cayce, SC 29033
|
1,624 sq. feet
|
1 baths 3 beds |
show details | |

|
#6
Middleton St
Cayce, SC 29033
|
1,740 sq. feet
|
2 baths 3 beds |
show details | |

|
#7
Honeysuckle St
Cayce, SC 29033
|
1,715 sq. feet
|
1 baths 3 beds |
show details | |

|
#8
Northland Dr
Cayce, SC 29033
|
1,186 sq. feet
|
1 baths 3 beds |
show details | |

|
#9
Memorial Dr
Cayce, SC 29033
|
1,509 sq. feet
|
1 baths 2 beds |
show details | |

|
#10
Hudson Ave
Cayce, SC 29033
|
1,075 sq. feet
|
1 baths 3 beds |
show details |
| Photo | Address | Area | Beds / Baths | Price | Details |
|---|---|---|---|---|---|

|
#11
Hudson Ave
Cayce, SC 29033
|
1,014 sq. feet
|
1 baths 3 beds |
show details | |

|
#12
Elm St
Cayce, SC 29033
|
1,320 sq. feet
|
2 baths 3 beds |
show details | |

|
#13
Wilkinson St Apt 9b
Cayce, SC 29033
|
- sq. feet
|
- baths - beds |
show details | |

|
#14
Tufton Ct
Cayce, SC 29033
|
- sq. feet
|
- baths - beds |
show details | |

|
#15
Memorial Dr
Cayce, SC 29033
|
- sq. feet
|
- baths - beds |
show details | |

|
#16
Tufton Ct
Cayce, SC 29033
|
- sq. feet
|
- baths - beds |
show details | |

|
#17
Fort Congaree Trl # 1924
Cayce, SC 29033
|
- sq. feet
|
- baths - beds |
show details | |

|
#18
Manley St
Cayce, SC 29033
|
- sq. feet
|
- baths - beds |
show details | |

|
#19
Knox Abbott Dr # 1102
Cayce, SC 29033
|
- sq. feet
|
- baths - beds |
show details | |

|
#20
Lyles St
Cayce, SC 29033
|
- sq. feet
|
- baths - beds |
show details |
| Photo | Address | Area | Beds / Baths | Price | Details |
|---|---|---|---|---|---|

|
#21
Charlotte St
Cayce, SC 29033
|
- sq. feet
|
- baths - beds |
show details | |

|
#22
Brookview Rd
Columbia, SC 29212
|
1,721 sq. feet
|
2 baths 3 beds |
$275,000
|
show details |

|
#23
Clover Bay Dr
Columbia, SC 29203
|
- sq. feet
|
2 baths 3 beds |
$99,000
|
show details |

|
#24
Boyd Shumpert Rd
Gaston, SC 29053
|
1,716 sq. feet
|
2 baths 4 beds |
$260,000
|
show details |

|
#25
Dunbar Rd
Cayce, SC 29033
|
- sq. feet
|
- baths - beds |
show details | |

|
#26
Madera Dr
Columbia, SC 29203
|
1,751 sq. feet
|
1 baths 3 beds |
show details | |

|
#27
Risdon Way
Columbia, SC 29223
|
1,262 sq. feet
|
2 baths 3 beds |
show details | |

|
#28
Morningwood Dr
Lexington, SC 29073
|
1,995 sq. feet
|
3 baths 3 beds |
show details | |

|
#29
Wilkinson Dr
Columbia, SC 29229
|
1,989 sq. feet
|
2 baths 4 beds |
show details | |

|
#30
Fox Squirrel Cir
Columbia, SC 29209
|
1,693 sq. feet
|
2 baths 3 beds |
show details |
| Photo | Address | Area | Beds / Baths | Price | Details |
|---|---|---|---|---|---|

|
#31
Tamara Ln
Gaston, SC 29053
|
2,128 sq. feet
|
3 baths 4 beds |
show details | |

|
#32
Kennerly Rd
Irmo, SC 29063
|
2,967 sq. feet
|
2 baths 3 beds |
show details | |

|
#33
Seabury St
Columbia, SC 29203
|
900 sq. feet
|
1 baths 3 beds |
show details | |

|
#34
Overbranch Dr
Columbia, SC 29223
|
3,175 sq. feet
|
2 baths 3 beds |
show details | |

|
#35
Ambergate Ln
Columbia, SC 29229
|
2,448 sq. feet
|
3 baths 5 beds |
show details | |

|
#36
Duchess Trl
Lexington, SC 29073
|
2,083 sq. feet
|
3 baths 5 beds |
show details | |

|
#37
Louisa Ln
Lexington, SC 29073
|
1,317 sq. feet
|
2 baths 3 beds |
show details | |

|
#38
Ashley St
Columbia, SC 29203
|
875 sq. feet
|
1 baths 2 beds |
show details | |

|
#39
Eldorado Ct
Columbia, SC 29203
|
1,978 sq. feet
|
2 baths 3 beds |
show details | |

|
#40
Clive St
Columbia, SC 29204
|
1,858 sq. feet
|
2 baths 3 beds |
show details |
| Photo | Address | Area | Beds / Baths | Price | Details |
|---|---|---|---|---|---|

|
#41
Foley Ln
Lexington, SC 29072
|
2,796 sq. feet
|
3 baths 6 beds |
show details | |

|
#42
Greenbank Dr
Lexington, SC 29073
|
1,582 sq. feet
|
2 baths 3 beds |
show details | |

|
#43
Swanhaven Dr
Lexington, SC 29073
|
4,261 sq. feet
|
4 baths 5 beds |
show details | |

|
#44
Frasier Fir Ln
Columbia, SC 29229
|
2,590 sq. feet
|
2 baths 4 beds |
show details | |

|
#45
Holmes Ave
Columbia, SC 29203
|
1,200 sq. feet
|
1 baths 3 beds |
show details | |

|
#46
Wallace Cir
Lexington, SC 29073
|
1,596 sq. feet
|
2 baths 3 beds |
show details | |

|
#47
Orangeburg St
Columbia, SC 29204
|
1,150 sq. feet
|
1 baths 3 beds |
show details | |

|
#48
Jones Rd
Irmo, SC 29063
|
3,717 sq. feet
|
4 baths 4 beds |
show details | |

|
#49
Ithica St
Columbia, SC 29204
|
2,046 sq. feet
|
2 baths 4 beds |
show details | |

|
Check over 1 million property listings on Foreclosure.com!
|
browse all offers | |||

Latest news about housing in Cayce, SC collected exclusively by city-data.com from local newspapers, TV, and radio stations

 | The renaissance of the central business district (2132 replies) |
| Why are Shandon neighborhood homes so pricy? (19 replies) |
| Would you live off of Frink St in Cayce (5 replies) |
| Fairfield County - pros and cons? (38 replies) |
| New metro area retail/restaurant thread (329 replies) |
| West Columbia/ Cayce (140 replies) |

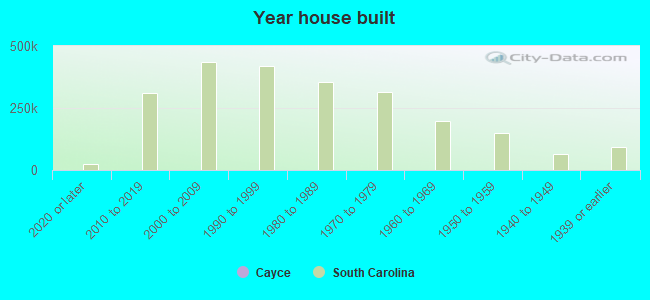
Median year apartment built: 1984
Household type by relationship:
Households: 14,166- Male householders: 3,172 (902 living alone), Female householders: 3,612 (1,742 living alone)
1,986 spouses (1,952 opposite-sex spouses), 382 unmarried partners, (362 opposite-sex unmarried partners), 3,047 children (2,933 natural, 19 adopted, 94 stepchildren), 150 grandchildren, 214 brothers or sisters, 46 parents, 0 foster children, 298 other relatives, 1,252 non-relatives
- In group quarters: 4
Size of family households: 1,839 2-persons, 832 3-persons, 589 4-persons, 110 5-persons, 13 6-persons, 64 7-or-more-persons.
Size of nonfamily households: 2,576 1-person, 462 2-persons, 124 3-persons, 87 4-persons, 18 5-persons.
1,196 married couples with children.
1,173 single-parent households (389 men, 784 women).
91.7% of residents of Cayce speak English at home.
4.7% of residents speak Spanish at home (70% speak English very well, 26% speak English well, 4% speak English not well).
1.2% of residents speak other Indo-European language at home (63% speak English very well, 29% speak English well, 8% speak English not well).
1.9% of residents speak Asian or Pacific Island language at home (66% speak English very well, 30% speak English well, 5% speak English not well).
0.3% of residents speak other language at home (34% speak English very well, 66% speak English not well).
Foreign born population: 794 (5.6%)
(47.0% of them are naturalized citizens)
| Here: | 6.0 |
| State: | 6.4 |
| Here: | 4.4 |
| State: | 4.5 |
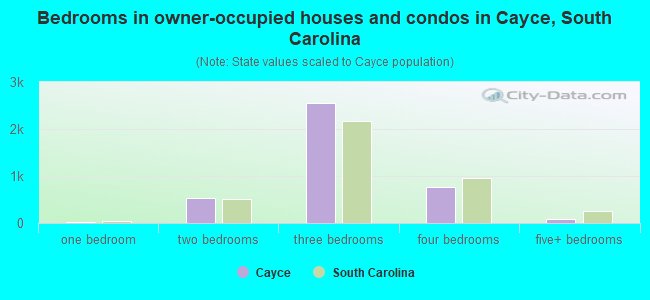
- Bedrooms in owner-occupied houses and condos in Cayce, South Carolina
- 0no bedroom
- 271 bedroom
- 5252 bedrooms
- 2,5463 bedrooms
- 7624 bedrooms
- 895+ bedrooms
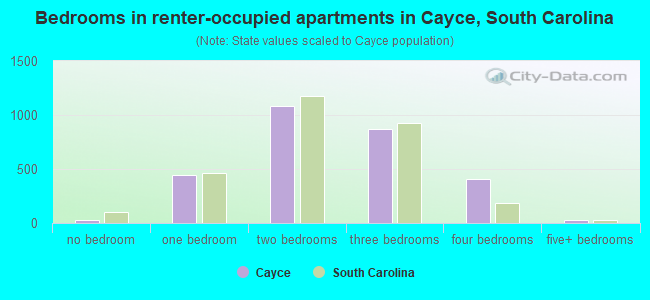
- Bedrooms in renter-occupied apartments in Cayce, South Carolina
- 30no bedroom
- 4451 bedroom
- 1,0872 bedrooms
- 8673 bedrooms
- 4124 bedrooms
- 325+ bedrooms
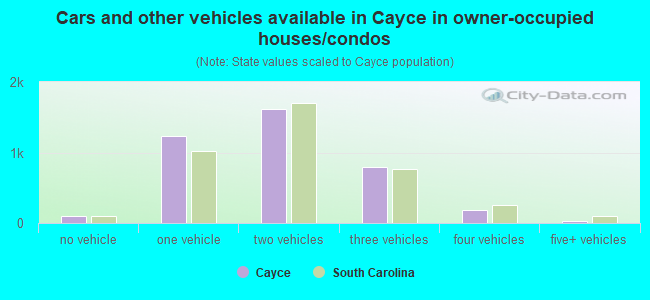
- Cars and other vehicles available in Cayce in owner-occupied houses/condos
- 103no vehicle
- 1,2321 vehicle
- 1,6142 vehicles
- 7883 vehicles
- 1824 vehicles
- 315+ vehicles
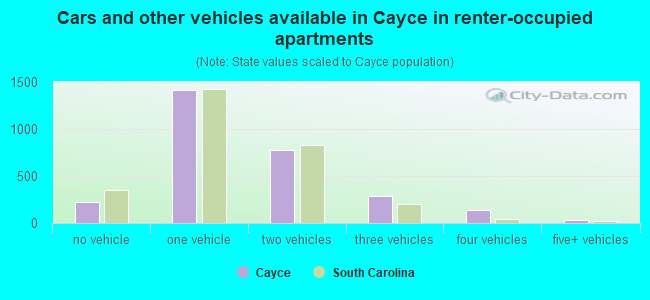
- Cars and other vehicles available in Cayce in renter-occupied apartments
- 224no vehicle
- 1,4181 vehicle
- 7762 vehicles
- 2833 vehicles
- 1414 vehicles
- 325+ vehicles
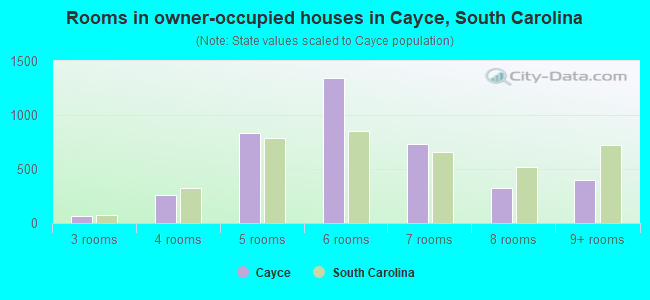
- Rooms in owner-occupied houses in Cayce, South Carolina
- 01 room
- 02 rooms
- 633 rooms
- 2594 rooms
- 8375 rooms
- 1,3446 rooms
- 7297 rooms
- 3248 rooms
- 3949+ rooms
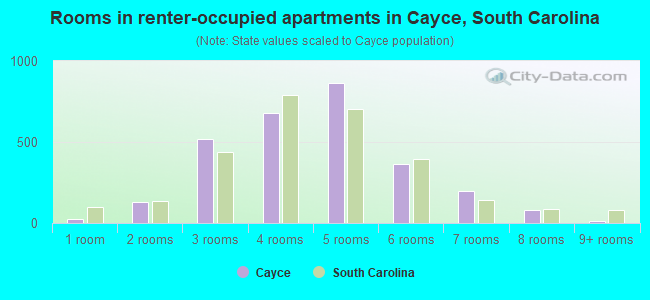
- Rooms in renter-occupied apartments in Cayce, South Carolina
- 251 room
- 1282 rooms
- 5203 rooms
- 6804 rooms
- 8675 rooms
- 3656 rooms
- 1957 rooms
- 818 rooms
- 139+ rooms
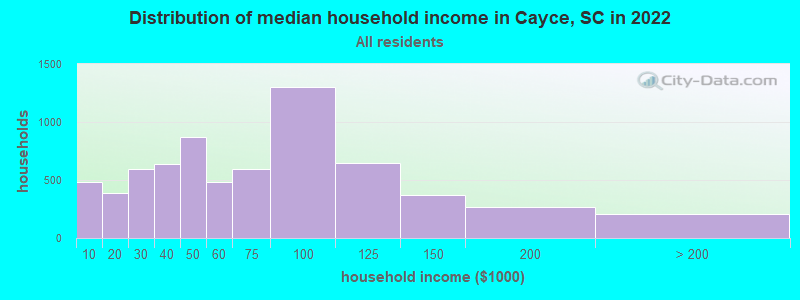
Cayce, SC household income distribution

- 479Less than $10,000
- 389$10,000 to $19,999
- 594$20,000 to $29,999
- 638$30,000 to $39,999
- 874$40,000 to $49,999
- 482$50,000 to $59,999
- 599$60,000 to $74,999
- 1,300$75,000 to $99,999
- 649$100,000 to $124,999
- 372$125,000 to $149,999
- 270$150,000 to $199,999
- 205$200,000 or more
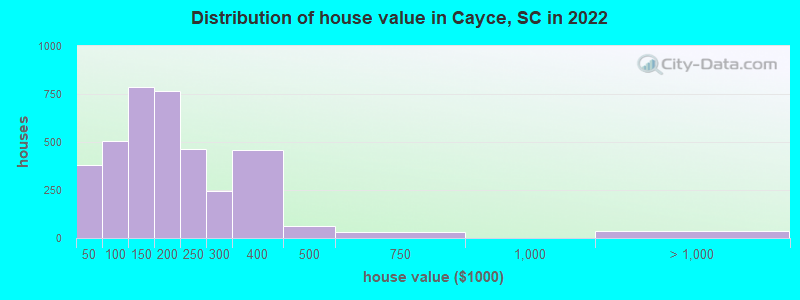
Home value of owner - occupied houses in 2022 in Cayce, SC
-
- 20Less than $10,000
- 91$10,000 to $14,999
- 63$15,000 to $19,999
- 30$20,000 to $24,999
- 5$35,000 to $39,999
- 167$40,000 to $49,999
- 35$50,000 to $59,999
- 23$60,000 to $69,999
- 70$70,000 to $79,999
- 63$80,000 to $89,999
- 146$90,000 to $99,999
- 347$100,000 to $124,999
- 435$125,000 to $149,999
- 395$150,000 to $174,999
- 371$175,000 to $199,999
- 461$200,000 to $249,999
- 246$250,000 to $299,999
- 456$300,000 to $399,999
- 65$400,000 to $499,999
- 33$500,000 to $749,999
- 37$1,000,000 to $1,499,999
Rent paid by renters in 2022 in Cayce, SC
-
- 63Less than $100
- 9$250 to $299
- 18$300 to $349
- 7$350 to $399
- 116$450 to $499
- 72$500 to $549
- 43$550 to $599
- 154$600 to $649
- 171$650 to $699
- 175$700 to $749
- 74$750 to $799
- 185$800 to $899
- 192$900 to $999
- 338$1,000 to $1,249
- 472$1,250 to $1,499
- 318$1,500 to $1,999
- 72$2,000 to $2,499
- 66$2,500 to $2,999
- 30$3,000 to $3,499
- 206No cash rent
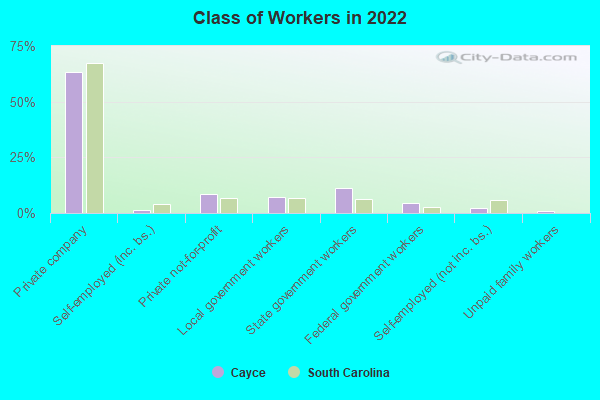
Percentage of workers working in this county: 53.5%
Number of people working at home: 528 (7.4% of all workers)
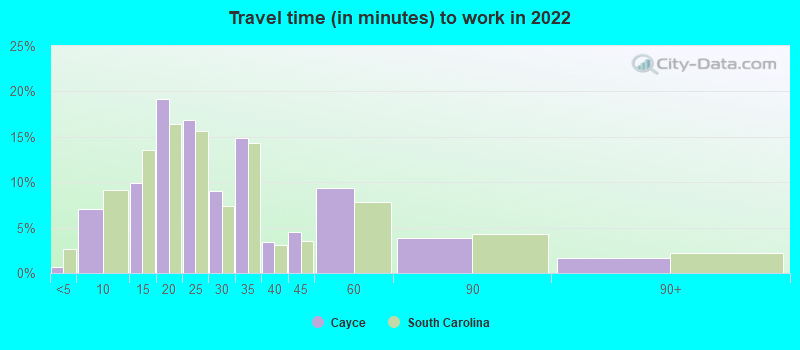
Travel time to work (commute)
- Less than 5 minutes: 74
- 5 to 9 minutes: 533
- 10 to 14 minutes: 1,037
- 15 to 19 minutes: 1,809
- 20 to 24 minutes: 1,367
- 25 to 29 minutes: 278
- 30 to 34 minutes: 601
- 35 to 39 minutes: 125
- 40 to 44 minutes: 184
- 45 to 59 minutes: 337
- 60 to 89 minutes: 52
- 90 or more minutes: 49
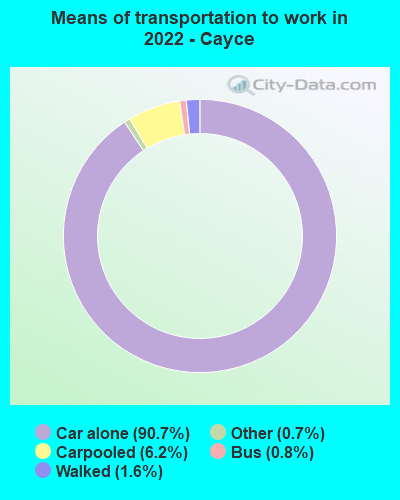
Means of transportation to work:
- Drove a car alone: 6,298 (83.4%)
- Carpooled: 375 (5.0%)
- Bus: 63 (0.8%)
- Taxi: 51 (0.7%)
- Walked: 81 (1.1%)
- Worked at home: 528 (7.0%)
- Unemployment by race in 2022
- Unemployment rate for White non-Hispanic residents
- 3.4%Males
- 2.0%Females
- Unemployment rate for Black residents
- 27.1%Males
- 0.5%Females
- Unemployment rate for Asian residents
- 5.6%Males
- Unemployment rate for two or more race residents
- 8.3%Males
- 5.6%Females
- Unemployment rate for Hispanic or Latino residents
- 7.1%Males
- 10.6%Females
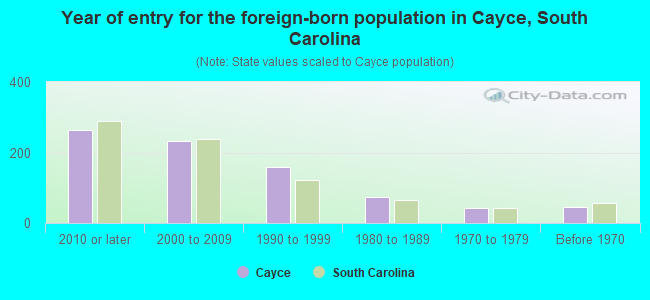
- Year of entry for the foreign-born population in Cayce, South Carolina
- 2642010 or later
- 2322000 to 2009
- 1581990 to 1999
- 731980 to 1989
- 421970 to 1979
- 45Before 1970
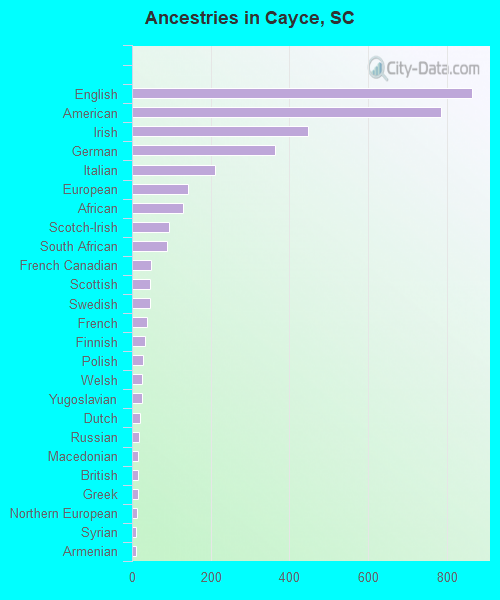
First ancestries reported:
- English: 864 (12.0%)
- American: 786 (10.9%)
- Irish: 447 (6.2%)
- German: 364 (5.1%)
- Italian: 211 (2.9%)
- European: 142 (2.0%)
- African: 129 (1.8%)
- Scotch-Irish: 93 (1.3%)
- South African: 88 (1.2%)
- French Canadian: 48 (0.7%)
- Scottish: 46 (0.6%)
- Swedish: 46 (0.6%)
- French: 39 (0.5%)
- Finnish: 32 (0.4%)
- Polish: 29 (0.4%)
- Welsh: 25 (0.3%)
- Yugoslavian: 25 (0.3%)
- Dutch: 20 (0.3%)
- Russian: 18 (0.3%)
- Macedonian: 16 (0.2%)
- British: 15 (0.2%)
- Greek: 15 (0.2%)
- Northern European: 13 (0.2%)
- Syrian: 10 (0.1%)
- Armenian: 9 (0.1%)
- Belgian: 8 (0.1%)
- Norwegian: 7 (0.10%)
- Swiss: 7 (0.10%)
Most common places of birth for foreign-born residents (%):
| Cayce: | 11.6% (90) |
| South Carolina: | 0.7% (1,840) |
| Cayce: | 11.4% (88) |
| South Carolina: | 6.8% (18,307) |
| Cayce: | 9.6% (74) |
| South Carolina: | 3.2% (8,721) |
| Cayce: | 9.6% (74) |
| South Carolina: | 22.5% (60,774) |
| Cayce: | 8.3% (64) |
| South Carolina: | 3.4% (9,058) |
| Cayce: | 7.6% (59) |
| South Carolina: | 4.8% (12,834) |
| Cayce: | 4.9% (38) |
| South Carolina: | 0.3% (833) |
| Cayce: | 3.6% (28) |
| South Carolina: | 4.3% (11,533) |
| Cayce: | 3.4% (26) |
| South Carolina: | 1.7% (4,513) |
| Cayce: | 2.5% (19) |
| South Carolina: | 0.2% (410) |
| Cayce: | 2.3% (18) |
| South Carolina: | 3.0% (8,193) |
| Cayce: | 1.7% (13) |
| South Carolina: | 0.0% (128) |
| Cayce: | 1.7% (13) |
| South Carolina: | 1.2% (3,296) |
| Cayce: | 1.7% (13) |
| South Carolina: | 1.3% (3,522) |
| Cayce: | 1.7% (13) |
| South Carolina: | 4.1% (11,031) |
| Cayce: | 1.7% (13) |
| South Carolina: | 0.5% (1,395) |
Place of birth for U.S.-born residents:
- This state: 8,636
- Other state: 4,499
- Northeast: 993
- Midwest: 786
- South: 2,405
- West: 299
83.5% of Cayce residents lived in the same house 1 years ago.
Out of people who lived in different houses, 20.5% lived in this county.
Out of people who lived in different counties, 60.1% lived in South Carolina.
| Cayce: | 83.5% |
| State average: | 86.5% |
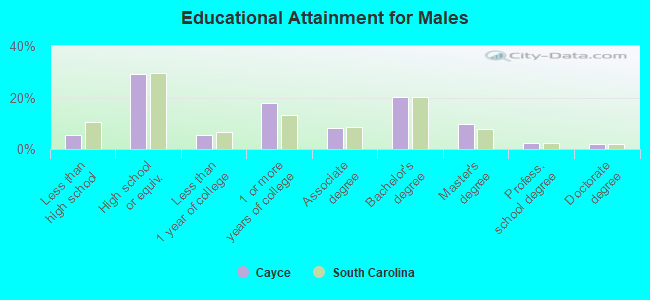
Education attainment for males 25 years and older:
- No schooling: 35
- Nursery to 4th grade: 0
- 5th and 6th grade: 14
- 7th and 8th grade: 30
- 9th grade: 6
- 10th grade: 18
- 11th grade: 79
- 12th grade, no diploma: 67
- High school graduate (or equivalency): 1,356
- Less than 1 year of college: 252
- Some college more than 1 year, no degree: 833
- Associate degree: 379
- Bachelor's degree: 931
- Master's degree: 444
- Professional school degree: 111
- Doctorate degree: 98
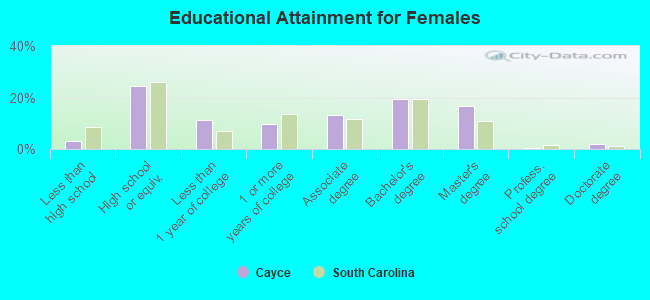
Education attainment for females 25 years and older:
- No schooling: 38
- Nursery to 4th grade: 0
- 5th and 6th grade: 49
- 7th and 8th grade: 3
- 9th grade: 8
- 10th grade: 12
- 11th grade: 20
- 12th grade, no diploma: 23
- High school graduate (or equivalency): 1,207
- Less than 1 year of college: 553
- Some college more than 1 year, no degree: 485
- Associate degree: 660
- Bachelor's degree: 952
- Master's degree: 818
- Professional school degree: 17
- Doctorate degree: 94


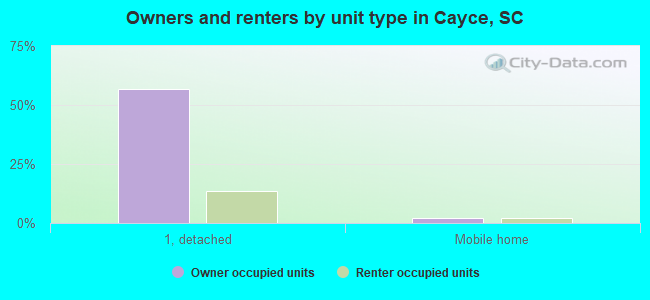
Housing units in structures:
- One, detached: 5,054
- One, attached: 107
- Two: 142
- 3 or 4: 453
- 5 to 9: 241
- 10 to 19: 418
- 20 to 49: 272
- 50 or more: 303
- Mobile homes: 320
Housing units lacking complete kitchen facilities in 2022: 1.7%
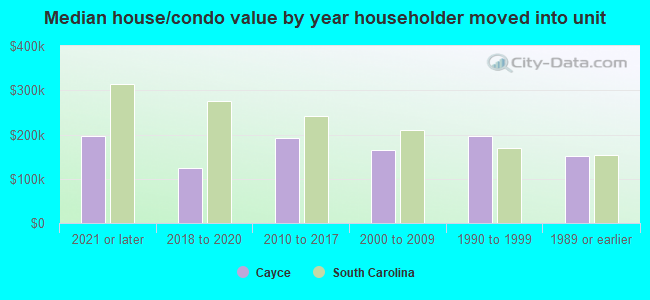
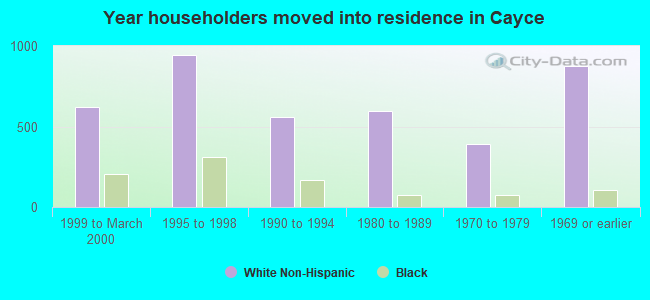
House/condo owner moved in on average 18 years ago
Renter moved in on average 1 years ago
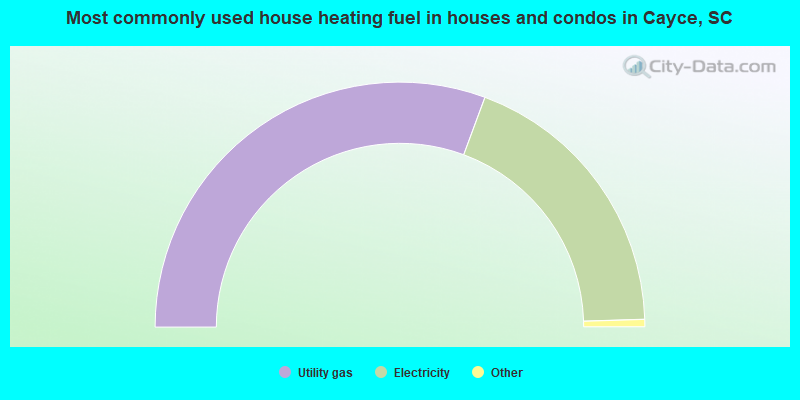
- 61.3%Utility gas
- 37.7%Electricity
- 0.8%Bottled, tank, or LP gas
- 0.3%Solar energy
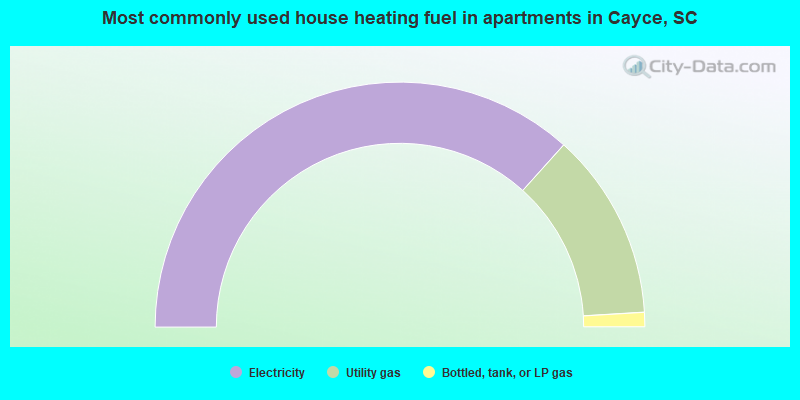
- 73.4%Electricity
- 24.8%Utility gas
- 1.9%Bottled, tank, or LP gas
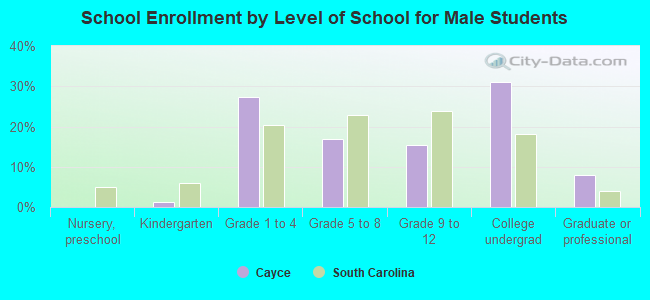
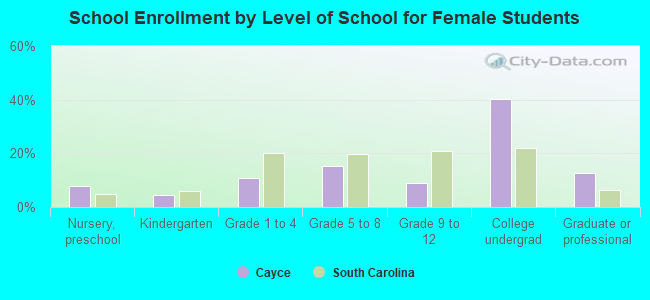
Private vs. public school enrollment:
| Here: | 15.0% |
| South Carolina: | 14.4% |
| Here: | 4.3% |
| South Carolina: | 11.1% |
| Here: | 2.5% |
| South Carolina: | 21.9% |