Cecil-Bishop, PA (Pennsylvania) Houses and Residents
| Cecil-Bishop: | $290,412 |
| Pennsylvania: | $245,500 |
Total population: 2,476 (Urban population: 2,422, Rural population: 218 (all nonfarm))
Houses: 1,245 (1,135 occupied: 915 owner occupied, 240 renter occupied)
| % of renters here: | 21% |
| State: | 31% |
Housing density: 490 houses/condos per square mile
Median price asked for vacant for-sale houses and condos in 2022 in this county: $94,848.
Median contract rent in 2022: $978 (lower quartile is $719, upper quartile is $1,336)
Median rent asked for vacant for-rent units in 2022: $555
Median gross rent in Cecil-Bishop, PA in 2022: $1,125
Housing units in Cecil-Bishop with a mortgage: 435 (70 second mortgage, 0 home equity loan, 65 both second mortgage and home equity loan)
Houses without a mortgage: 46
Median household income for houses/condos with a mortgage: $117,791
Median household income for apartments without a mortgage: $77,005
Median monthly housing costs: $940
Compare current foreclosures near Cecil-Bishop, PA:
| Photo | Address | Area | Beds / Baths | Price | Details |
|---|---|---|---|---|---|

|
#1
Triana St
Pittsburgh, PA 15210
|
1,184 sq. feet
|
1 baths 3 beds |
$157,500
|
show details |

|
#2
Grant St
Carnegie, PA 15106
|
1,345 sq. feet
|
2 baths 4 beds |
$225,500
|
show details |

|
#3
Muirfield Dr
Presto, PA 15142
|
4,801 sq. feet
|
4 baths 5 beds |
$709,500
|
show details |

|
#4
Brinwood Ave
Pittsburgh, PA 15227
|
1,000 sq. feet
|
2 baths 3 beds |
$229,900
|
show details |

|
#5
Semicir St
Pittsburgh, PA 15214
|
537 sq. feet
|
1 baths 1 beds |
$21,000
|
show details |

|
#6
9th Ave
Elizabeth, PA 15037
|
1,554 sq. feet
|
1 baths 3 beds |
$180,000
|
show details |

|
#7
Kirk Ave
Pittsburgh, PA 15227
|
1,500 sq. feet
|
2 baths 3 beds |
$197,500
|
show details |

|
#8
Venetia Rd
Venetia, PA 15367
|
1,098 sq. feet
|
2 baths 3 beds |
$236,500
|
show details |

|
#9
Catherine St
Mc Kees Rocks, PA 15136
|
2,688 sq. feet
|
2 baths 4 beds |
show details | |

|
#10
Adams Ave
West Mifflin, PA 15122
|
3,106 sq. feet
|
4 baths 5 beds |
show details |
| Photo | Address | Area | Beds / Baths | Price | Details |
|---|---|---|---|---|---|

|
#11
Orchard Ave
Pittsburgh, PA 15202
|
1,180 sq. feet
|
1 baths 3 beds |
show details | |

|
#12
Davis Ave
Pittsburgh, PA 15202
|
1,260 sq. feet
|
2 baths 3 beds |
show details | |

|
#13
Mccully Rd
Pittsburgh, PA 15234
|
1,750 sq. feet
|
2 baths 5 beds |
show details | |

|
#14
Walnut Ave
Pittsburgh, PA 15209
|
1,585 sq. feet
|
1 baths 3 beds |
show details | |

|
#15
Latonia Ave
Pittsburgh, PA 15216
|
1,236 sq. feet
|
1 baths 3 beds |
show details | |

|
#16
Patterson St
Pittsburgh, PA 15203
|
1,296 sq. feet
|
2 baths 3 beds |
show details | |

|
#17
Potomac Ave
Pittsburgh, PA 15216
|
1,373 sq. feet
|
2 baths 3 beds |
show details | |

|
#18
S 18th St
Pittsburgh, PA 15203
|
1,240 sq. feet
|
1 baths 2 beds |
show details | |

|
#19
Camarta Dr
Pittsburgh, PA 15227
|
- sq. feet
|
2 baths 4 beds |
show details | |

|
#20
E Mcintyre Ave
Pittsburgh, PA 15214
|
2,056 sq. feet
|
1 baths 3 beds |
show details |
| Photo | Address | Area | Beds / Baths | Price | Details |
|---|---|---|---|---|---|

|
#21
Lindermer Ave
Bethel Park, PA 15102
|
2,030 sq. feet
|
1 baths 3 beds |
show details | |

|
#22
Dawson Ave
Pittsburgh, PA 15202
|
2,186 sq. feet
|
1 baths 4 beds |
show details | |

|
#23
Morton Ln
Pittsburgh, PA 15226
|
1,015 sq. feet
|
1 baths 3 beds |
show details | |

|
#24
Union Ave
Pittsburgh, PA 15202
|
1,948 sq. feet
|
2 baths 5 beds |
show details | |

|
#25
Florida Ave
Bethel Park, PA 15102
|
1,334 sq. feet
|
1 baths 3 beds |
show details | |

|
#26
Collins Ave
Clairton, PA 15025
|
1,170 sq. feet
|
1 baths 2 beds |
show details | |

|
#27
Oneill Dr
Bethel Park, PA 15102
|
1,954 sq. feet
|
2 baths 4 beds |
show details | |

|
#28
Chartiers Ave
Carnegie, PA 15106
|
1,700 sq. feet
|
2 baths 4 beds |
show details | |

|
#29
Spring Garden Rd
Pittsburgh, PA 15212
|
1,088 sq. feet
|
1 baths 2 beds |
show details | |

|
#30
Rodgers St
Pittsburgh, PA 15207
|
2,048 sq. feet
|
2 baths 4 beds |
show details |
| Photo | Address | Area | Beds / Baths | Price | Details |
|---|---|---|---|---|---|

|
#31
Dublin Rd
Bethel Park, PA 15102
|
1,184 sq. feet
|
1 baths 3 beds |
show details | |

|
#32
4th St
Monongahela, PA 15063
|
1,332 sq. feet
|
2 baths 3 beds |
show details | |

|
#33
Michigan Ave
Glassport, PA 15045
|
2,811 sq. feet
|
2 baths 5 beds |
show details | |

|
#34
9th St
Glassport, PA 15045
|
825 sq. feet
|
1 baths 2 beds |
show details | |

|
#35
Vesper St
Bridgeville, PA 15017
|
936 sq. feet
|
1 baths 3 beds |
show details | |

|
#36
Kenzie Dr # K-7
Pittsburgh, PA 15205
|
1,582 sq. feet
|
2 baths 3 beds |
show details | |

|
#37
Rural Valley Rd
Claysville, PA 15323
|
1,175 sq. feet
|
2 baths 3 beds |
show details | |

|
#38
Smith Township State Rd
Burgettstown, PA 15021
|
1,080 sq. feet
|
2 baths 3 beds |
show details | |

|
#39
Woodward Ave
Mc Kees Rocks, PA 15136
|
1,958 sq. feet
|
2 baths 4 beds |
show details | |

|
#40
Riggs Rd
South Park, PA 15129
|
1,240 sq. feet
|
2 baths 3 beds |
show details |
| Photo | Address | Area | Beds / Baths | Price | Details |
|---|---|---|---|---|---|

|
#41
Chartiers Ave
Pittsburgh, PA 15204
|
1,531 sq. feet
|
1 baths 4 beds |
show details | |

|
#42
Grove Ave
Washington, PA 15301
|
816 sq. feet
|
1 baths 2 beds |
show details | |

|
#43
Park Ave
Washington, PA 15301
|
1,884 sq. feet
|
2 baths 3 beds |
show details | |

|
#44
Greenway Dr
Pittsburgh, PA 15204
|
956 sq. feet
|
1 baths 3 beds |
show details | |

|
#45
Wayne Ave
Mc Kees Rocks, PA 15136
|
1,440 sq. feet
|
1 baths 3 beds |
show details | |

|
#46
Progress St
Mc Kees Rocks, PA 15136
|
1,477 sq. feet
|
2 baths 3 beds |
show details | |

|
#47
Kenwood Dr
Coraopolis, PA 15108
|
900 sq. feet
|
1 baths 2 beds |
show details | |

|
#48
Fallowfield Ave
Pittsburgh, PA 15216
|
888 sq. feet
|
1 baths 2 beds |
show details | |

|
#49
9th St
Mc Kees Rocks, PA 15136
|
1,380 sq. feet
|
1 baths 2 beds |
show details | |

|
Check over 1 million property listings on Foreclosure.com!
|
browse all offers | |||


Median year apartment built: 1957
Household type by relationship:
Households: 2,693- Male householders: 432 (65 living alone), Female householders: 695 (202 living alone)
678 spouses (678 opposite-sex spouses), 42 unmarried partners, (42 opposite-sex unmarried partners), 787 children (780 natural, 0 adopted, 7 stepchildren), 23 grandchildren, 0 brothers or sisters, 9 parents, 0 foster children, 0 other relatives, 22 non-relatives
- In group quarters: 3
Size of family households: 381 2-persons, 200 3-persons, 162 4-persons, 67 5-persons.
Size of nonfamily households: 279 1-person, 29 2-persons, 7 3-persons.
476 married couples with children.
123 single-parent households (35 men, 88 women).
98.6% of residents of Cecil-Bishop speak English at home.
0.6% of residents speak Asian or Pacific Island language at home (100% speak English very well).
Foreign born population: 26 (1.0%)
(65.4% of them are naturalized citizens)
| Here: | 6.7 |
| State: | 6.8 |
| Here: | 4.9 |
| State: | 4.3 |

- Bedrooms in owner-occupied houses and condos in Cecil-Bishop, Pennsylvania
- 0no bedroom
- 01 bedroom
- 1072 bedrooms
- 5483 bedrooms
- 2384 bedrooms
- 235+ bedrooms

- Bedrooms in renter-occupied apartments in Cecil-Bishop, Pennsylvania
- 0no bedroom
- 321 bedroom
- 842 bedrooms
- 1093 bedrooms
- 154 bedrooms
- 05+ bedrooms

- Cars and other vehicles available in Cecil-Bishop in owner-occupied houses/condos
- 14no vehicle
- 2051 vehicle
- 4282 vehicles
- 2363 vehicles
- 264 vehicles
- 75+ vehicles

- Cars and other vehicles available in Cecil-Bishop in renter-occupied apartments
- 0no vehicle
- 1261 vehicle
- 1022 vehicles
- 133 vehicles
- 04 vehicles
- 05+ vehicles

- Rooms in owner-occupied houses in Cecil-Bishop, Pennsylvania
- 01 room
- 02 rooms
- 03 rooms
- 414 rooms
- 1665 rooms
- 2576 rooms
- 1027 rooms
- 2178 rooms
- 1339+ rooms

- Rooms in renter-occupied apartments in Cecil-Bishop, Pennsylvania
- 01 room
- 322 rooms
- 03 rooms
- 464 rooms
- 1175 rooms
- 216 rooms
- 97 rooms
- 158 rooms
- 09+ rooms


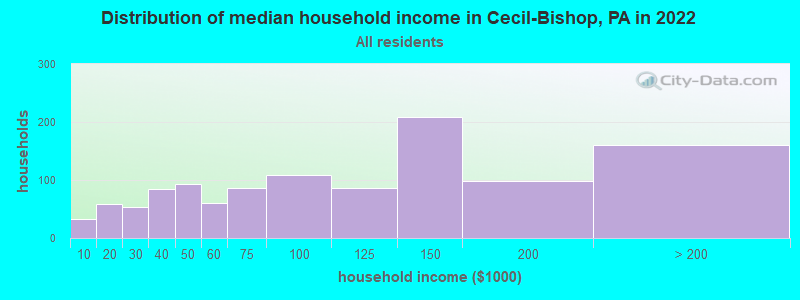
Cecil-Bishop, PA household income distribution

- 32Less than $10,000
- 59$10,000 to $19,999
- 54$20,000 to $29,999
- 84$30,000 to $39,999
- 93$40,000 to $49,999
- 61$50,000 to $59,999
- 86$60,000 to $74,999
- 108$75,000 to $99,999
- 87$100,000 to $124,999
- 209$125,000 to $149,999
- 98$150,000 to $199,999
- 161$200,000 or more
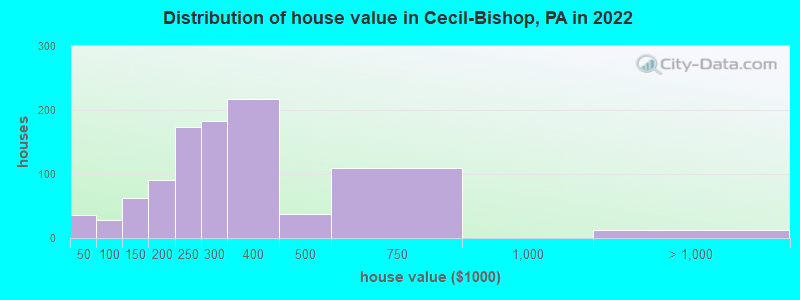
Home value of owner - occupied houses in 2022 in Cecil-Bishop, PA
-
- 16Less than $10,000
- 11$20,000 to $24,999
- 8$30,000 to $34,999
- 12$80,000 to $89,999
- 15$90,000 to $99,999
- 26$100,000 to $124,999
- 35$125,000 to $149,999
- 76$150,000 to $174,999
- 14$175,000 to $199,999
- 172$200,000 to $249,999
- 183$250,000 to $299,999
- 217$300,000 to $399,999
- 36$400,000 to $499,999
- 108$500,000 to $749,999
- 12$1,000,000 to $1,499,999
Rent paid by renters in 2022 in Cecil-Bishop, PA
-
- 15$300 to $349
- 37$650 to $699
- 21$700 to $749
- 13$800 to $899
- 17$900 to $999
- 7$1,000 to $1,249
- 74$1,250 to $1,499
- 21$1,500 to $1,999
- 15No cash rent


Percentage of workers working in this county: 52.8%
Number of people working at home: 240 (16.7% of all workers)
Travel time to work (commute)
- Less than 5 minutes: 0
- 5 to 9 minutes: 139
- 10 to 14 minutes: 89
- 15 to 19 minutes: 323
- 20 to 24 minutes: 273
- 25 to 29 minutes: 76
- 30 to 34 minutes: 59
- 35 to 39 minutes: 16
- 40 to 44 minutes: 48
- 45 to 59 minutes: 87
- 60 to 89 minutes: 66
- 90 or more minutes: 24
Means of transportation to work:
- Drove a car alone: 1,136 (85.7%)
- Carpooled: 107 (8.1%)
- Streetcar or trolley car: 7 (0.5%)
- Walked: 16 (1.2%)
- Other means: 15 (1.1%)
- Worked at home: 45 (3.4%)

- Unemployment by race in 2022
- Unemployment rate for White non-Hispanic residents
- 2.0%Males
- 3.3%Females

- Year of entry for the foreign-born population in Cecil-Bishop, Pennsylvania
- 02010 or later
- 02000 to 2009
- 41990 to 1999
- 111980 to 1989
- 01970 to 1979
- 6Before 1970

First ancestries reported:
- Italian: 262 (34.9%)
- Irish: 79 (10.5%)
- Polish: 77 (10.3%)
- German: 62 (8.3%)
- American: 50 (6.7%)
- Belgian: 50 (6.7%)
- English: 40 (5.3%)
- Scotch-Irish: 27 (3.6%)
- Ukrainian: 18 (2.4%)
- Slovene: 15 (2.0%)
- Swedish: 11 (1.5%)
- Lithuanian: 10 (1.3%)
- Croatian: 8 (1.1%)
- British: 7 (0.9%)
- Scottish: 7 (0.9%)
Most common places of birth for foreign-born residents (%):
| Cecil-Bishop: | 37.0% (10) |
| Pennsylvania: | 1.1% (10,331) |
| Cecil-Bishop: | 33.3% (9) |
| Pennsylvania: | 0.0% (98) |
| Cecil-Bishop: | 11.1% (3) |
| Pennsylvania: | 0.3% (3,245) |
Place of birth for U.S.-born residents:
- This state: 2,184
- Other state: 415
- Northeast: 105
- Midwest: 95
- South: 173
- West: 31
88.3% of Cecil-Bishop residents lived in the same house 1 years ago.
Out of people who lived in different houses, 15.8% lived in this county.
Out of people who lived in different counties, 73.0% lived in Pennsylvania.
| Cecil-Bishop: | 88.3% |
| State average: | 89.3% |
Education attainment for males 25 years and older:
- No schooling: 0
- Nursery to 4th grade: 0
- 5th and 6th grade: 0
- 7th and 8th grade: 15
- 9th grade: 0
- 10th grade: 0
- 11th grade: 4
- 12th grade, no diploma: 10
- High school graduate (or equivalency): 240
- Less than 1 year of college: 48
- Some college more than 1 year, no degree: 86
- Associate degree: 108
- Bachelor's degree: 255
- Master's degree: 97
- Professional school degree: 6
- Doctorate degree: 46

Education attainment for females 25 years and older:
- No schooling: 0
- Nursery to 4th grade: 0
- 5th and 6th grade: 0
- 7th and 8th grade: 0
- 9th grade: 0
- 10th grade: 0
- 11th grade: 5
- 12th grade, no diploma: 0
- High school graduate (or equivalency): 279
- Less than 1 year of college: 29
- Some college more than 1 year, no degree: 97
- Associate degree: 121
- Bachelor's degree: 222
- Master's degree: 158
- Professional school degree: 7
- Doctorate degree: 16


Housing units in structures:
- One, detached: 1,052
- One, attached: 45
- Two: 16
- 3 or 4: 59
- 5 to 9: 38
- 10 to 19: 33
Housing units lacking complete kitchen facilities in 2022: 5.4%
House/condo owner moved in on average 22 years ago
Renter moved in on average 1 years ago

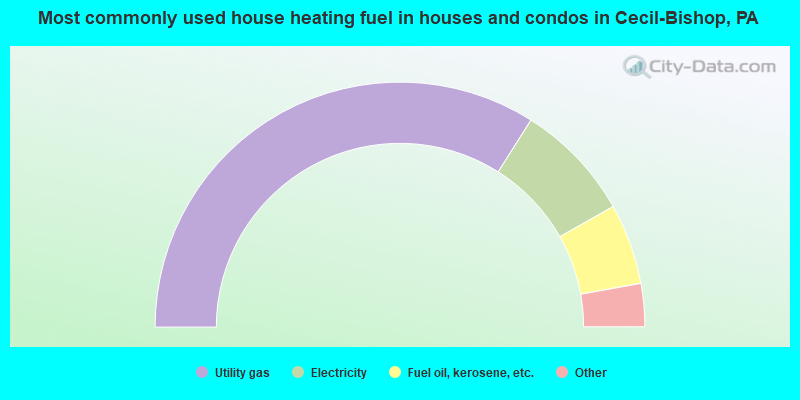
- 68.1%Utility gas
- 15.7%Electricity
- 10.7%Fuel oil, kerosene, etc.
- 2.9%Bottled, tank, or LP gas
- 1.5%Wood
- 1.1%Other fuel
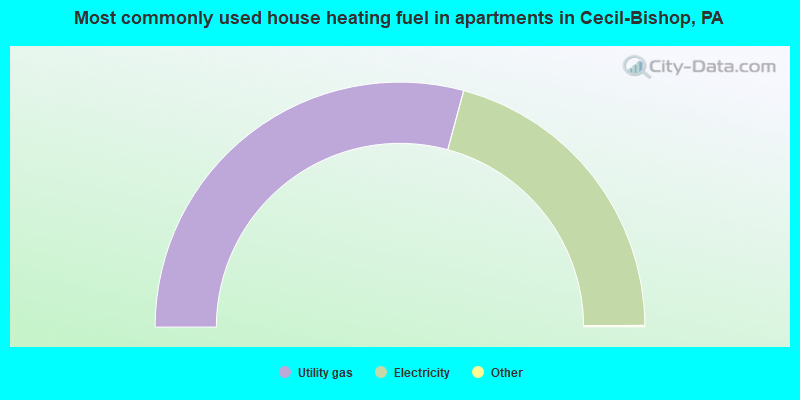
- 58.5%Utility gas
- 41.5%Electricity
Private vs. public school enrollment:
| Here: | 8.5% |
| Pennsylvania: | 15.7% |
| Here: | 0.0% |
| Pennsylvania: | 13.4% |
| Here: | 44.0% |
| Pennsylvania: | 39.8% |


