Cedar Falls, IA (Iowa) Houses and Residents
| Cedar Falls: | $255,018 |
| Iowa: | $194,600 |
Mean price in 2022:
Detached houses: $300,092
Here: $300,092 State: $245,224 Townhouses or other attached units: $281,417
Here: $281,417 State: $238,767 In 2-unit structures: $253,556
Here: $253,556 State: $243,070 In 3-to-4-unit structures: $235,385
Here: $235,385 State: $162,139 In 5-or-more-unit structures: $190,651
Here: $190,651 State: $190,519 Mobile homes: $19,376
Here: $19,376 State: $51,271
Total population: 40,859 (Urban population: 34,104, Rural population: 2,153 (13 farm, 2,140 nonfarm))
Houses: 16,680 (15,532 occupied: 9,838 owner occupied, 5,894 renter occupied)
| % of renters here: | 37% |
| State: | 28% |
Housing density: 589 houses/condos per square mile
Median price asked for vacant for-sale houses and condos in 2022: $239,332.
Median contract rent in 2022: $960 (lower quartile is $716, upper quartile is $1,253)
Median rent asked for vacant for-rent units in 2022: $984
Median gross rent in Cedar Falls, IA in 2022: $1,122
Housing units in Cedar Falls with a mortgage: 5,939 (1,224 second mortgage, 0 home equity loan, 881 both second mortgage and home equity loan)
Houses without a mortgage: 392
Median household income for houses/condos with a mortgage: $117,816
Median household income for apartments without a mortgage: $72,425
Median monthly housing costs: $1,140
Compare current foreclosures near Cedar Falls, IA:
| Photo | Address | Area | Beds / Baths | Price | Details |
|---|---|---|---|---|---|

|
#1
Ford Rd
Cedar Falls, IA 50613
|
1,582 sq. feet
|
2 baths 3 beds |
show details | |

|
#2
Rainbow Dr
Cedar Falls, IA 50613
|
958 sq. feet
|
1 baths 2 beds |
show details | |

|
#3
Orchard Dr
Cedar Falls, IA 50613
|
1,363 sq. feet
|
2 baths 3 beds |
show details | |

|
#4
Quesada Ave
Cedar Falls, IA 50613
|
2,004 sq. feet
|
2 baths 2 beds |
show details | |

|
#5
Bluegrass Cir, Unit 112
Cedar Falls, IA 50613
|
- sq. feet
|
- baths - beds |
show details | |

|
#6
Pearl St
Cedar Falls, IA 50613
|
- sq. feet
|
- baths - beds |
show details | |

|
#7
Pine St
Cedar Falls, IA 50613
|
- sq. feet
|
- baths - beds |
show details | |

|
#8
W 1st St, Apt 324
Cedar Falls, IA 50613
|
- sq. feet
|
- baths - beds |
show details | |

|
#9
Union Rd Lot 36
Cedar Falls, IA 50613
|
- sq. feet
|
- baths - beds |
show details | |

|
#10
Oneida St
Waterloo, IA 50703
|
1,177 sq. feet
|
1 baths 3 beds |
$99,900
|
show details |
| Photo | Address | Area | Beds / Baths | Price | Details |
|---|---|---|---|---|---|

|
#11
Longfellow Ave
Waterloo, IA 50703
|
900 sq. feet
|
1 baths 3 beds |
$174,900
|
show details |

|
#12
Franklin St
Cedar Falls, IA 50613
|
- sq. feet
|
- baths - beds |
show details | |

|
#13
E End Ave
Evansdale, IA 50707
|
1,506 sq. feet
|
1 baths 3 beds |
$22,500
|
show details |

|
#14
Watters Rd
Hudson, IA 50643
|
1,874 sq. feet
|
3 baths 3 beds |
show details | |

|
#15
W 7th St
Waterloo, IA 50702
|
964 sq. feet
|
1 baths 2 beds |
show details | |

|
#16
Grand Blvd
Evansdale, IA 50707
|
1,021 sq. feet
|
1 baths 2 beds |
show details | |

|
#17
Broadway St
Waterloo, IA 50703
|
972 sq. feet
|
1 baths 2 beds |
show details | |

|
#18
Elston Ave
Waterloo, IA 50701
|
2,068 sq. feet
|
1 baths 3 beds |
show details | |

|
#19
Goodell Ave
Readlyn, IA 50668
|
1,104 sq. feet
|
2 baths 2 beds |
show details | |

|
#20
Cedar Bend St
Waterloo, IA 50703
|
920 sq. feet
|
2 baths 3 beds |
show details |
| Photo | Address | Area | Beds / Baths | Price | Details |
|---|---|---|---|---|---|

|
#21
Adrian St
Waterloo, IA 50703
|
841 sq. feet
|
1 baths 2 beds |
show details | |

|
#22
Lakeside St
Waterloo, IA 50703
|
1,092 sq. feet
|
1 baths 3 beds |
show details | |

|
#23
Sager Ave
Waterloo, IA 50701
|
932 sq. feet
|
2 baths 2 beds |
show details | |

|
#24
Saint Andrews Ave
Waterloo, IA 50701
|
1,418 sq. feet
|
2 baths 2 beds |
show details | |

|
#25
E Mitchell Ave
Waterloo, IA 50702
|
486 sq. feet
|
1 baths 2 beds |
show details | |

|
#26
Riverside Dr
Waterloo, IA 50703
|
1,284 sq. feet
|
1 baths 2 beds |
show details | |

|
#27
Hawthorne Ave
Waterloo, IA 50702
|
1,600 sq. feet
|
1 baths 3 beds |
show details | |

|
#28
French St
Waterloo, IA 50703
|
816 sq. feet
|
1 baths 2 beds |
show details | |

|
#29
French St
Waterloo, IA 50703
|
816 sq. feet
|
1 baths 2 beds |
show details | |

|
#30
Independence Ave
Waterloo, IA 50703
|
887 sq. feet
|
1 baths 4 beds |
show details |
| Photo | Address | Area | Beds / Baths | Price | Details |
|---|---|---|---|---|---|

|
#31
Reflection Ln
Waterloo, IA 50701
|
1,286 sq. feet
|
2 baths 2 beds |
show details | |

|
#32
Country Ln
Waterloo, IA 50701
|
1,747 sq. feet
|
2 baths 3 beds |
show details | |

|
#33
Dearborn Ave
Evansdale, IA 50707
|
1,461 sq. feet
|
2 baths 3 beds |
show details | |

|
#34
Winslow Rd
Janesville, IA 50647
|
1,651 sq. feet
|
1 baths 3 beds |
show details | |

|
#35
Carmela St
Hudson, IA 50643
|
1,832 sq. feet
|
3 baths 3 beds |
show details | |

|
#36
River Forest Rd
Evansdale, IA 50707
|
1,808 sq. feet
|
1 baths 3 beds |
show details | |

|
#37
S Evans Rd
Evansdale, IA 50707
|
1,035 sq. feet
|
1 baths 2 beds |
show details | |

|
#38
E End Ave
Evansdale, IA 50707
|
576 sq. feet
|
2 baths 2 beds |
show details | |

|
#39
Letsch Rd
Waterloo, IA 50701
|
1,204 sq. feet
|
2 baths 3 beds |
show details | |

|
#40
Norris Ct
Waterloo, IA 50701
|
1,435 sq. feet
|
1 baths 3 beds |
show details |
| Photo | Address | Area | Beds / Baths | Price | Details |
|---|---|---|---|---|---|

|
#41
E Dunkerton Rd
Waterloo, IA 50703
|
1,452 sq. feet
|
3 baths 4 beds |
show details | |

|
#42
E Sycamore St
Dunkerton, IA 50626
|
1,428 sq. feet
|
1 baths 3 beds |
show details | |

|
#43
Byron Ave
Waterloo, IA 50702
|
752 sq. feet
|
1 baths 2 beds |
show details | |

|
#44
Randolph St
Waterloo, IA 50702
|
1,024 sq. feet
|
1 baths 3 beds |
show details | |

|
#45
Downing Ave
Waterloo, IA 50701
|
1,268 sq. feet
|
1 baths 3 beds |
show details | |

|
#46
W Dale St
Waterloo, IA 50703
|
1,113 sq. feet
|
1 baths 3 beds |
show details | |

|
#47
Longfellow Ave
Waterloo, IA 50703
|
1,566 sq. feet
|
1 baths 3 beds |
show details | |

|
#48
Woodmayr Dr
Waterloo, IA 50703
|
1,438 sq. feet
|
3 baths 3 beds |
show details | |

|
#49
Downing Ave
Waterloo, IA 50701
|
1,144 sq. feet
|
1 baths 4 beds |
show details | |

|
Check over 1 million property listings on Foreclosure.com!
|
browse all offers | |||


Median year apartment built: 1973
Household type by relationship:
Households: 40,447- Male householders: 7,993 (1,975 living alone), Female householders: 7,361 (2,576 living alone)
7,082 spouses (7,037 opposite-sex spouses), 958 unmarried partners, (928 opposite-sex unmarried partners), 8,222 children (7,822 natural, 94 adopted, 305 stepchildren), 154 grandchildren, 385 brothers or sisters, 175 parents, 73 foster children, 192 other relatives, 4,447 non-relatives
- In group quarters: 3,398
Size of family households: 3,927 2-persons, 1,324 3-persons, 1,687 4-persons, 832 5-persons, 390 6-persons, 155 7-or-more-persons.
Size of nonfamily households: 4,647 1-person, 1,851 2-persons, 577 3-persons, 255 4-persons, 47 5-persons, 15 6-persons.
4,734 married couples with children.
1,471 single-parent households (559 men, 912 women).
93.2% of residents of Cedar Falls speak English at home.
2.2% of residents speak Spanish at home (83% speak English very well, 8% speak English well, 2% speak English not well, 7% don't speak English at all).
2.9% of residents speak other Indo-European language at home (70% speak English very well, 21% speak English well, 8% speak English not well, 1% don't speak English at all).
1.2% of residents speak Asian or Pacific Island language at home (77% speak English very well, 21% speak English well, 2% speak English not well).
0.2% of residents speak other language at home (70% speak English very well, 30% speak English well).
Foreign born population: 2,225 (5.5%)
(53.3% of them are naturalized citizens)
| Here: | 7.3 |
| State: | 6.8 |
| Here: | 4.4 |
| State: | 4.2 |
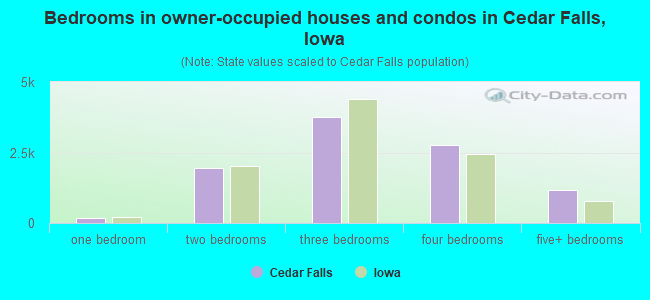
- Bedrooms in owner-occupied houses and condos in Cedar Falls, Iowa
- 14no bedroom
- 1611 bedroom
- 1,9562 bedrooms
- 3,7643 bedrooms
- 2,7584 bedrooms
- 1,1865+ bedrooms
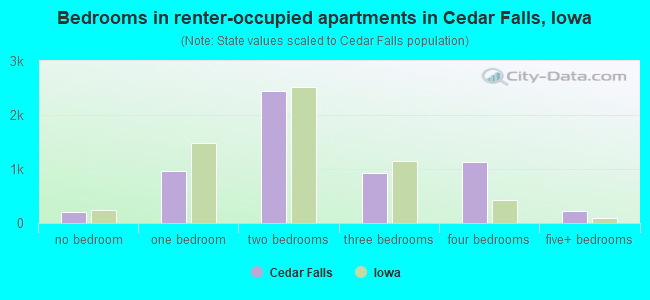
- Bedrooms in renter-occupied apartments in Cedar Falls, Iowa
- 211no bedroom
- 9641 bedroom
- 2,4472 bedrooms
- 9303 bedrooms
- 1,1314 bedrooms
- 2135+ bedrooms
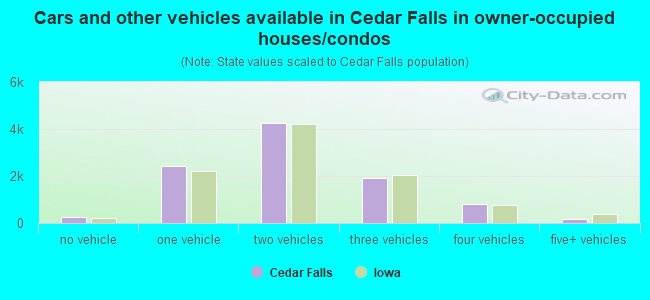
- Cars and other vehicles available in Cedar Falls in owner-occupied houses/condos
- 239no vehicle
- 2,4381 vehicle
- 4,2442 vehicles
- 1,9353 vehicles
- 8094 vehicles
- 1725+ vehicles
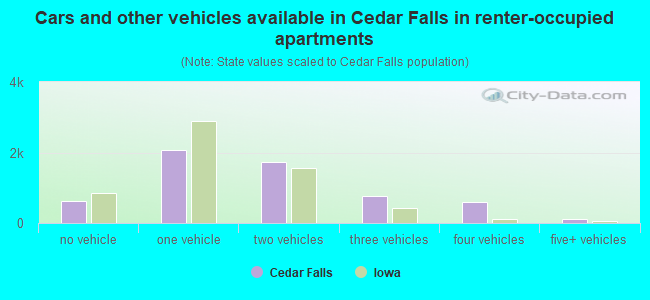
- Cars and other vehicles available in Cedar Falls in renter-occupied apartments
- 631no vehicle
- 2,0671 vehicle
- 1,7272 vehicles
- 7643 vehicles
- 6054 vehicles
- 1025+ vehicles
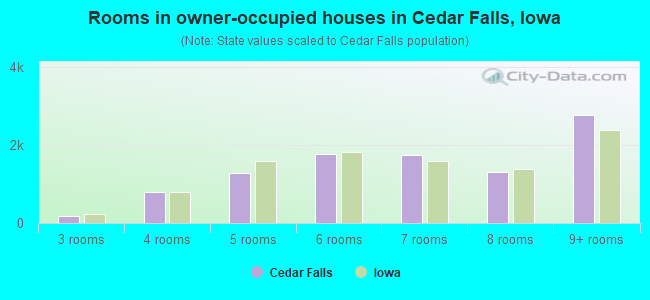
- Rooms in owner-occupied houses in Cedar Falls, Iowa
- 141 room
- 92 rooms
- 1733 rooms
- 7904 rooms
- 1,2815 rooms
- 1,7686 rooms
- 1,7317 rooms
- 1,3048 rooms
- 2,7689+ rooms
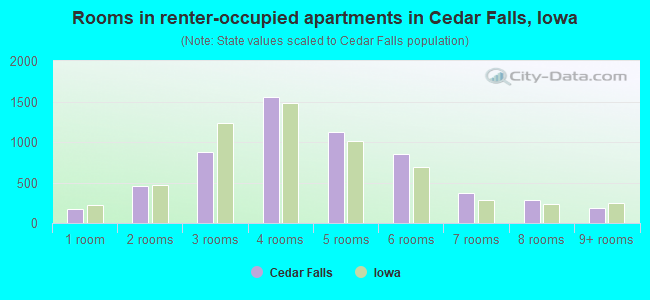
- Rooms in renter-occupied apartments in Cedar Falls, Iowa
- 1791 room
- 4612 rooms
- 8783 rooms
- 1,5534 rooms
- 1,1195 rooms
- 8476 rooms
- 3767 rooms
- 2898 rooms
- 1909+ rooms
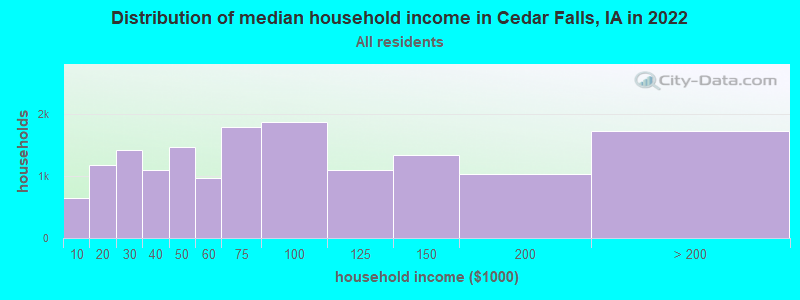
Cedar Falls, IA household income distribution

- 645Less than $10,000
- 1,188$10,000 to $19,999
- 1,418$20,000 to $29,999
- 1,106$30,000 to $39,999
- 1,474$40,000 to $49,999
- 966$50,000 to $59,999
- 1,793$60,000 to $74,999
- 1,877$75,000 to $99,999
- 1,103$100,000 to $124,999
- 1,341$125,000 to $149,999
- 1,029$150,000 to $199,999
- 1,724$200,000 or more
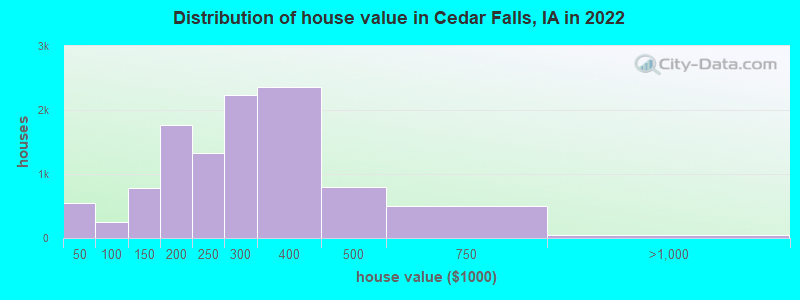
Home value of owner - occupied houses in 2022 in Cedar Falls, IA
-
- 261Less than $10,000
- 30$10,000 to $14,999
- 33$15,000 to $19,999
- 28$20,000 to $24,999
- 48$25,000 to $29,999
- 60$30,000 to $34,999
- 46$35,000 to $39,999
- 33$40,000 to $49,999
- 38$50,000 to $59,999
- 14$60,000 to $69,999
- 8$70,000 to $79,999
- 76$80,000 to $89,999
- 75$90,000 to $99,999
- 327$100,000 to $124,999
- 460$125,000 to $149,999
- 1,019$150,000 to $174,999
- 741$175,000 to $199,999
- 1,321$200,000 to $249,999
- 2,226$250,000 to $299,999
- 2,365$300,000 to $399,999
- 800$400,000 to $499,999
- 495$500,000 to $749,999
- 26$750,000 to $999,999
- 22$2,000,000 or more
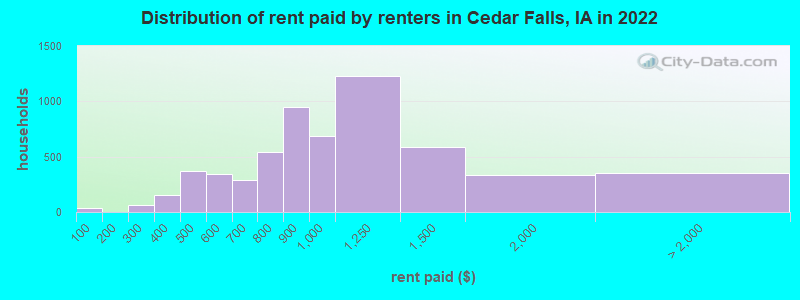
Rent paid by renters in 2022 in Cedar Falls, IA
-
- 38Less than $100
- 25$200 to $249
- 36$250 to $299
- 10$300 to $349
- 146$350 to $399
- 299$400 to $449
- 74$450 to $499
- 207$500 to $549
- 138$550 to $599
- 111$600 to $649
- 177$650 to $699
- 121$700 to $749
- 420$750 to $799
- 949$800 to $899
- 684$900 to $999
- 1,230$1,000 to $1,249
- 591$1,250 to $1,499
- 331$1,500 to $1,999
- 95$2,000 to $2,499
- 36$2,500 to $2,999
- 218No cash rent
Percentage of workers working in this county: 94.8%
Number of people working at home: 2,628 (11.4% of all workers)
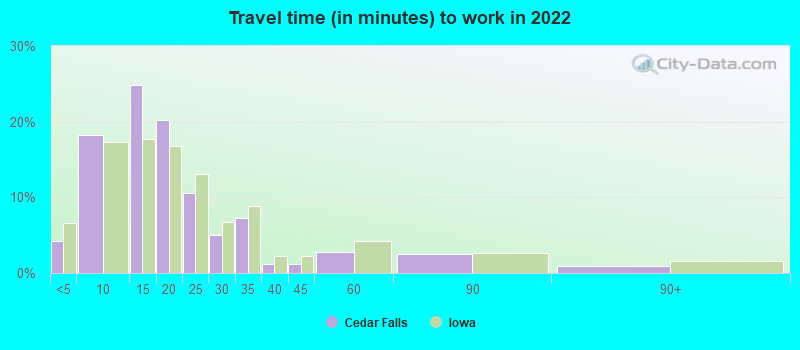
Travel time to work (commute)
- Less than 5 minutes: 956
- 5 to 9 minutes: 4,763
- 10 to 14 minutes: 5,601
- 15 to 19 minutes: 4,646
- 20 to 24 minutes: 2,229
- 25 to 29 minutes: 565
- 30 to 34 minutes: 578
- 35 to 39 minutes: 70
- 40 to 44 minutes: 104
- 45 to 59 minutes: 198
- 60 to 89 minutes: 192
- 90 or more minutes: 144
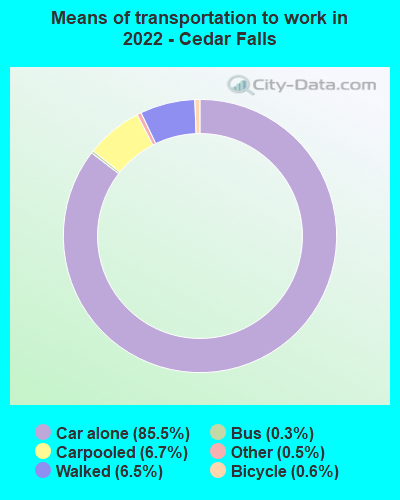
Means of transportation to work:
- Drove a car alone: 20,966 (76.6%)
- Carpooled: 1,725 (6.3%)
- Bus: 64 (0.2%)
- Taxi: 120 (0.4%)
- Bicycle: 184 (0.7%)
- Walked: 1,589 (5.8%)
- Worked at home: 2,628 (9.6%)
- Unemployment by race in 2022
- Unemployment rate for White non-Hispanic residents
- 4.3%Males
- 1.4%Females
- Unemployment rate for Black residents
- 8.9%Males
- 3.7%Females
- Unemployment rate for Asian residents
- 2.5%Males
- 0.7%Females
- Unemployment rate for two or more race residents
- 2.3%Males
- 14.8%Females
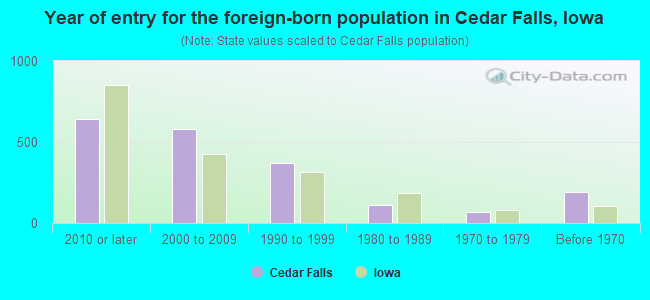
- Year of entry for the foreign-born population in Cedar Falls, Iowa
- 6402010 or later
- 5812000 to 2009
- 3701990 to 1999
- 1141980 to 1989
- 681970 to 1979
- 194Before 1970
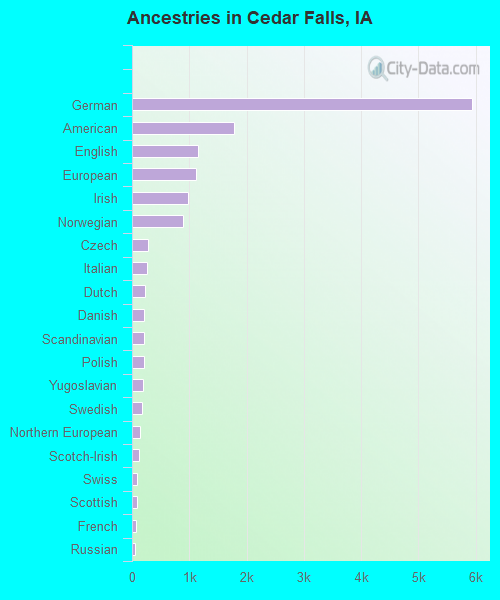
First ancestries reported:
- German: 5,938 (33.1%)
- American: 1,785 (10.0%)
- English: 1,157 (6.5%)
- European: 1,125 (6.3%)
- Irish: 982 (5.5%)
- Norwegian: 890 (5.0%)
- Czech: 280 (1.6%)
- Italian: 262 (1.5%)
- Dutch: 228 (1.3%)
- Danish: 216 (1.2%)
- Scandinavian: 214 (1.2%)
- Polish: 209 (1.2%)
- Yugoslavian: 192 (1.1%)
- Swedish: 180 (1.0%)
- Northern European: 142 (0.8%)
- Scotch-Irish: 124 (0.7%)
- Swiss: 95 (0.5%)
- Scottish: 92 (0.5%)
- French: 74 (0.4%)
- Russian: 54 (0.3%)
- Jamaican: 46 (0.3%)
- French Canadian: 34 (0.2%)
- Austrian: 33 (0.2%)
- Lebanese: 32 (0.2%)
- Iranian: 31 (0.2%)
- Turkish: 28 (0.2%)
- Greek: 27 (0.2%)
- British: 25 (0.1%)
- Slovak: 23 (0.1%)
- Eastern European: 20 (0.1%)
- Ghanaian: 19 (0.1%)
- Belgian: 18 (0.1%)
- Luxembourger: 10 (0.06%)
- Finnish: 9 (0.05%)
- Lithuanian: 6 (0.03%)
- African: 6 (0.03%)
- Ethiopian: 1 (0.01%)
Most common places of birth for foreign-born residents (%):
| Cedar Falls: | 19.6% (401) |
| Iowa: | 6.2% (11,148) |
| Cedar Falls: | 16.3% (332) |
| Iowa: | 0.6% (1,157) |
| Cedar Falls: | 8.5% (173) |
| Iowa: | 0.2% (295) |
| Cedar Falls: | 6.9% (140) |
| Iowa: | 23.3% (41,625) |
| Cedar Falls: | 6.8% (139) |
| Iowa: | 2.9% (5,155) |
| Cedar Falls: | 3.7% (76) |
| Iowa: | 4.6% (8,194) |
| Cedar Falls: | 3.2% (66) |
| Iowa: | 0.2% (321) |
| Cedar Falls: | 3.2% (65) |
| Iowa: | 3.2% (5,751) |
| Cedar Falls: | 3.1% (63) |
| Iowa: | 0.7% (1,227) |
| Cedar Falls: | 2.9% (59) |
| Iowa: | 0.5% (920) |
| Cedar Falls: | 2.5% (52) |
| Iowa: | 2.6% (4,675) |
| Cedar Falls: | 2.5% (51) |
| Iowa: | 4.2% (7,428) |
| Cedar Falls: | 2.2% (44) |
| Iowa: | 0.2% (435) |
| Cedar Falls: | 2.2% (44) |
| Iowa: | 0.7% (1,326) |
| Cedar Falls: | 2.0% (41) |
| Iowa: | 0.8% (1,425) |
| Cedar Falls: | 1.5% (31) |
| Iowa: | 1.6% (2,873) |
Place of birth for U.S.-born residents:
- This state: 30,452
- Other state: 7,295
- Northeast: 795
- Midwest: 4,240
- South: 974
- West: 1,114
73.7% of Cedar Falls residents lived in the same house 1 years ago.
Out of people who lived in different houses, 34.2% lived in this county.
Out of people who lived in different counties, 85.3% lived in Iowa.
| Cedar Falls: | 73.7% |
| State average: | 87.2% |
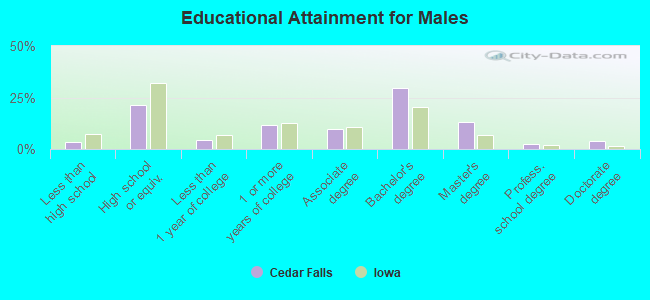
Education attainment for males 25 years and older:
- No schooling: 37
- Nursery to 4th grade: 13
- 5th and 6th grade: 0
- 7th and 8th grade: 44
- 9th grade: 40
- 10th grade: 30
- 11th grade: 80
- 12th grade, no diploma: 139
- High school graduate (or equivalency): 2,277
- Less than 1 year of college: 488
- Some college more than 1 year, no degree: 1,266
- Associate degree: 1,050
- Bachelor's degree: 3,179
- Master's degree: 1,423
- Professional school degree: 279
- Doctorate degree: 423
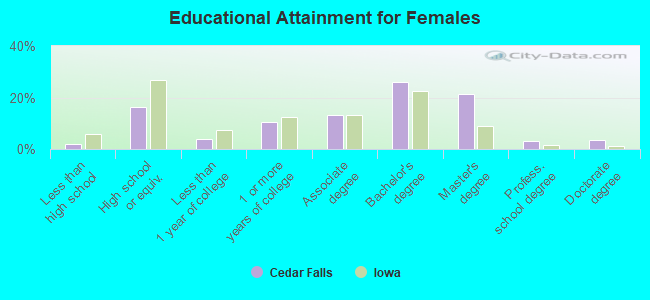
Education attainment for females 25 years and older:
- No schooling: 0
- Nursery to 4th grade: 25
- 5th and 6th grade: 0
- 7th and 8th grade: 30
- 9th grade: 18
- 10th grade: 41
- 11th grade: 56
- 12th grade, no diploma: 42
- High school graduate (or equivalency): 1,932
- Less than 1 year of college: 449
- Some college more than 1 year, no degree: 1,247
- Associate degree: 1,581
- Bachelor's degree: 3,096
- Master's degree: 2,544
- Professional school degree: 385
- Doctorate degree: 398
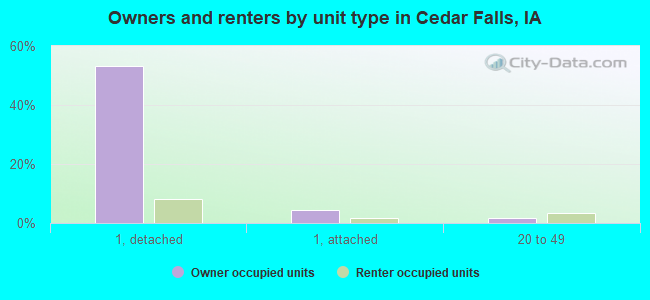
Housing units in structures:
- One, detached: 10,098
- One, attached: 1,154
- Two: 557
- 3 or 4: 681
- 5 to 9: 550
- 10 to 19: 1,435
- 20 to 49: 642
- 50 or more: 992
- Mobile homes: 568
Median worth of mobile homes: $11,960
Housing units lacking complete kitchen facilities in 2022: 2.4%
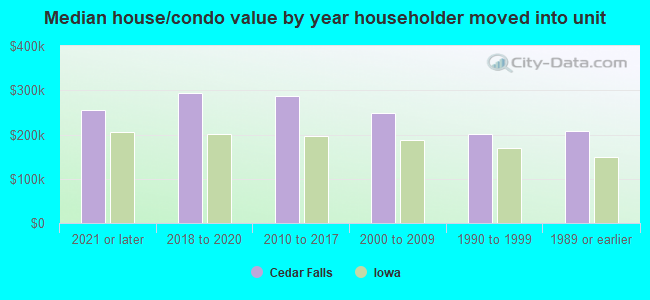
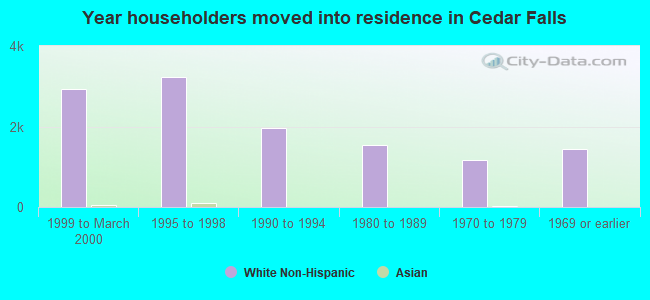
House/condo owner moved in on average 8 years ago
Renter moved in on average 1 years ago
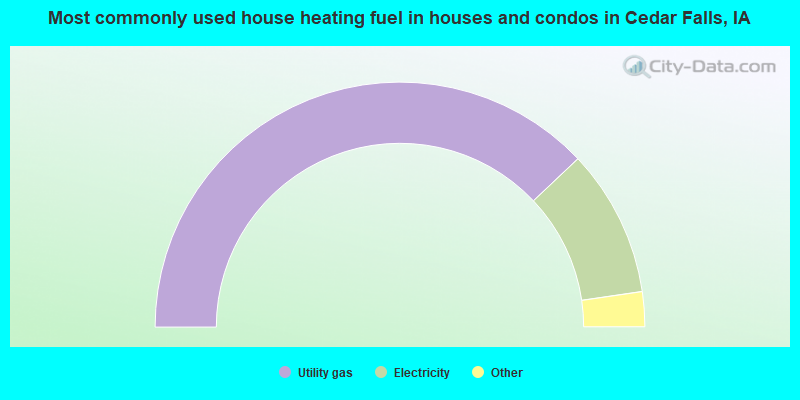
- 75.9%Utility gas
- 19.5%Electricity
- 2.9%Bottled, tank, or LP gas
- 1.2%Other fuel
- 0.3%No fuel used
- 0.2%Wood
- 0.1%Fuel oil, kerosene, etc.
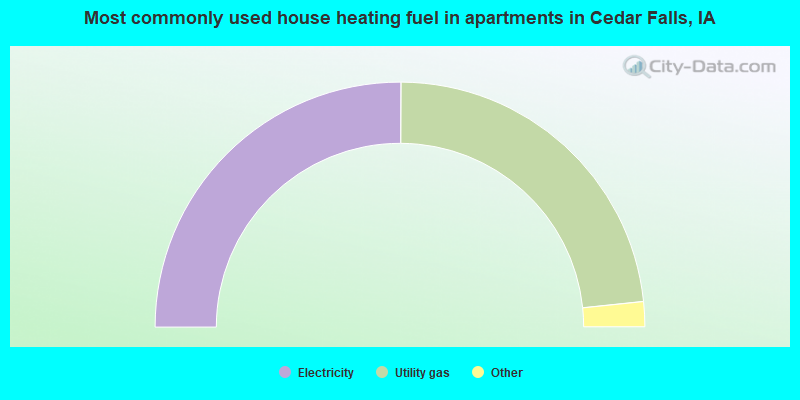
- 50.2%Electricity
- 46.6%Utility gas
- 2.1%Bottled, tank, or LP gas
- 0.9%No fuel used
- 0.3%Other fuel
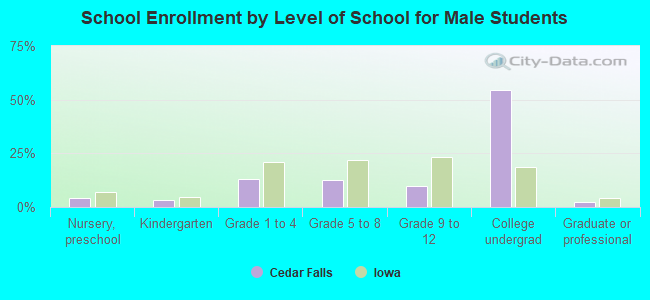
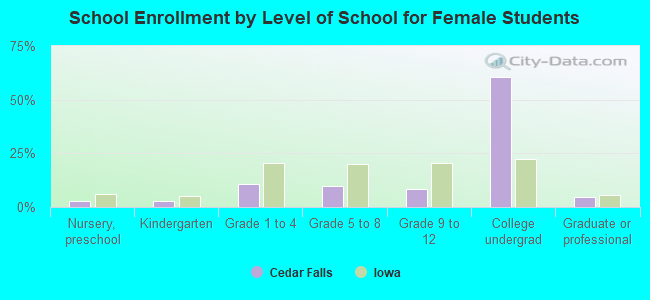
Private vs. public school enrollment:
| Here: | 8.6% |
| Iowa: | 10.6% |
| Here: | 9.4% |
| Iowa: | 7.9% |
| Here: | 4.9% |
| Iowa: | 23.9% |