Cedar Springs, MI (Michigan) Houses and Residents
| Cedar Springs: | $218,969 |
| Michigan: | $224,400 |
Mean price in 2022:
Detached houses: $178,326
Here: $178,326 State: $280,038 Townhouses or other attached units: $193,157
Here: $193,157 State: $239,520 Mobile homes: $82,836
Here: $82,836 State: $72,868
Total population: 3,601 (Urban population: 2,961 (all inside urban clusters), Rural population: 202 (all nonfarm))
Houses: 1,639 (1,558 occupied: 889 owner occupied, 669 renter occupied)
| % of renters here: | 43% |
| State: | 27% |
Housing density: 896 houses/condos per square mile
Median price asked for vacant for-sale houses and condos in 2022 in this county: $134,376.
Median contract rent in 2022: $936 (lower quartile is $723, upper quartile is $1,048)
Median rent asked for vacant for-rent units in 2022: $1,260
Median gross rent in Cedar Springs, MI in 2022: $1,081
Housing units in Cedar Springs with a mortgage: 574 (32 second mortgage, 0 home equity loan, 13 both second mortgage and home equity loan)
Houses without a mortgage: 17
Median household income for houses/condos with a mortgage: $77,772
Median household income for apartments without a mortgage: $51,282
Median monthly housing costs: $1,066
Compare current foreclosures near Cedar Springs, MI:
| Photo | Address | Area | Beds / Baths | Price | Details |
|---|---|---|---|---|---|

|
#1
Prairie Run Dr
Cedar Springs, MI 49319
|
1,613 sq. feet
|
2 baths 2 beds |
show details | |

|
#2
Hemlock Ave
Cedar Springs, MI 49319
|
- sq. feet
|
- baths - beds |
show details | |

|
#3
Shaner Ave NE
Cedar Springs, MI 49319
|
- sq. feet
|
- baths - beds |
show details | |

|
#4
Edgerton Ave
Cedar Springs, MI 49319
|
- sq. feet
|
- baths - beds |
show details | |

|
#5
Lilyfield
Cedar Springs, MI 49319
|
- sq. feet
|
- baths - beds |
show details | |

|
#6
Winston View Dr NE
Cedar Springs, MI 49319
|
- sq. feet
|
- baths - beds |
show details | |

|
#7
Allen
Cedar Springs, MI 49319
|
- sq. feet
|
- baths - beds |
show details | |

|
#8
Wagonwheel Ct NE
Cedar Springs, MI 49319
|
- sq. feet
|
- baths - beds |
show details | |

|
#9
18 Mile Rd NE
Cedar Springs, MI 49319
|
- sq. feet
|
- baths - beds |
show details | |

|
#10
Myers Lake Ave NE
Cedar Springs, MI 49319
|
- sq. feet
|
- baths - beds |
show details |
| Photo | Address | Area | Beds / Baths | Price | Details |
|---|---|---|---|---|---|

|
#11
Redmond Ave
Cedar Springs, MI 49319
|
- sq. feet
|
- baths - beds |
show details | |

|
#12
Doe Dr NE
Cedar Springs, MI 49319
|
- sq. feet
|
- baths - beds |
show details | |

|
#13
Prairie Run Dr
Cedar Springs, MI 49319
|
- sq. feet
|
- baths - beds |
show details | |

|
#14
Crawford Lake Trl
Cedar Springs, MI 49319
|
- sq. feet
|
- baths - beds |
show details | |

|
#15
Algoma Ave NE
Cedar Springs, MI 49319
|
- sq. feet
|
- baths - beds |
show details | |

|
#16
18 Mile Rd NE
Cedar Springs, MI 49319
|
- sq. feet
|
- baths - beds |
show details | |

|
#17
18 Mile Rd NE
Cedar Springs, MI 49319
|
- sq. feet
|
- baths - beds |
show details | |

|
#18
Winston View Dr NE
Cedar Springs, MI 49319
|
- sq. feet
|
- baths - beds |
show details | |

|
#19
Penny Ave NE
Cedar Springs, MI 49319
|
- sq. feet
|
- baths - beds |
show details | |

|
#20
Sandy Oak Trl
Cedar Springs, MI 49319
|
- sq. feet
|
- baths - beds |
show details |
| Photo | Address | Area | Beds / Baths | Price | Details |
|---|---|---|---|---|---|

|
#21
18 Mile Rd NE
Cedar Springs, MI 49319
|
- sq. feet
|
- baths - beds |
show details | |

|
#22
E Pearl St
Greenville, MI 48838
|
1,472 sq. feet
|
1 baths 3 beds |
show details | |

|
#23
Miramar Ave NE
Grand Rapids, MI 49525
|
1,016 sq. feet
|
1 baths 3 beds |
show details | |

|
#24
E 88th St
Newaygo, MI 49337
|
1,500 sq. feet
|
2 baths 3 beds |
show details | |

|
#25
Almy Rd
Howard City, MI 49329
|
1,352 sq. feet
|
2 baths 3 beds |
show details | |

|
#26
Dana St NW
Comstock Park, MI 49321
|
880 sq. feet
|
2 baths 3 beds |
show details | |

|
#27
Fuller Ave NE
Grand Rapids, MI 49505
|
1,274 sq. feet
|
1 baths 3 beds |
show details | |

|
#28
W Johnson Ct
Greenville, MI 48838
|
1,032 sq. feet
|
1 baths 3 beds |
show details | |

|
#29
Willow Ave
Grant, MI 49327
|
- sq. feet
|
2 baths 3 beds |
show details | |

|
#30
Silver Beach Dr
Gowen, MI 49326
|
1,358 sq. feet
|
1 baths 3 beds |
show details |
| Photo | Address | Area | Beds / Baths | Price | Details |
|---|---|---|---|---|---|

|
#31
Lincoln St
Grant, MI 49327
|
1,646 sq. feet
|
2 baths 3 beds |
show details | |

|
#32
Bittersweet Dr NE
Belmont, MI 49306
|
1,046 sq. feet
|
2 baths 3 beds |
show details | |

|
#33
Ritchie Ave
Sand Lake, MI 49343
|
1,097 sq. feet
|
2 baths 3 beds |
show details | |

|
#34
Harding St NW
Grand Rapids, MI 49544
|
1,526 sq. feet
|
2 baths 3 beds |
show details | |

|
#35
Prospect St
Sparta, MI 49345
|
- sq. feet
|
1 baths 4 beds |
show details | |

|
#36
W Pine Dr
Greenville, MI 48838
|
- sq. feet
|
1 baths 2 beds |
show details | |

|
#37
Green Timber Ct
Greenville, MI 48838
|
- sq. feet
|
2 baths 3 beds |
show details | |

|
#38
Monroe Ave NW
Grand Rapids, MI 49505
|
- sq. feet
|
1 baths 4 beds |
show details | |

|
#39
Exchange St
Grant, MI 49327
|
- sq. feet
|
2 baths 2 beds |
show details | |

|
#40
Shaw Rd
Bailey, MI 49303
|
1,384 sq. feet
|
1 baths - beds |
show details |
| Photo | Address | Area | Beds / Baths | Price | Details |
|---|---|---|---|---|---|

|
#41
Chary Glen Dr
Kent City, MI 49330
|
- sq. feet
|
- baths - beds |
show details | |

|
#42
S Kohler Rd
Trufant, MI 49347
|
- sq. feet
|
- baths - beds |
show details | |

|
#43
Knob Hill Dr NE
Grand Rapids, MI 49525
|
- sq. feet
|
- baths - beds |
show details | |

|
#44
Coventry Woods Dr NE
Belmont, MI 49306
|
- sq. feet
|
- baths - beds |
show details | |

|
#45
Falcon Dr
Sand Lake, MI 49343
|
- sq. feet
|
- baths - beds |
show details | |

|
#46
Country View Dr
Sparta, MI 49345
|
- sq. feet
|
- baths - beds |
show details | |

|
#47
Northfield Ave NE
Grand Rapids, MI 49505
|
- sq. feet
|
- baths - beds |
show details | |

|
#48
Grant St
Howard City, MI 49329
|
- sq. feet
|
- baths - beds |
show details | |

|
#49
Johnson Rd
Greenville, MI 48838
|
- sq. feet
|
- baths - beds |
show details | |

|
Check over 1 million property listings on Foreclosure.com!
|
browse all offers | |||


Median year apartment built: 1972
Household type by relationship:
Households: 3,655- Male householders: 631 (137 living alone), Female householders: 909 (364 living alone)
574 spouses (574 opposite-sex spouses), 277 unmarried partners, (261 opposite-sex unmarried partners), 1,048 children (953 natural, 0 adopted, 95 stepchildren), 8 grandchildren, 15 brothers or sisters, 0 parents, 0 foster children, 44 other relatives, 64 non-relatives
- In group quarters: 82
Size of family households: 426 2-persons, 159 3-persons, 167 4-persons, 60 5-persons, 45 6-persons.
Size of nonfamily households: 530 1-person, 165 2-persons, 24 3-persons.
235 married couples with children.
544 single-parent households (119 men, 425 women).
96.7% of residents of Cedar Springs speak English at home.
1.4% of residents speak Spanish at home (100% speak English very well).
0.7% of residents speak other Indo-European language at home (100% speak English very well).
Foreign born population: 8 (0.2%)
(0.0% of them are naturalized citizens)
| Here: | 6.5 |
| State: | 6.5 |
| Here: | 5.0 |
| State: | 4.3 |

- Bedrooms in owner-occupied houses and condos in Cedar Springs, Michigan
- 0no bedroom
- 351 bedroom
- 1542 bedrooms
- 4583 bedrooms
- 2414 bedrooms
- 05+ bedrooms

- Bedrooms in renter-occupied apartments in Cedar Springs, Michigan
- 0no bedroom
- 1021 bedroom
- 3602 bedrooms
- 1663 bedrooms
- 414 bedrooms
- 05+ bedrooms

- Cars and other vehicles available in Cedar Springs in owner-occupied houses/condos
- 17no vehicle
- 2251 vehicle
- 4402 vehicles
- 1053 vehicles
- 874 vehicles
- 145+ vehicles

- Cars and other vehicles available in Cedar Springs in renter-occupied apartments
- 61no vehicle
- 3871 vehicle
- 1762 vehicles
- 323 vehicles
- 124 vehicles
- 05+ vehicles

- Rooms in owner-occupied houses in Cedar Springs, Michigan
- 01 room
- 02 rooms
- 03 rooms
- 1154 rooms
- 1905 rooms
- 1586 rooms
- 2177 rooms
- 1368 rooms
- 749+ rooms

- Rooms in renter-occupied apartments in Cedar Springs, Michigan
- 01 room
- 392 rooms
- 1613 rooms
- 844 rooms
- 875 rooms
- 2266 rooms
- 357 rooms
- 368 rooms
- 09+ rooms


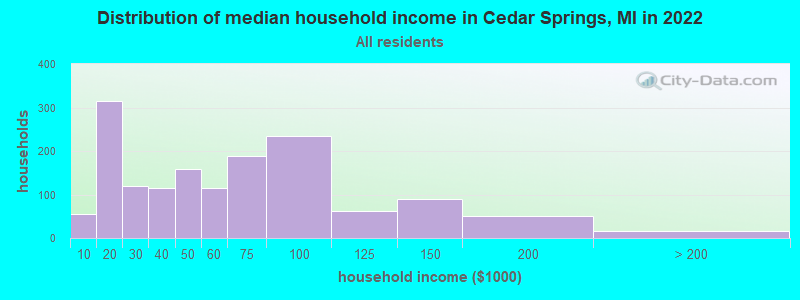
Cedar Springs, MI household income distribution

- 55Less than $10,000
- 314$10,000 to $19,999
- 120$20,000 to $29,999
- 116$30,000 to $39,999
- 158$40,000 to $49,999
- 116$50,000 to $59,999
- 188$60,000 to $74,999
- 235$75,000 to $99,999
- 61$100,000 to $124,999
- 90$125,000 to $149,999
- 50$150,000 to $199,999
- 17$200,000 or more
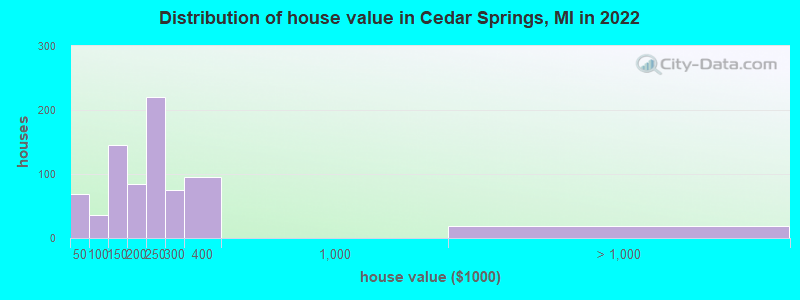
Home value of owner - occupied houses in 2022 in Cedar Springs, MI
-
- 27Less than $10,000
- 14$10,000 to $14,999
- 25$25,000 to $29,999
- 15$60,000 to $69,999
- 20$90,000 to $99,999
- 113$100,000 to $124,999
- 30$125,000 to $149,999
- 22$150,000 to $174,999
- 61$175,000 to $199,999
- 220$200,000 to $249,999
- 74$250,000 to $299,999
- 95$300,000 to $399,999
- 17$2,000,000 or more
Rent paid by renters in 2022 in Cedar Springs, MI
-
- 7Less than $100
- 4$150 to $199
- 7$200 to $249
- 15$500 to $549
- 33$550 to $599
- 43$600 to $649
- 52$650 to $699
- 59$700 to $749
- 12$750 to $799
- 85$800 to $899
- 169$900 to $999
- 57$1,000 to $1,249
- 8$2,000 to $2,499


Percentage of workers working in this county: 84.9%
Number of people working at home: 161 (8.9% of all workers)
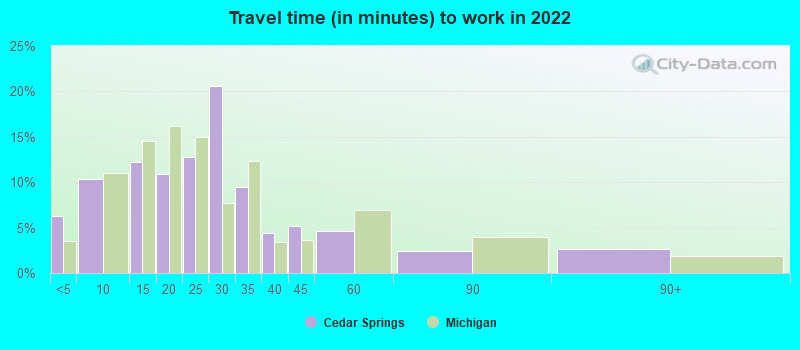
Travel time to work (commute)
- Less than 5 minutes: 151
- 5 to 9 minutes: 205
- 10 to 14 minutes: 73
- 15 to 19 minutes: 153
- 20 to 24 minutes: 186
- 25 to 29 minutes: 275
- 30 to 34 minutes: 174
- 35 to 39 minutes: 141
- 40 to 44 minutes: 71
- 45 to 59 minutes: 91
- 60 to 89 minutes: 74
- 90 or more minutes: 47
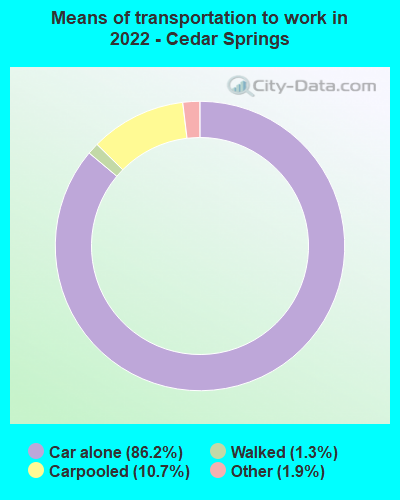
Means of transportation to work:
- Drove a car alone: 2,269 (79.7%)
- Carpooled: 288 (10.1%)
- Taxi: 73 (2.6%)
- Walked: 32 (1.1%)
- Worked at home: 161 (5.7%)

- Unemployment by race in 2022
- Unemployment rate for White non-Hispanic residents
- 4.3%Males
- 2.3%Females
- Unemployment rate for other race residents
- 100.0%Females
- Unemployment rate for Hispanic or Latino residents
- 21.9%Females

- Year of entry for the foreign-born population in Cedar Springs, Michigan
- 02010 or later
- 02000 to 2009
- 71990 to 1999
- 191980 to 1989
- 01970 to 1979
- 7Before 1970

First ancestries reported:
- Dutch: 175 (15.4%)
- English: 106 (9.3%)
- German: 101 (8.9%)
- Irish: 89 (7.8%)
- European: 63 (5.5%)
- American: 58 (5.1%)
- Danish: 49 (4.3%)
- Scotch-Irish: 35 (3.1%)
- French: 33 (2.9%)
- Scottish: 28 (2.5%)
- Polish: 26 (2.3%)
- Norwegian: 24 (2.1%)
- Swedish: 17 (1.5%)
- French Canadian: 11 (1.0%)
Most common places of birth for foreign-born residents (%):
| Cedar Springs: | 87.5% (7) |
| Michigan: | 1.8% (12,679) |
Place of birth for U.S.-born residents:
- This state: 3,131
- Other state: 493
- Northeast: 45
- Midwest: 78
- South: 377
- West: 0
88.4% of Cedar Springs residents lived in the same house 1 years ago.
Out of people who lived in different houses, 36.2% lived in this county.
Out of people who lived in different counties, 80.5% lived in Michigan.
| Cedar Springs: | 88.4% |
| State average: | 88.4% |
Education attainment for males 25 years and older:
- No schooling: 40
- Nursery to 4th grade: 0
- 5th and 6th grade: 0
- 7th and 8th grade: 0
- 9th grade: 11
- 10th grade: 49
- 11th grade: 10
- 12th grade, no diploma: 13
- High school graduate (or equivalency): 352
- Less than 1 year of college: 66
- Some college more than 1 year, no degree: 230
- Associate degree: 118
- Bachelor's degree: 107
- Master's degree: 59
- Professional school degree: 0
- Doctorate degree: 19

Education attainment for females 25 years and older:
- No schooling: 15
- Nursery to 4th grade: 0
- 5th and 6th grade: 0
- 7th and 8th grade: 6
- 9th grade: 0
- 10th grade: 27
- 11th grade: 22
- 12th grade, no diploma: 0
- High school graduate (or equivalency): 718
- Less than 1 year of college: 192
- Some college more than 1 year, no degree: 180
- Associate degree: 166
- Bachelor's degree: 91
- Master's degree: 15
- Professional school degree: 0
- Doctorate degree: 0


Housing units in structures:
- One, detached: 887
- One, attached: 42
- Two: 216
- 3 or 4: 65
- 5 to 9: 154
- 10 to 19: 24
- 20 to 49: 11
- Mobile homes: 238
House/condo owner moved in on average 16 years ago
Renter moved in on average 5 years ago

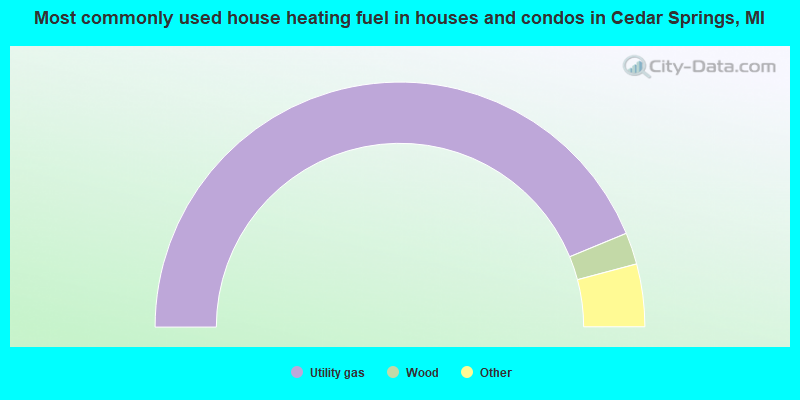
- 87.7%Utility gas
- 4.2%Wood
- 3.6%Electricity
- 3.0%Bottled, tank, or LP gas
- 1.5%Fuel oil, kerosene, etc.
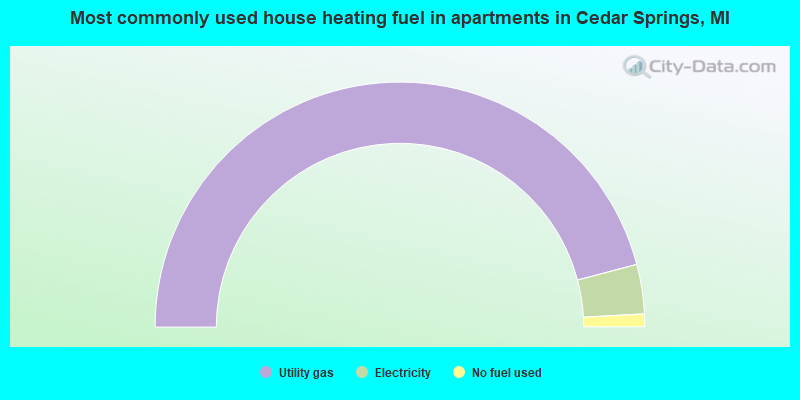
- 91.8%Utility gas
- 6.5%Electricity
- 1.7%No fuel used
Private vs. public school enrollment:
| Here: | 6.1% |
| Michigan: | 12.4% |
| Here: | 0.0% |
| Michigan: | 9.8% |
| Here: | 32.3% |
| Michigan: | 14.9% |


