Centerville, IN (Indiana) Houses and Residents
| Centerville: | $143,988 |
| Indiana: | $208,700 |
Total population: 2,603 (Urban population: 2,467 (all inside urban clusters), Rural population: 9 (all nonfarm))
Houses: 1,203 (1,084 occupied: 748 owner occupied, 352 renter occupied)
| % of renters here: | 32% |
| State: | 29% |
Housing density: 1,200 houses/condos per square mile
Median price asked for vacant for-sale houses and condos in 2022: $114,482.
Median contract rent in 2022: $596 (lower quartile is $436, upper quartile is $651)
Median rent asked for vacant for-rent units in 2022: $590
Median gross rent in Centerville, IN in 2022: $761
Housing units in Centerville with a mortgage: 542 (84 second mortgage, 8 home equity loan, 38 both second mortgage and home equity loan)
Houses without a mortgage: 7
Median household income for houses/condos with a mortgage: $70,089
Median household income for apartments without a mortgage: $36,966
Median monthly housing costs: $867
Compare current foreclosures near Centerville, IN:
| Photo | Address | Area | Beds / Baths | Price | Details |
|---|---|---|---|---|---|

|
#1
Elm Dr
Centerville, IN 47330
|
1,280 sq. feet
|
2 baths 3 beds |
show details | |

|
#2
Gates Rd
Centerville, IN 47330
|
1,088 sq. feet
|
1 baths 2 beds |
show details | |

|
#3
W Us Highway 40
Centerville, IN 47330
|
1,048 sq. feet
|
1 baths 3 beds |
show details | |

|
#4
N Centerville Rd
Centerville, IN 47330
|
1,248 sq. feet
|
1 baths 3 beds |
show details | |

|
#5
E South St
Centerville, IN 47330
|
1,400 sq. feet
|
2 baths 3 beds |
show details | |

|
#6
Mcconaha Rd
Centerville, IN 47330
|
928 sq. feet
|
1 baths 2 beds |
show details | |

|
#7
E South St
Centerville, IN 47330
|
864 sq. feet
|
1 baths 3 beds |
show details | |

|
#8
Beech Ave
Centerville, IN 47330
|
- sq. feet
|
- baths - beds |
show details | |

|
#9
S A St
Richmond, IN 47374
|
976 sq. feet
|
1 baths 3 beds |
$119,900
|
show details |

|
#10
Three Witts Rd
Centerville, IN 47330
|
- sq. feet
|
- baths - beds |
show details |
| Photo | Address | Area | Beds / Baths | Price | Details |
|---|---|---|---|---|---|

|
#11
S 10th St
Richmond, IN 47374
|
1,154 sq. feet
|
1 baths 3 beds |
$24,900
|
show details |

|
#12
Plum St
Cambridge City, IN 47327
|
2,646 sq. feet
|
1 baths 3 beds |
$49,900
|
show details |

|
#13
W College St
Hagerstown, IN 47346
|
2,116 sq. feet
|
1 baths 3 beds |
show details | |

|
#14
N 20th St
Richmond, IN 47374
|
1,372 sq. feet
|
1 baths 3 beds |
show details | |

|
#15
NW G St
Richmond, IN 47374
|
2,480 sq. feet
|
2 baths 4 beds |
show details | |

|
#16
S Plum St
Hagerstown, IN 47346
|
1,822 sq. feet
|
2 baths 4 beds |
show details | |

|
#17
W 29th St
Connersville, IN 47331
|
994 sq. feet
|
1 baths 2 beds |
show details | |

|
#18
N Round Barn Rd
Williamsburg, IN 47393
|
1,606 sq. feet
|
1 baths 3 beds |
show details | |

|
#19
Orchard St
Cambridge City, IN 47327
|
1,200 sq. feet
|
1 baths 2 beds |
show details | |

|
#20
Hoover Rd
Hagerstown, IN 47346
|
1,872 sq. feet
|
1 baths 3 beds |
show details |
| Photo | Address | Area | Beds / Baths | Price | Details |
|---|---|---|---|---|---|

|
#21
Gettysburg Darke Rd
New Paris, OH 45347
|
1,824 sq. feet
|
1 baths 3 beds |
show details | |

|
#22
Vermont Ave
Connersville, IN 47331
|
992 sq. feet
|
1 baths 2 beds |
show details | |

|
#23
S State Road 1
Cambridge City, IN 47327
|
2,520 sq. feet
|
2 baths 3 beds |
show details | |

|
#24
Pinehurst Dr
Richmond, IN 47374
|
1,552 sq. feet
|
2 baths 3 beds |
show details | |

|
#25
Us Route 40 # 40
New Paris, OH 45347
|
1,102 sq. feet
|
1 baths 4 beds |
show details | |

|
#26
W Fosdick Rd
Liberty, IN 47353
|
1,599 sq. feet
|
1 baths 3 beds |
show details | |

|
#27
West Dr
Richmond, IN 47374
|
2,444 sq. feet
|
2 baths 4 beds |
show details | |

|
#28
Summit Ave
Connersville, IN 47331
|
1,344 sq. feet
|
1 baths 4 beds |
show details | |

|
#29
W Us Highway 40
Cambridge City, IN 47327
|
1,584 sq. feet
|
1 baths 2 beds |
show details | |

|
#30
Southeast Pkwy
Richmond, IN 47374
|
2,238 sq. feet
|
2 baths 4 beds |
show details |
| Photo | Address | Area | Beds / Baths | Price | Details |
|---|---|---|---|---|---|

|
#31
Kensington Dr
Richmond, IN 47374
|
2,512 sq. feet
|
2 baths 3 beds |
show details | |

|
#32
Milton Rd
Cambridge City, IN 47327
|
2,312 sq. feet
|
1 baths 4 beds |
show details | |

|
#33
Beeson Rd
Richmond, IN 47374
|
1,169 sq. feet
|
1 baths 3 beds |
show details | |

|
#34
Western Ave
Connersville, IN 47331
|
1,765 sq. feet
|
1 baths 2 beds |
show details | |

|
#35
N 18th St
Richmond, IN 47374
|
1,184 sq. feet
|
1 baths 2 beds |
show details | |

|
#36
Iowa Ave
Connersville, IN 47331
|
1,047 sq. feet
|
1 baths 3 beds |
show details | |

|
#37
Virginia Ave
Connersville, IN 47331
|
1,560 sq. feet
|
2 baths 3 beds |
show details | |

|
#38
N Walnut St
Cambridge City, IN 47327
|
2,084 sq. feet
|
2 baths 3 beds |
show details | |

|
#39
Kehl St
Connersville, IN 47331
|
1,144 sq. feet
|
1 baths 3 beds |
show details | |

|
#40
N Centerville Rd
Williamsburg, IN 47393
|
2,831 sq. feet
|
2 baths 3 beds |
show details |
| Photo | Address | Area | Beds / Baths | Price | Details |
|---|---|---|---|---|---|

|
#41
Dorothy Dr
New Paris, OH 45347
|
1,372 sq. feet
|
1 baths 3 beds |
show details | |

|
#42
Richmond Ave
Connersville, IN 47331
|
1,120 sq. feet
|
2 baths 3 beds |
show details | |

|
#43
Ostheimer Ave
Connersville, IN 47331
|
1,064 sq. feet
|
1 baths 3 beds |
show details | |

|
#44
Beeson Ave
Connersville, IN 47331
|
1,227 sq. feet
|
1 baths 3 beds |
show details | |

|
#45
Richmond Ave
Connersville, IN 47331
|
1,040 sq. feet
|
1 baths 3 beds |
show details | |

|
#46
Tidewater Rd
Hagerstown, IN 47346
|
1,885 sq. feet
|
1 baths 4 beds |
show details | |

|
#47
New Paris Hillsboro Rd
New Paris, OH 45347
|
1,764 sq. feet
|
2 baths 3 beds |
show details | |

|
#48
W 16th St
Connersville, IN 47331
|
1,530 sq. feet
|
2 baths 3 beds |
show details | |

|
#49
N Eastern Ave
Connersville, IN 47331
|
2,714 sq. feet
|
3 baths 5 beds |
show details | |

|
Check over 1 million property listings on Foreclosure.com!
|
browse all offers | |||

Latest news about housing in Centerville, IN collected exclusively by city-data.com from local newspapers, TV, and radio stations

 | Considering buying in Richmond, In (13 replies) |
| 10 Things You Might Not Know About Richmond, Indiana (15 replies) |
| New Job in Richmond Indiana help! (4 replies) |
| Can anyone tell me about Lewisville (5 replies) |
| Moving to Richmond, Indiana (3 replies) |
| Any thoughts on Richmond? (5 replies) |

Median year apartment built: 1954
Household type by relationship:
Households: 2,749- Male householders: 488 (198 living alone), Female householders: 593 (114 living alone)
461 spouses (461 opposite-sex spouses), 61 unmarried partners, (57 opposite-sex unmarried partners), 732 children (703 natural, 0 adopted, 28 stepchildren), 56 grandchildren, 19 brothers or sisters, 36 parents, 0 foster children, 15 other relatives, 166 non-relatives
- In group quarters: 116
Size of family households: 371 2-persons, 151 3-persons, 146 4-persons, 29 5-persons, 23 6-persons, 23 7-or-more-persons.
Size of nonfamily households: 305 1-person, 42 2-persons.
245 married couples with children.
324 single-parent households (49 men, 275 women).
90.9% of residents of Centerville speak English at home.
8.4% of residents speak Spanish at home (84% speak English very well, 12% speak English well, 4% speak English not well).
0.2% of residents speak other Indo-European language at home (100% speak English very well).
Foreign born population: 49 (1.8%)
(61.2% of them are naturalized citizens)
| Here: | 6.4 |
| State: | 6.6 |
| Here: | 4.4 |
| State: | 4.3 |

- Bedrooms in owner-occupied houses and condos in Centerville, Indiana
- 0no bedroom
- 91 bedroom
- 1462 bedrooms
- 4093 bedrooms
- 1554 bedrooms
- 295+ bedrooms

- Bedrooms in renter-occupied apartments in Centerville, Indiana
- 36no bedroom
- 261 bedroom
- 1442 bedrooms
- 1233 bedrooms
- 04 bedrooms
- 235+ bedrooms

- Cars and other vehicles available in Centerville in owner-occupied houses/condos
- 24no vehicle
- 1931 vehicle
- 3212 vehicles
- 1843 vehicles
- 134 vehicles
- 135+ vehicles

- Cars and other vehicles available in Centerville in renter-occupied apartments
- 63no vehicle
- 1801 vehicle
- 842 vehicles
- 183 vehicles
- 74 vehicles
- 05+ vehicles

- Rooms in owner-occupied houses in Centerville, Indiana
- 01 room
- 02 rooms
- 163 rooms
- 744 rooms
- 1515 rooms
- 1446 rooms
- 1587 rooms
- 918 rooms
- 1149+ rooms

- Rooms in renter-occupied apartments in Centerville, Indiana
- 361 room
- 212 rooms
- 53 rooms
- 794 rooms
- 955 rooms
- 506 rooms
- 317 rooms
- 348 rooms
- 09+ rooms


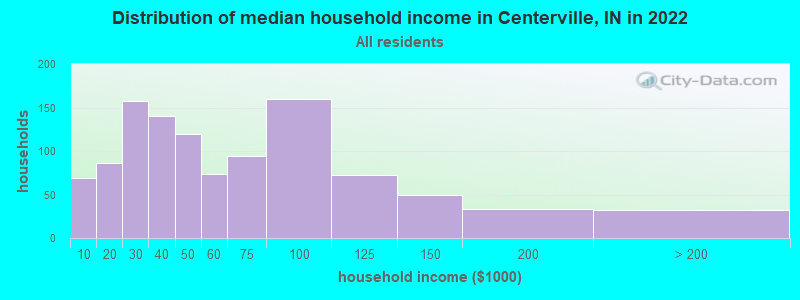
Centerville, IN household income distribution

- 69Less than $10,000
- 86$10,000 to $19,999
- 158$20,000 to $29,999
- 140$30,000 to $39,999
- 120$40,000 to $49,999
- 74$50,000 to $59,999
- 94$60,000 to $74,999
- 160$75,000 to $99,999
- 72$100,000 to $124,999
- 49$125,000 to $149,999
- 33$150,000 to $199,999
- 32$200,000 or more
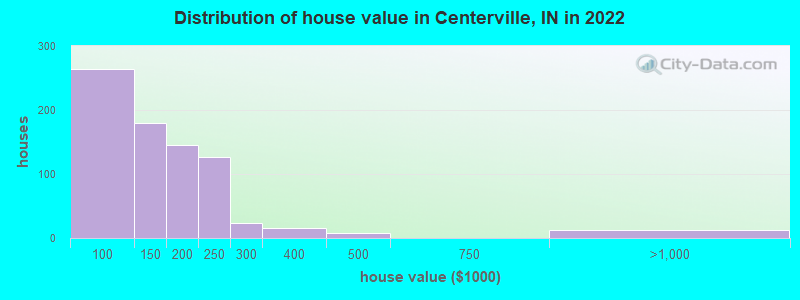
Home value of owner - occupied houses in 2022 in Centerville, IN
-
- 8$50,000 to $59,999
- 37$60,000 to $69,999
- 49$70,000 to $79,999
- 69$80,000 to $89,999
- 98$90,000 to $99,999
- 72$100,000 to $124,999
- 106$125,000 to $149,999
- 84$150,000 to $174,999
- 60$175,000 to $199,999
- 127$200,000 to $249,999
- 23$250,000 to $299,999
- 16$300,000 to $399,999
- 7$400,000 to $499,999
- 12$750,000 to $999,999
Rent paid by renters in 2022 in Centerville, IN
-
- 5Less than $100
- 13$100 to $149
- 6$300 to $349
- 2$350 to $399
- 41$400 to $449
- 9$450 to $499
- 35$500 to $549
- 21$550 to $599
- 54$600 to $649
- 41$650 to $699
- 25$700 to $749
- 6$750 to $799
- 17$800 to $899
- 28$900 to $999
- 33No cash rent


Percentage of workers working in this county: 96.1%
Number of people working at home: 108 (9.2% of all workers)
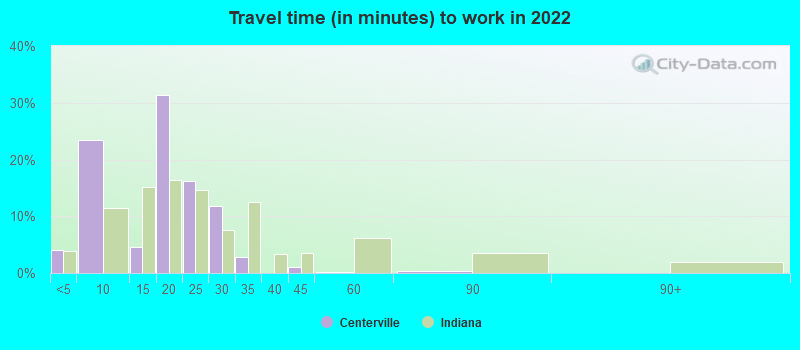
Travel time to work (commute)
- Less than 5 minutes: 22
- 5 to 9 minutes: 100
- 10 to 14 minutes: 392
- 15 to 19 minutes: 207
- 20 to 24 minutes: 195
- 25 to 29 minutes: 37
- 30 to 34 minutes: 14
- 35 to 39 minutes: 0
- 40 to 44 minutes: 12
- 45 to 59 minutes: 12
- 60 to 89 minutes: 16
- 90 or more minutes: 9
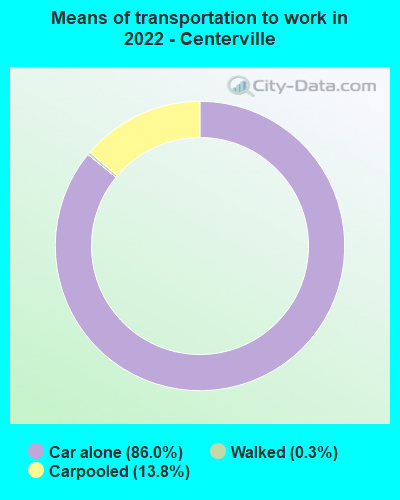
Means of transportation to work:
- Drove a car alone: 625 (74.3%)
- Carpooled: 110 (13.1%)
- Walked: 1 (0.1%)
- Worked at home: 108 (12.8%)

- Unemployment by race in 2022
- Unemployment rate for White non-Hispanic residents
- 3.9%Males
- 7.3%Females
- Unemployment rate for other race residents
- 16.3%Females
- Unemployment rate for Hispanic or Latino residents
- 11.0%Females

- Year of entry for the foreign-born population in Centerville, Indiana
- 02010 or later
- 72000 to 2009
- 01990 to 1999
- 01980 to 1989
- 31970 to 1979
- 0Before 1970

First ancestries reported:
- German: 241 (19.8%)
- English: 170 (14.0%)
- American: 138 (11.4%)
- Irish: 111 (9.1%)
- Scottish: 57 (4.7%)
- Portuguese: 44 (3.6%)
- European: 20 (1.6%)
- Italian: 15 (1.2%)
- Scotch-Irish: 13 (1.1%)
- French: 9 (0.7%)
- Polish: 6 (0.5%)
- Welsh: 6 (0.5%)
- British: 4 (0.3%)
- Pennsylvania German: 3 (0.2%)
- Dutch: 1 (0.08%)
Most common places of birth for foreign-born residents (%):
| Centerville: | 93.2% (55) |
| Indiana: | 27.0% (101,996) |
Place of birth for U.S.-born residents:
- This state: 2,070
- Other state: 622
- Northeast: 83
- Midwest: 338
- South: 149
- West: 16
71.5% of Centerville residents lived in the same house 1 years ago.
Out of people who lived in different houses, 46.1% lived in this county.
Out of people who lived in different counties, 22.6% lived in Indiana.
| Centerville: | 71.5% |
| State average: | 87.1% |
Education attainment for males 25 years and older:
- No schooling: 0
- Nursery to 4th grade: 0
- 5th and 6th grade: 24
- 7th and 8th grade: 26
- 9th grade: 14
- 10th grade: 40
- 11th grade: 5
- 12th grade, no diploma: 42
- High school graduate (or equivalency): 261
- Less than 1 year of college: 63
- Some college more than 1 year, no degree: 212
- Associate degree: 96
- Bachelor's degree: 57
- Master's degree: 17
- Professional school degree: 10
- Doctorate degree: 10

Education attainment for females 25 years and older:
- No schooling: 0
- Nursery to 4th grade: 0
- 5th and 6th grade: 0
- 7th and 8th grade: 6
- 9th grade: 42
- 10th grade: 29
- 11th grade: 6
- 12th grade, no diploma: 29
- High school graduate (or equivalency): 351
- Less than 1 year of college: 75
- Some college more than 1 year, no degree: 171
- Associate degree: 80
- Bachelor's degree: 89
- Master's degree: 10
- Professional school degree: 29
- Doctorate degree: 0


Housing units in structures:
- One, detached: 975
- One, attached: 5
- Two: 34
- 3 or 4: 29
- 5 to 9: 106
- 10 to 19: 46
- Mobile homes: 2
Housing units lacking complete kitchen facilities in 2022: 5.6%
House/condo owner moved in on average 10 years ago
Renter moved in on average 5 years ago

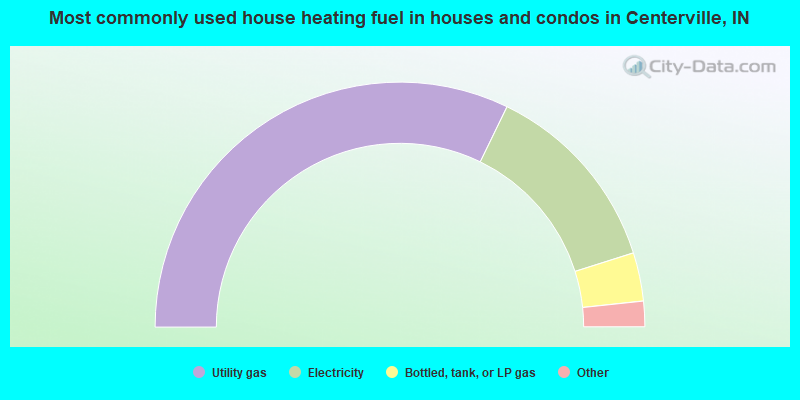
- 64.6%Utility gas
- 25.9%Electricity
- 6.4%Bottled, tank, or LP gas
- 1.8%Fuel oil, kerosene, etc.
- 0.7%Wood
- 0.7%No fuel used
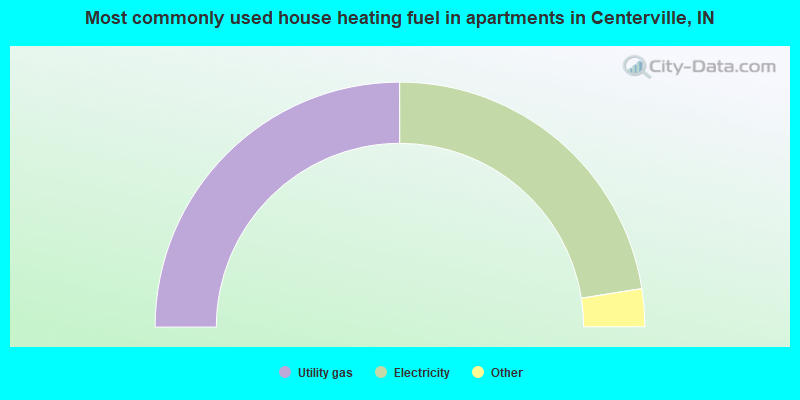
- 50.0%Utility gas
- 45.1%Electricity
- 3.4%Wood
- 1.4%Other fuel
Private vs. public school enrollment:
| Here: | 5.9% |
| Indiana: | 14.9% |
| Here: | 0.0% |
| Indiana: | 11.4% |
| Here: | 4.4% |
| Indiana: | 22.3% |


