Champaign, IL (Illinois) Houses and Residents
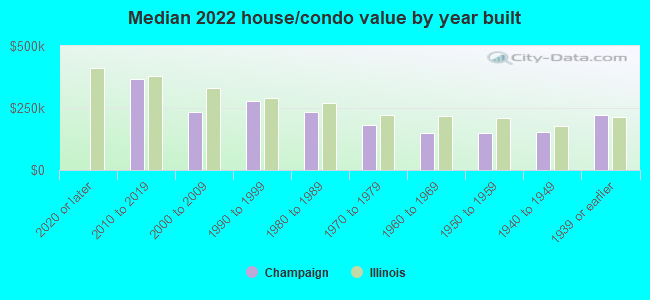
Estimated median house or condo value in 2022: $211,700 (it was $89,500 in 2000 )
Champaign:
$211,700Illinois:
$251,600
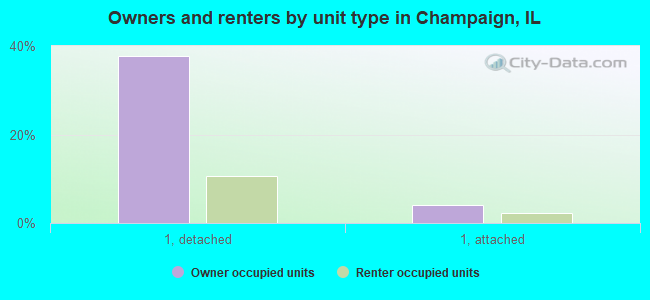
Lower value quartile - upper value quartile: $140,400 - $326,800Mean price in 2022: Detached houses: $230,945 Here:
$230,945State:
$310,164
Townhouses or other attached units: $243,199 Here:
$243,199State:
$286,230
In 2-unit structures: $65,661 Here:
$65,661State:
$299,638
In 3-to-4-unit structures: $137,180 Here:
$137,180State:
$330,907
In 5-or-more-unit structures: $161,289 Here:
$161,289State:
$318,887
Mobile homes: $28,115 Here:
$28,115State:
$78,855
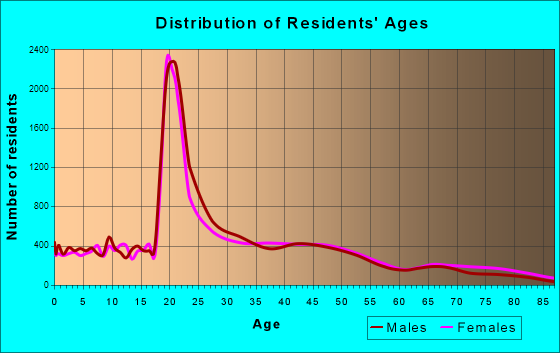
Total population: 84,513 (Urban population: 67,831, Rural population: 42 (19 farm, 23 nonfarm ))
Houses: 42,580 (36,997 occupied: 15,777 owner occupied, 21,220 renter occupied )
% of renters here:
57%State:
33%
Housing density: 2,507 houses/condos per square mile
Median price asked for vacant for-sale houses and condos in 2022: $170,521.
Median contract rent in 2022: $889 (lower quartile is $691, upper quartile is $1,157)
Median rent asked for vacant for-rent units in 2022: $1,194
Median gross rent in Champaign, IL in 2022: $1,043
Housing units in Champaign with a mortgage: 10,018 (612 second mortgage, 0 home equity loan, 569 both second mortgage and home equity loan )Houses without a mortgage: 377
Median household income for houses/condos with a mortgage: $112,742
Median household income for apartments without a mortgage: $81,243
Median monthly housing costs: $1,116
Data:
Median house or condo value ($)
Median house or condo value ($ change since 2000)
Median house or condo value ($) - White
Median house or condo value ($) - Black or African American
Median house or condo value ($) - Asian
Median house or condo value ($) - Hispanic or Latino
Median house or condo value ($) - American Indian and Alaska Native
Median house or condo value ($) - Multirace
Median house or condo value ($) - Other Race
Median price asked for mobile homes ($)
Household density (households per square mile)
Mean house or condo value by units in structure - 1, detached ($)
Mean house or condo value by units in structure - 1, attached ($)
Mean house or condo value by units in structure - 2 ($)
Mean house or condo value by units in structure by units in structure - 3 or 4 ($)
Mean house or condo value by units in structure - 5 or more ($)
Mean house or condo value by units in structure - Boat, RV, van, etc. ($)
Mean house or condo value by units in structure - Mobile home ($)
Median contract rent ($)
Median contract rent - Lower quartile ($)
Median contract rent - Upper quartile ($)
Median gross rent ($)
Urban houses (%)
Rural houses (%)
Houses occupied (%)
Houses occupied (% change since 2000)
Houses owner occupied (%)
Houses owner occupied (% change since 2000)
Houses renter occupied (%)
Houses renter occupied (% change since 2000)
Vacant housing units - For rent (%)
Vacant housing units - For rent (% change since 2000)
Vacant housing units - For sale only (%)
Vacant housing units - For sale only (% change since 2000)
Vacant housing units - Rented or sold, not occupied (%)
Vacant housing units - Rented or sold, not occupied (% change since 2000)
Vacant housing units - For seasonal, recreational, or occasional use (%)
Vacant housing units - For seasonal, recreational, or occasional use (% change since 2000)
Vacant housing units - For migrant workers (%)
Vacant housing units - For migrant workers (% change since 2000)
Vacant housing units - Other vacant (%)
Vacant housing units - Other vacant (% change since 2000)
Median monthly housing costs ($)
Median household income for houses/condos with a mortgage ($)
Median household income for houses/condos without a mortgage ($)
Median household income ($)
Median household income ($) - White
Median household income ($) - Black or African American
Median household income ($) - Asian
Median household income ($) - Hispanic or Latino
Median household income ($) - American Indian and Alaska Native
Median household income ($) - Multirace
Median household income ($) - Other Race
Mortgage status - with mortgage (%)
Mortgage status - with second mortgage (%)
Mortgage status - with home equity loan (%)
Mortgage status - with both second mortgage and home equity loan (%)
Mortgage status - without a mortgage (%)
Median year house/condo built
Median year apartment built
Household type by relationship - Male householder living alone (%)
Household type by relationship - Male householder not living alone (%)
Household type by relationship - Female householder living alone (%)
Household type by relationship - Female householder not living alone (%)
Household type by relationship - Opposite-Sex spouse (%)
Household type by relationship - Same-Sex spouse (%)
Household type by relationship - Opposite-Sex unmarried partner (%)
Household type by relationship - Same-Sex unmarried partner (%)
Household type by relationship - In group quarters (%)
Size of family households - 2-person household (%)
Size of family households - 3-person household (%)
Size of family households - 4-person household (%)
Size of family households - 5-person household (%)
Size of family households - 6-person household (%)
Size of family households - 7-or-more-person household (%)
Size of nonfamily households - 1-person household (%)
Size of nonfamily households - 2-person household (%)
Size of nonfamily households - 3-person household (%)
Size of nonfamily households - 4-person household (%)
Size of nonfamily households - 5-person household (%)
Size of nonfamily households - 6-person household (%)
Size of nonfamily households - 7-or-moreperson household (%)
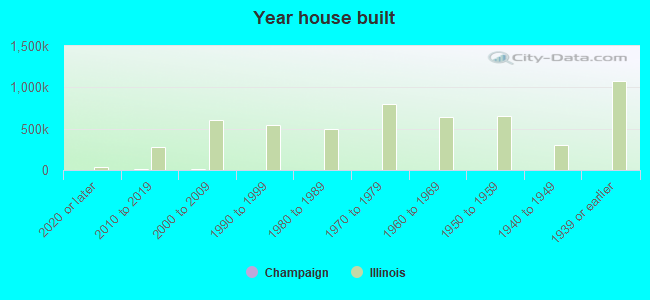
Year house built - Built 2010 or later (%)
Year house built - Built 2000 to 2009 (%)
Year house built - Built 1990 to 1999 (%)
Year house built - Built 1980 to 1989 (%)
Year house built - Built 1970 to 1979 (%)
Year house built - Built 1960 to 1969 (%)
Year house built - Built 1950 to 1959 (%)
Year house built - Built 1940 to 1949 (%)
Year house built - Built 1939 or earlier (%)
Median number of rooms in houses and condos
Median number of rooms in apartments
Median number of bedrooms in owner occupied houses
Mean number of bedrooms in owner occupied houses
Median number of bedrooms in renter occupied houses
Mean number of bedrooms in renter occupied houses
Median number of vehichles in owner occupied houses
Mean number of vehichles in owner occupied houses
Median number of vehichles in renter occupied houses
Mean number of vehichles in renter occupied houses
Rooms in owner-occupied houses - 1 room (%)
Rooms in owner-occupied houses - 2 rooms (%)
Rooms in owner-occupied houses - 3 rooms (%)
Rooms in owner-occupied houses - 4 rooms (%)
Rooms in owner-occupied houses - 5 rooms (%)
Rooms in owner-occupied houses - 6 rooms (%)
Rooms in owner-occupied houses - 7 rooms (%)
Rooms in owner-occupied houses - 8 rooms (%)
Rooms in owner-occupied houses - 9+ rooms (%)
Rooms in renter-occupied houses - 1 room (%)
Rooms in renter-occupied houses - 2 rooms (%)
Rooms in renter-occupied houses - 3 rooms (%)
Rooms in renter-occupied houses - 4 rooms (%)
Rooms in renter-occupied houses - 5 rooms (%)
Rooms in renter-occupied houses - 6 rooms (%)
Rooms in renter-occupied houses - 7 rooms (%)
Rooms in renter-occupied houses - 8 rooms (%)
Rooms in renter-occupied houses - 9+ rooms (%)
Bedrooms in owner-occupied houses - no bedrooms (%)
Bedrooms in owner-occupied houses - 1 bedroom (%)
Bedrooms in owner-occupied houses - 2 bedrooms (%)
Bedrooms in owner-occupied houses - 3 bedrooms (%)
Bedrooms in owner-occupied houses - 4 bedrooms (%)
Bedrooms in owner-occupied houses - 5+ bedrooms (%)
Bedrooms in renter-occupied houses - no bedrooms (%)
Bedrooms in renter-occupied houses - 1 bedroom (%)
Bedrooms in renter-occupied houses - 2 bedrooms (%)
Bedrooms in renter-occupied houses - 3 bedrooms (%)
Bedrooms in renter-occupied houses - 4 bedrooms (%)
Bedrooms in renter-occupied houses - 5+ bedrooms (%)
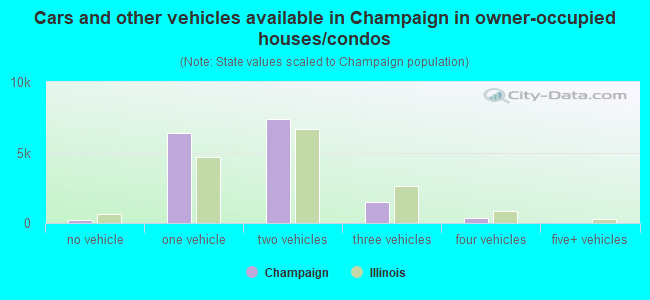
Vehicles available in owner-occupied houses - no vehicle available (%)
Vehicles available in owner-occupied houses - 1 vehicle available(%)
Vehicles available in owner-occupied houses - 2 Vehicles available (%)
Vehicles available in owner-occupied houses - 3 Vehicles available (%)
Vehicles available in owner-occupied houses - 4 Vehicles available (%)
Vehicles available in owner-occupied houses - 5+ Vehicles available (%)
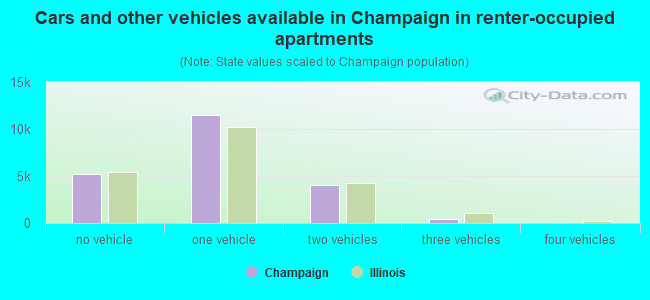
Vehicles available in renter-occupied houses - no vehicle available (%)
Vehicles available in renter-occupied houses - 1 vehicle available (%)
Vehicles available in renter-occupied houses - 2 Vehicles available (%)
Vehicles available in renter-occupied houses - 3 Vehicles available (%)
Vehicles available in renter-occupied houses - 4 Vehicles available (%)
Vehicles available in renter-occupied houses - 5+ Vehicles available (%)
Housing units in structures - 1, detached (%)
Housing units in structures - 1, attached (%)
Housing units in structures - 2 (%)
Housing units in structures - 3 or 4 (%)
Housing units in structures - 5 to 9 (%)
Housing units in structures - 10 to 19 (%)
Housing units in structures - 20 to 49 (%)
Housing units in structures - 50 or more (%)
Housing units in structures - Mobile home (%)
Housing units in structures - Boat, RV, van, etc. (%)
Housing units in structures - Owners - 1, detached (%)
Housing units in structures - Owners - 1, attached (%)
Housing units in structures - Owners - 2 (%)
Housing units in structures - Owners - 3 or 4 (%)
Housing units in structures - Owners - 5 to 9 (%)
Housing units in structures - Owners - 10 to 19 (%)
Housing units in structures - Owners - 20 to 49 (%)
Housing units in structures - Owners - 50 or more (%)
Housing units in structures - Owners - Mobile home (%)
Housing units in structures - Owners - Boat, RV, van, etc. (%)
Housing units in structures - Renters - 1, detached (%)
Housing units in structures - Renters - 1, attached (%)
Housing units in structures - Renters - 2 (%)
Housing units in structures - Renters - 3 or 4 (%)
Housing units in structures - Renters - 5 to 9 (%)
Housing units in structures - Renters - 10 to 19 (%)
Housing units in structures - Renters - 20 to 49 (%)
Housing units in structures - Renters - 50 or more (%)
Housing units in structures - Renters - Mobile home (%)
Housing units in structures - Renters - Boat, RV, van, etc. (%)
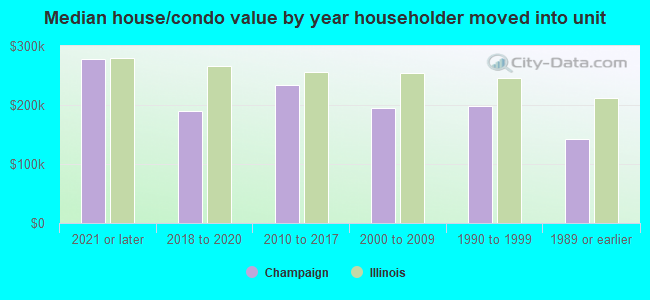
House/condo owner moved in on average (years ago)
Renter moved in on average (years ago)
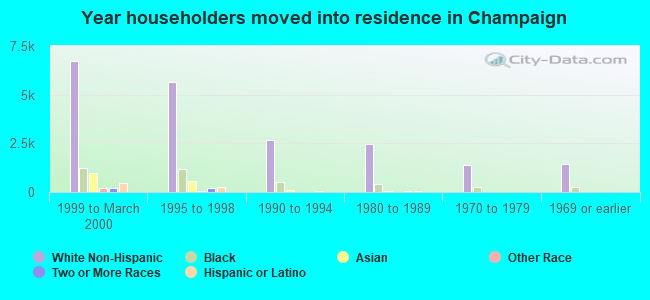
Year householder moved into unit - Moved in 1999 to March 2000 (%)
Year householder moved into unit - Moved in 1999 to March 2000 (%) - White
Year householder moved into unit - Moved in 1999 to March 2000 (%) - Black or African American
Year householder moved into unit - Moved in 1999 to March 2000 (%) - Asian
Year householder moved into unit - Moved in 1999 to March 2000 (%) - Hispanic or Latino
Year householder moved into unit - Moved in 1999 to March 2000 (%) - American Indian and Alaska Native
Year householder moved into unit - Moved in 1999 to March 2000 (%) - Multirace
Year householder moved into unit - Moved in 1999 to March 2000 (%) - Other Race
Year householder moved into unit - Moved in 1995 to 1998 (%)
Year householder moved into unit - Moved in 1995 to 1998 (%) - White
Year householder moved into unit - Moved in 1995 to 1998 (%) - Black or African American
Year householder moved into unit - Moved in 1995 to 1998 (%) - Asian
Year householder moved into unit - Moved in 1995 to 1998 (%) - Hispanic or Latino
Year householder moved into unit - Moved in 1995 to 1998 (%) - American Indian and Alaska Native
Year householder moved into unit - Moved in 1995 to 1998 (%) - Multirace
Year householder moved into unit - Moved in 1995 to 1998 (%) - Other Race
Year householder moved into unit - Moved in 1990 to 1994 (%)
Year householder moved into unit - Moved in 1990 to 1994 (%) - White
Year householder moved into unit - Moved in 1990 to 1994 (%) - Black or African American
Year householder moved into unit - Moved in 1990 to 1994 (%) - Asian
Year householder moved into unit - Moved in 1990 to 1994 (%) - Hispanic or Latino
Year householder moved into unit - Moved in 1990 to 1994 (%) - American Indian and Alaska Native
Year householder moved into unit - Moved in 1990 to 1994 (%) - Multirace
Year householder moved into unit - Moved in 1990 to 1994 (%) - Other Race
Year householder moved into unit - Moved in 1980 to 1989 (%)
Year householder moved into unit - Moved in 1980 to 1989 (%) - White
Year householder moved into unit - Moved in 1980 to 1989 (%) - Black or African American
Year householder moved into unit - Moved in 1980 to 1989 (%) - Asian
Year householder moved into unit - Moved in 1980 to 1989 (%) - Hispanic or Latino
Year householder moved into unit - Moved in 1980 to 1989 (%) - American Indian and Alaska Native
Year householder moved into unit - Moved in 1980 to 1989 (%) - Multirace
Year householder moved into unit - Moved in 1980 to 1989 (%) - Other Race
Year householder moved into unit - Moved in 1970 to 1979 (%)
Year householder moved into unit - Moved in 1970 to 1979 (%) - White
Year householder moved into unit - Moved in 1970 to 1979 (%) - Black or African American
Year householder moved into unit - Moved in 1970 to 1979 (%) - Asian
Year householder moved into unit - Moved in 1970 to 1979 (%) - Hispanic or Latino
Year householder moved into unit - Moved in 1970 to 1979 (%) - American Indian and Alaska Native
Year householder moved into unit - Moved in 1970 to 1979 (%) - Multirace
Year householder moved into unit - Moved in 1970 to 1979 (%) - Other Race
Year householder moved into unit - Moved in 1969 or earlier (%)
Year householder moved into unit - Moved in 1969 or earlier (%) - White
Year householder moved into unit - Moved in 1969 or earlier (%) - Black or African American
Year householder moved into unit - Moved in 1969 or earlier (%) - Asian
Year householder moved into unit - Moved in 1969 or earlier (%) - Hispanic or Latino
Year householder moved into unit - Moved in 1969 or earlier (%) - American Indian and Alaska Native
Year householder moved into unit - Moved in 1969 or earlier (%) - Multirace
Year householder moved into unit - Moved in 1969 or earlier (%) - Other Race
Housing units lacking complete plumbing facilities (%)
Housing units lacking complete kitchen facilities (%)
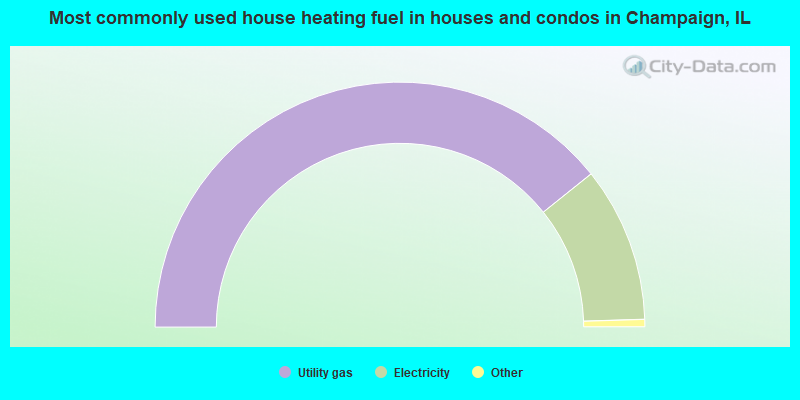
House heating fuel used in houses and condos - Utility gas (%)
House heating fuel used in houses and condos - Bottled, tank, or LP gas (%)
House heating fuel used in houses and condos - Electricity (%)
House heating fuel used in houses and condos - Fuel oil, kerosene, etc. (%)
House heating fuel used in houses and condos - Coal or coke (%)
House heating fuel used in houses and condos - Wood (%)
House heating fuel used in houses and condos - Solar energy (%)
House heating fuel used in houses and condos - Other fuel (%)
House heating fuel used in houses and condos - No fuel used (%)
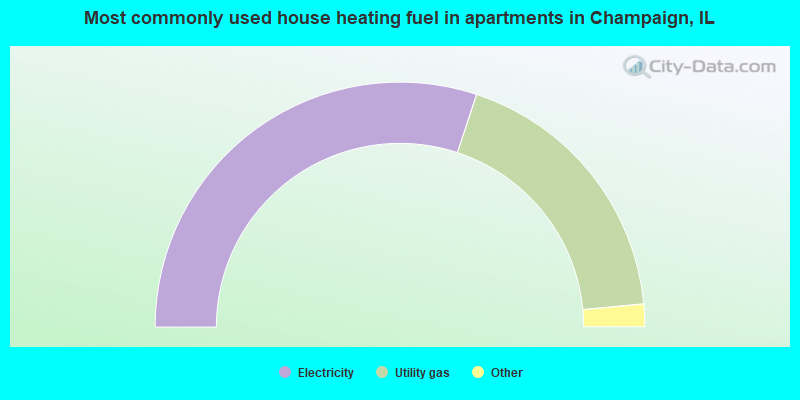
House heating fuel used in apartments - Utility gas (%)
House heating fuel used in apartments - Bottled, tank, or LP gas (%)
House heating fuel used in apartments - Electricity (%)
House heating fuel used in apartments - Fuel oil, kerosene, etc. (%)
House heating fuel used in apartments - Coal or coke (%)
House heating fuel used in apartments - Wood (%)
House heating fuel used in apartments - Solar energy (%)
House heating fuel used in apartments - Other fuel (%)
House heating fuel used in apartments - No fuel used (%)
Latest news about housing in Champaign, IL collected exclusively by city-data.com from local newspapers, TV, and radio stations
Median year house/condo built: 1981Median year apartment built: 1984Household type by relationship:
Households: 89,245
Male householders: 18,623 (7,994 living alone ), Female householders: 18,374 (7,040 living alone )13,114 spouses (12,897 opposite-sex spouses ), 3,389 unmarried partners , (3,070 opposite-sex unmarried partners ), 16,611 children (15,740 natural , 667 adopted , 204 stepchildren ), 1,335 grandchildren , 300 brothers or sisters , 512 parents , 0 foster children , 74 other relatives , 8,763 non-relatives In group quarters: 8,150
Size of family households: 8,771 2-persons , 2,998 3-persons , 2,839 4-persons , 622 5-persons , 387 6-persons , 295 7-or-more-persons .
Size of nonfamily households: 15,034 1-person , 4,611 2-persons , 816 3-persons , 588 4-persons , 36 5-persons .
10,336 married couples with children. single-parent households (1,122 men , 2,516 women ).
75.8% of residents of Champaign speak English at home. of residents speak Spanish at home (75% speak English very well , 19% speak English well , 3% speak English not well , 3% don't speak English at all ).of residents speak other Indo-European language at home (68% speak English very well , 22% speak English well , 9% speak English not well , 1% don't speak English at all ).of residents speak Asian or Pacific Island language at home (60% speak English very well , 34% speak English well , 4% speak English not well , 2% don't speak English at all ).of residents speak other language at home (86% speak English very well , 7% speak English well , 5% speak English not well , 2% don't speak English at all ).
Foreign born population: 12,436 (13.9%)of them are naturalized citizens )
Median number of rooms in houses and condos:
Median number of rooms in apartments
Owner-occupied Renter-occupied
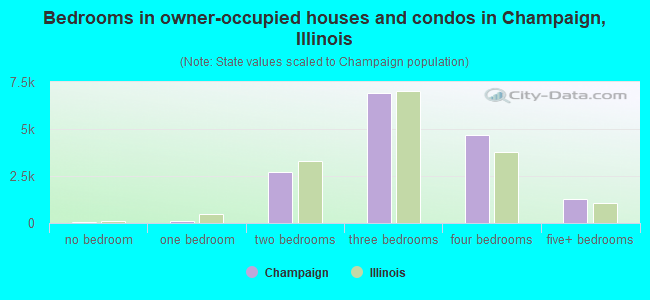
Bedrooms in owner-occupied houses and condos in Champaign, Illinois
53 no bedroom 111 1 bedroom 2,732 2 bedrooms 6,918 3 bedrooms 4,685 4 bedrooms 1,278 5+ bedrooms
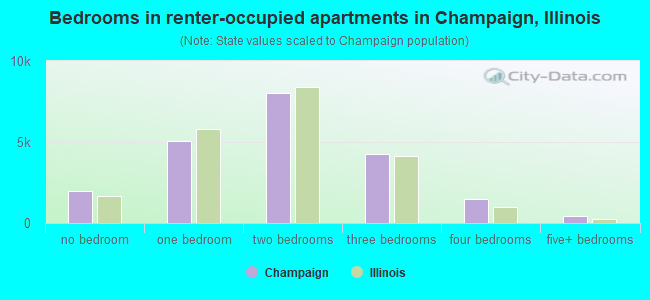
Bedrooms in renter-occupied apartments in Champaign, Illinois
1,951 no bedroom 5,038 1 bedroom 8,010 2 bedrooms 4,263 3 bedrooms 1,496 4 bedrooms 462 5+ bedrooms
Owner-occupied Renter-occupied
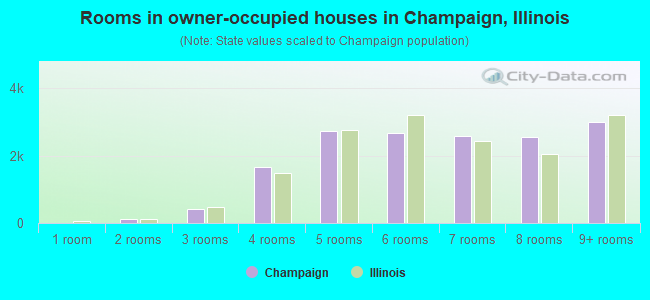
Rooms in owner-occupied houses in Champaign, Illinois
0 1 room 112 2 rooms 416 3 rooms 1,677 4 rooms 2,746 5 rooms 2,677 6 rooms 2,587 7 rooms 2,560 8 rooms 3,002 9+ rooms
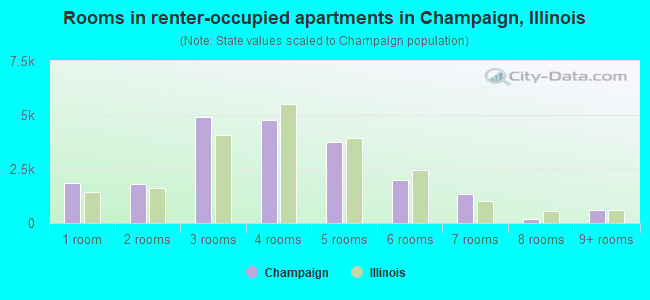
Rooms in renter-occupied apartments in Champaign, Illinois
1,844 1 room 1,826 2 rooms 4,888 3 rooms 4,771 4 rooms 3,739 5 rooms 2,006 6 rooms 1,348 7 rooms 181 8 rooms 617 9+ rooms
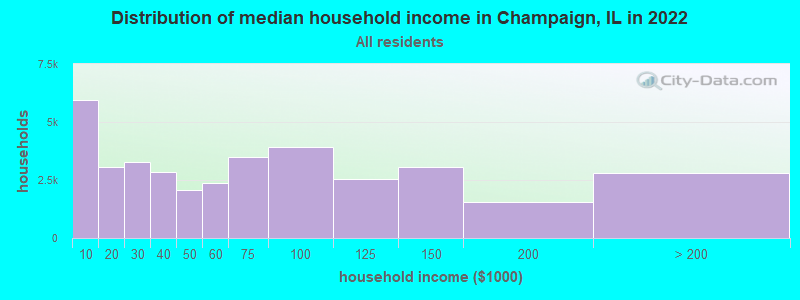
Champaign, IL household income distribution 5,958 Less than $10,0003,059 $10,000 to $19,9993,272 $20,000 to $29,9992,853 $30,000 to $39,9992,080 $40,000 to $49,9992,376 $50,000 to $59,9993,506 $60,000 to $74,9993,919 $75,000 to $99,9992,553 $100,000 to $124,9993,081 $125,000 to $149,9991,543 $150,000 to $199,9992,797 $200,000 or more
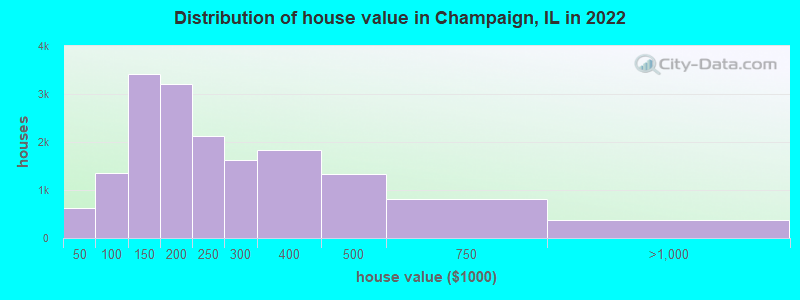
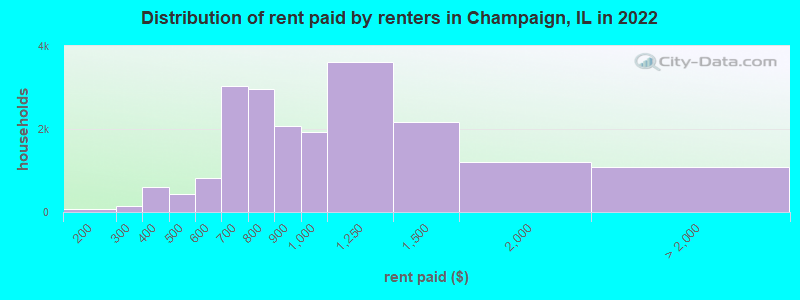
Home value of owner - occupied houses in 2022 in Champaign, IL 87 Less than $10,00086 $10,000 to $14,99995 $15,000 to $19,99935 $20,000 to $24,99914 $25,000 to $29,99920 $30,000 to $34,99940 $35,000 to $39,999249 $40,000 to $49,999196 $50,000 to $59,999120 $60,000 to $69,999241 $70,000 to $79,999238 $80,000 to $89,999307 $90,000 to $99,9991,837 $100,000 to $124,9991,587 $125,000 to $149,9991,705 $150,000 to $174,9991,512 $175,000 to $199,9992,134 $200,000 to $249,9991,616 $250,000 to $299,9991,823 $300,000 to $399,9991,331 $400,000 to $499,999811 $500,000 to $749,999314 $750,000 to $999,99952 $1,000,000 to $1,499,999Rent paid by renters in 2022 in Champaign, IL 26 $100 to $14952 $150 to $19945 $200 to $24997 $250 to $299218 $300 to $349378 $350 to $399353 $400 to $44989 $450 to $499246 $500 to $549573 $550 to $5991,477 $600 to $6491,555 $650 to $6991,744 $700 to $7491,226 $750 to $7992,077 $800 to $8991,934 $900 to $9993,606 $1,000 to $1,2492,156 $1,250 to $1,4991,208 $1,500 to $1,999402 $2,000 to $2,499261 $2,500 to $2,99939 $3,000 to $3,49986 $3,500 or more305 No cash rent
Percentage of workers working in this county: 93.7%Number of people working at home: 8,556 (20.1% of all workers )
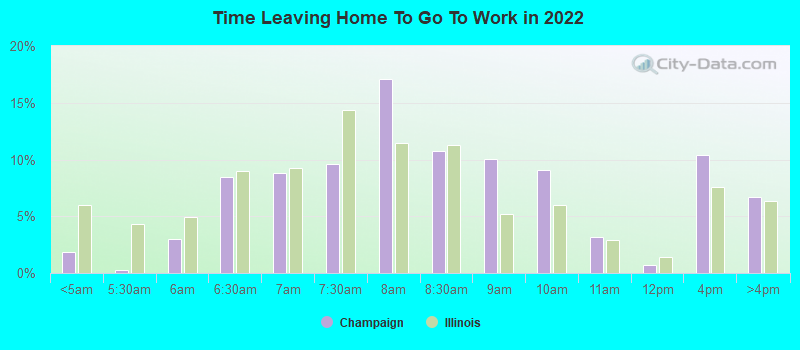
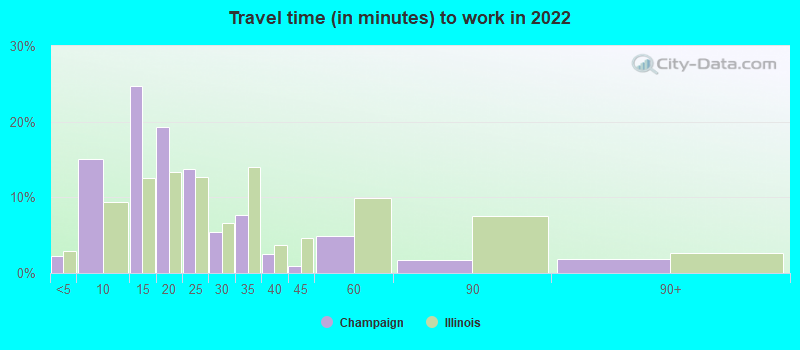
Travel time to work (commute)
Less than 5 minutes: 1,0565 to 9 minutes: 6,66010 to 14 minutes: 12,92915 to 19 minutes: 8,84620 to 24 minutes: 2,72725 to 29 minutes: 67430 to 34 minutes: 56535 to 39 minutes: 8840 to 44 minutes: 13945 to 59 minutes: 67260 to 89 minutes: 17890 or more minutes: 80
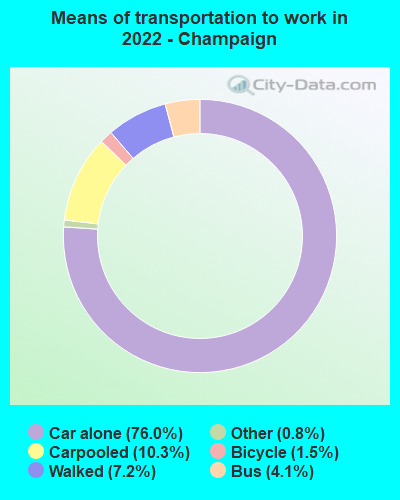
Means of transportation to work:
Drove a car alone: 33,130 (63.4%)Carpooled: 4,359 (8.3%)Bus : 2,402 (4.6%)Long-distance train or commuter rail : 25 (0.0%)Taxi: 259 (0.5%)Bicycle: 529 (1.0%)Walked: 2,915 (5.6%)Worked at home: 8,556 (16.4%)
Unemployment by race in 2022
Unemployment rate for White non-Hispanic residents 8.3% Males1.6% FemalesUnemployment rate for Black residents 9.9% Males9.7% FemalesUnemployment rate for American Indian and Alaska Native residents 39.1% Males59.7% FemalesUnemployment rate for Asian residents 3.1% Males0.6% FemalesUnemployment rate for two or more race residents 7.3% Males2.4% FemalesUnemployment rate for Hispanic or Latino residents 2.6% Males2.5% Females
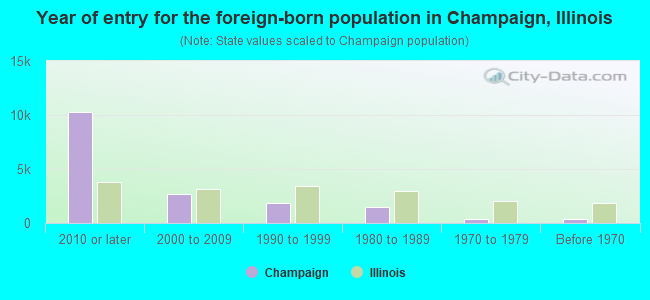
Year of entry for the foreign-born population in Champaign, Illinois
10,252 2010 or later 2,691 2000 to 2009 1,894 1990 to 1999 1,456 1980 to 1989 412 1970 to 1979 400 Before 1970
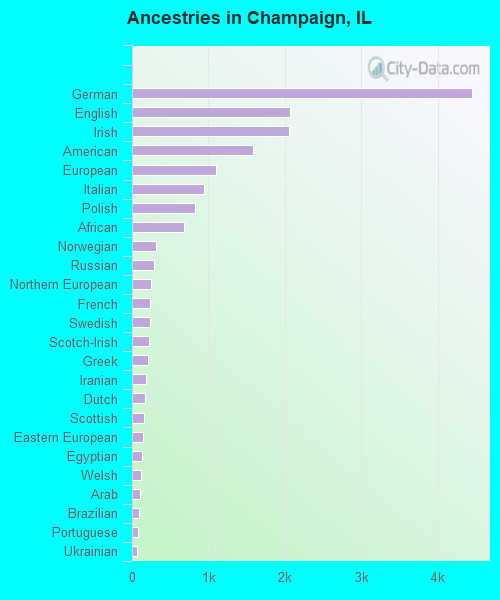
First ancestries reported:
German: 4,448 (10.3%)
English: 2,064 (4.8%)
Irish: 2,059 (4.8%)
American: 1,588 (3.7%)
European: 1,096 (2.5%)
Italian: 937 (2.2%)
Polish: 824 (1.9%)
African: 679 (1.6%)
Norwegian: 311 (0.7%)
Russian: 285 (0.7%)
Northern European: 250 (0.6%)
French: 236 (0.5%)
Swedish: 231 (0.5%)
Scotch-Irish: 223 (0.5%)
Greek: 207 (0.5%)
Iranian: 179 (0.4%)
Dutch: 172 (0.4%)
Scottish: 154 (0.4%)
Eastern European: 150 (0.3%)
Egyptian: 128 (0.3%)
Welsh: 112 (0.3%)
Arab: 100 (0.2%)
Brazilian: 87 (0.2%)
Portuguese: 77 (0.2%)
Ukrainian: 67 (0.2%)
Czech: 63 (0.1%)
Moroccan: 60 (0.1%)
Swiss: 60 (0.1%)
Hungarian: 53 (0.1%)
British: 49 (0.1%)
Scandinavian: 47 (0.1%)
Czechoslovakian: 44 (0.1%)
Turkish: 42 (0.10%)
Austrian: 36 (0.08%)
Nigerian: 34 (0.08%)
Israeli: 31 (0.07%)
Lebanese: 30 (0.07%)
Jamaican: 30 (0.07%)
Croatian: 27 (0.06%)
Slovak: 27 (0.06%)
Latvian: 26 (0.06%)
Belizean: 22 (0.05%)
Kenyan: 20 (0.05%)
Yugoslavian: 18 (0.04%)
Danish: 17 (0.04%)
Finnish: 15 (0.03%)
West Indian: 15 (0.03%)
South African: 14 (0.03%)
Lithuanian: 12 (0.03%)
Serbian: 12 (0.03%)
Romanian: 10 (0.02%)
French Canadian: 10 (0.02%)
Cypriot: 9 (0.02%)
Ethiopian: 9 (0.02%)
Australian: 8 (0.02%)
Ghanaian: 5 (0.01%)
Bulgarian: 3 (0.01%)
Albanian: 3 (0.01%)
Most common places of birth for foreign-born residents (%): China, excluding Hong Kong and Taiwan Champaign:
26.1% (3,945)Illinois:
4.1% (74,364)
India Champaign:
15.3% (2,314)Illinois:
9.2% (166,409)
Korea Champaign:
6.9% (1,039)Illinois:
2.2% (40,393)
Mexico Champaign:
5.3% (798)Illinois:
34.7% (626,958)
Philippines Champaign:
4.1% (621)Illinois:
5.2% (93,003)
Democratic Republic of Congo (Zaire) Champaign:
3.4% (508)Illinois:
0.2% (4,414)
Vietnam Champaign:
2.2% (334)Illinois:
1.2% (22,269)
Brazil Champaign:
2.1% (312)Illinois:
0.5% (8,778)
Cameroon Champaign:
1.5% (231)Illinois:
0.1% (1,856)
Place of birth for U.S.-born residents:
This state: 53,522Other state: 20,258Northeast: 2,343Midwest: 8,268South: 6,906West: 2,741 70.3% of Champaign residents lived in the same house 1 years ago.
Out of people who lived in different houses, 34.5% lived in this county.
Out of people who lived in different counties, 64.8% lived in Illinois.
Champaign:
70.3%State average:
88.3%
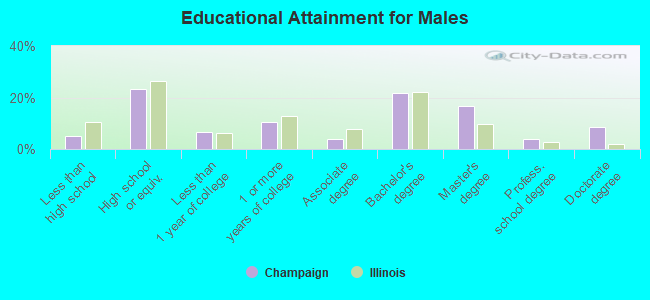
Education attainment for males 25 years and older:
No schooling: 585Nursery to 4th grade: 05th and 6th grade: 477th and 8th grade: 09th grade: 5910th grade: 011th grade: 42712th grade, no diploma: 125High school graduate (or equivalency): 5,569Less than 1 year of college: 1,568Some college more than 1 year, no degree: 2,502Associate degree: 940Bachelor's degree: 5,170Master's degree: 4,010Professional school degree: 899Doctorate degree: 2,012
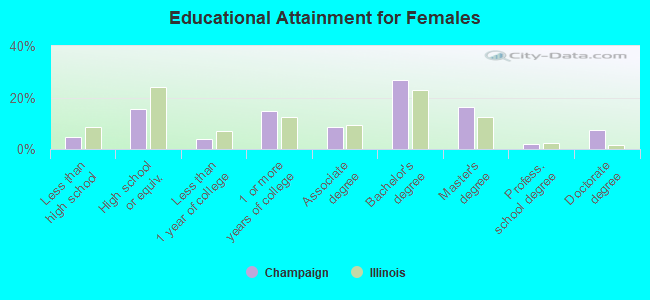
Education attainment for females 25 years and older:
No schooling: 168Nursery to 4th grade: 05th and 6th grade: 07th and 8th grade: 09th grade: 5210th grade: 17511th grade: 40112th grade, no diploma: 350High school graduate (or equivalency): 3,857Less than 1 year of college: 925Some college more than 1 year, no degree: 3,655Associate degree: 2,101Bachelor's degree: 6,648Master's degree: 4,060Professional school degree: 518Doctorate degree: 1,791
Housing units in structures:
One, detached: 17,613One, attached: 2,626Two: 6403 or 4: 2,4955 to 9: 3,60210 to 19: 4,45120 to 49: 4,97050 or more: 5,590Mobile homes: 593Median worth of mobile homes: $9,999
Housing units lacking complete plumbing facilities in 2022: 1.3%Housing units lacking complete kitchen facilities in 2022: 1.8%House/condo owner moved in on average 11 years ago
Renter moved in on average 0 years ago
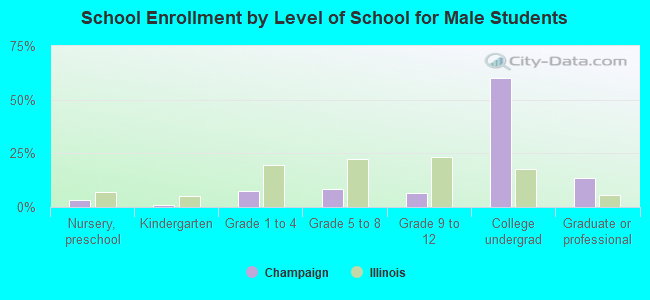
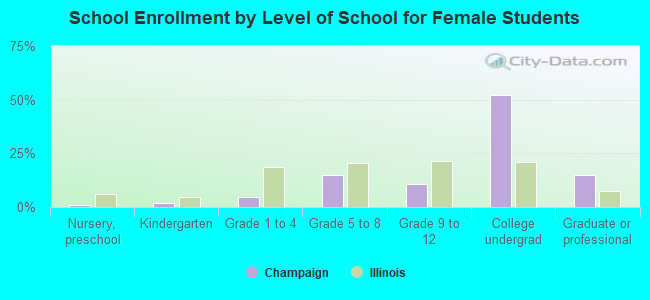
Private vs. public school enrollment:
Students in private schools in grades 1 to 8 (elementary and middle school): 1,230 Students in private schools in grades 9 to 12 (high school): 696 Students in private undergraduate colleges: 63