Chandler, IN (Indiana) Houses and Residents
| Chandler: | $148,312 |
| Indiana: | $208,700 |
Mean price in 2022:
Detached houses: $384,458
Here: $384,458 State: $257,916 Mobile homes: $51,677
Here: $51,677 State: $67,116
Total population: 3,377 (Urban population: 2,913, Rural population: 38 (all nonfarm))
Houses: 1,671 (1,506 occupied: 1,247 owner occupied, 245 renter occupied)
| % of renters here: | 16% |
| State: | 29% |
Housing density: 989 houses/condos per square mile
Median price asked for vacant for-sale houses and condos in 2022 in this county: $140,082.
Median contract rent in 2022: $544 (lower quartile is $428, upper quartile is $647)
Median rent asked for vacant for-rent units in 2022: $549
Median gross rent in Chandler, IN in 2022: $758
Housing units in Chandler with a mortgage: 758 (67 second mortgage, 0 home equity loan, 34 both second mortgage and home equity loan)
Houses without a mortgage: 22
Median household income for houses/condos with a mortgage: $77,005
Median household income for apartments without a mortgage: $36,420
Median monthly housing costs: $840
Compare current foreclosures near Chandler, IN:
| Photo | Address | Area | Beds / Baths | Price | Details |
|---|---|---|---|---|---|

|
#1
Mccool Rd
Chandler, IN 47610
|
1,410 sq. feet
|
1 baths 3 beds |
show details | |

|
#2
Russell Pl
Chandler, IN 47610
|
1,080 sq. feet
|
2 baths 3 beds |
show details | |

|
#3
S Iowa St
Chandler, IN 47610
|
1,980 sq. feet
|
1 baths 3 beds |
show details | |

|
#4
Green Valley Dr
Chandler, IN 47610
|
1,025 sq. feet
|
1 baths 3 beds |
show details | |

|
#5
Stonehedge Rd
Chandler, IN 47610
|
1,836 sq. feet
|
2 baths 3 beds |
show details | |

|
#6
N 3rd St
Chandler, IN 47610
|
1,075 sq. feet
|
1 baths 3 beds |
show details | |

|
#7
W Monroe Ave
Chandler, IN 47610
|
720 sq. feet
|
1 baths 2 beds |
show details | |

|
#8
Paula Dr Apt A
Chandler, IN 47610
|
- sq. feet
|
- baths - beds |
show details | |

|
#9
W Washington St Apt C
Chandler, IN 47610
|
- sq. feet
|
- baths - beds |
show details | |

|
#10
Heim Rd # A
Chandler, IN 47610
|
- sq. feet
|
- baths - beds |
show details |
| Photo | Address | Area | Beds / Baths | Price | Details |
|---|---|---|---|---|---|

|
#11
Birkshire Ave
Chandler, IN 47610
|
- sq. feet
|
- baths - beds |
show details | |

|
#12
Margybeth Ave
Evansville, IN 47714
|
906 sq. feet
|
1 baths 2 beds |
$114,900
|
show details |

|
#13
Koressel Ave
Evansville, IN 47712
|
1,725 sq. feet
|
2 baths 3 beds |
$54,900
|
show details |

|
#14
E Boonville New Harmony Rd
Evansville, IN 47725
|
3,392 sq. feet
|
3 baths 4 beds |
$374,900
|
show details |

|
#15
N Fares Ave
Evansville, IN 47711
|
1,110 sq. feet
|
1 baths 3 beds |
$152,500
|
show details |

|
#16
N 2nd Ave
Evansville, IN 47710
|
1,813 sq. feet
|
1 baths 2 beds |
$9,900
|
show details |

|
#17
Jefferson Ave
Evansville, IN 47713
|
2,878 sq. feet
|
2 baths 5 beds |
$52,500
|
show details |

|
#18
Sherwood Ave
Chandler, IN 47610
|
- sq. feet
|
- baths - beds |
show details | |

|
#19
E Olmstead Ave
Evansville, IN 47711
|
1,080 sq. feet
|
2 baths 2 beds |
show details | |

|
#20
Sweetser Ave
Evansville, IN 47714
|
1,170 sq. feet
|
2 baths 3 beds |
show details |
| Photo | Address | Area | Beds / Baths | Price | Details |
|---|---|---|---|---|---|

|
#21
Madison Ave
Evansville, IN 47714
|
1,222 sq. feet
|
1 baths 3 beds |
show details | |

|
#22
Harding Ave
Evansville, IN 47711
|
720 sq. feet
|
1 baths 2 beds |
show details | |

|
#23
Monroe Ave
Evansville, IN 47714
|
1,176 sq. feet
|
2 baths 3 beds |
show details | |

|
#24
Wansford Ave
Evansville, IN 47711
|
840 sq. feet
|
1 baths 2 beds |
show details | |

|
#25
Dianne Ave
Evansville, IN 47714
|
1,814 sq. feet
|
3 baths 4 beds |
show details | |

|
#26
Gabriel Dr
Evansville, IN 47725
|
2,198 sq. feet
|
2 baths 3 beds |
show details | |

|
#27
S Walnut Ln
Evansville, IN 47714
|
640 sq. feet
|
1 baths 2 beds |
show details | |

|
#28
Olive St
Evansville, IN 47714
|
1,755 sq. feet
|
2 baths 3 beds |
show details | |

|
#29
E Indiana St
Evansville, IN 47711
|
693 sq. feet
|
1 baths 2 beds |
show details | |

|
#30
E Chandler Ave
Evansville, IN 47714
|
1,204 sq. feet
|
1 baths 2 beds |
show details |
| Photo | Address | Area | Beds / Baths | Price | Details |
|---|---|---|---|---|---|

|
#31
N Meadow Rd
Evansville, IN 47715
|
1,131 sq. feet
|
1 baths 3 beds |
show details | |

|
#32
Mariner Dr
Evansville, IN 47711
|
1,147 sq. feet
|
2 baths 3 beds |
show details | |

|
#33
Haven Dr
Evansville, IN 47711
|
800 sq. feet
|
1 baths 2 beds |
show details | |

|
#34
E Parkland Ave
Evansville, IN 47711
|
1,104 sq. feet
|
1 baths 3 beds |
show details | |

|
#35
Rosewood Dr
Evansville, IN 47711
|
1,556 sq. feet
|
1 baths 3 beds |
show details | |

|
#36
E Iowa St
Evansville, IN 47711
|
1,014 sq. feet
|
1 baths 2 beds |
show details | |

|
#37
E Illinois St
Evansville, IN 47711
|
736 sq. feet
|
1 baths 1 beds |
show details | |

|
#38
Stanley Ave
Evansville, IN 47711
|
792 sq. feet
|
1 baths 1 beds |
show details | |

|
#39
E Sycamore St
Evansville, IN 47714
|
870 sq. feet
|
1 baths 2 beds |
show details | |

|
#40
Belmont Dr
Evansville, IN 47711
|
2,446 sq. feet
|
3 baths 4 beds |
show details |
| Photo | Address | Area | Beds / Baths | Price | Details |
|---|---|---|---|---|---|

|
#41
S Willow Rd
Evansville, IN 47714
|
2,078 sq. feet
|
1 baths 2 beds |
show details | |

|
#42
Hawthorne Ave
Evansville, IN 47714
|
1,014 sq. feet
|
1 baths 3 beds |
show details | |

|
#43
Lodge Ave
Evansville, IN 47714
|
2,076 sq. feet
|
2 baths 4 beds |
show details | |

|
#44
Pollack Ave
Evansville, IN 47714
|
1,296 sq. feet
|
2 baths 3 beds |
show details | |

|
#45
Bowden Dr
Evansville, IN 47725
|
1,872 sq. feet
|
2 baths 3 beds |
show details | |

|
#46
S Alvord Blvd
Evansville, IN 47714
|
1,600 sq. feet
|
2 baths 4 beds |
show details | |

|
#47
Hampton Dr
Evansville, IN 47715
|
713 sq. feet
|
1 baths 1 beds |
show details | |

|
#48
Irvin Ave
Evansville, IN 47715
|
1,044 sq. feet
|
2 baths 3 beds |
show details | |

|
#49
Graham Ave
Evansville, IN 47715
|
1,242 sq. feet
|
1 baths 3 beds |
show details | |

|
Check over 1 million property listings on Foreclosure.com!
|
browse all offers | |||

Latest news about housing in Chandler, IN collected exclusively by city-data.com from local newspapers, TV, and radio stations

 | Retire in Greenwood/Franklin, Columbus, Newburgh/Chandler, New Albany/Georgetown/Lanesville, Sellersburg, Madison, IN? (17 replies) |
| Evansville!!! (31 replies) |
| Moving to Evansville, IN (20 replies) |
| Relocating to Indy from Phoenix, AZ need some advise.... (6 replies) |
| storms (6 replies) |
| Possible move to Evansville Advise (5 replies) |

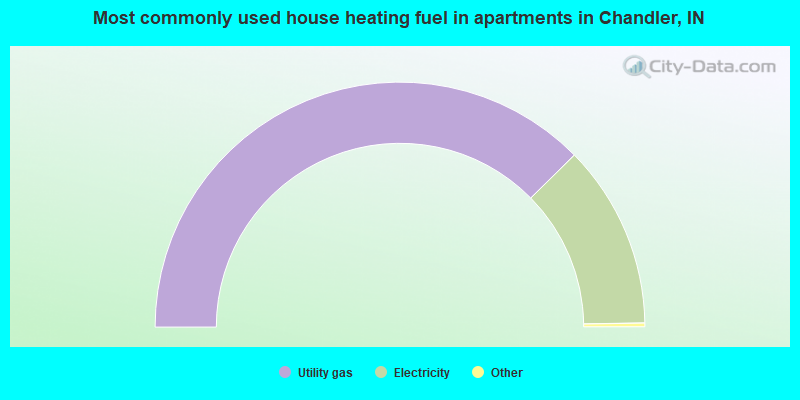
Median year apartment built: 1986
Household type by relationship:
Households: 3,791- Male householders: 606 (159 living alone), Female householders: 891 (220 living alone)
661 spouses (661 opposite-sex spouses), 115 unmarried partners, (102 opposite-sex unmarried partners), 1,207 children (1,131 natural, 0 adopted, 76 stepchildren), 0 grandchildren, 8 brothers or sisters, 32 parents, 0 foster children, 55 other relatives, 203 non-relatives
- In group quarters: 8
Size of family households: 368 2-persons, 262 3-persons, 195 4-persons, 133 5-persons.
Size of nonfamily households: 374 1-person, 117 2-persons, 33 3-persons.
632 married couples with children.
196 single-parent households (113 men, 83 women).
97.6% of residents of Chandler speak English at home.
0.9% of residents speak Spanish at home (36% speak English well, 64% speak English not well).
0.3% of residents speak other Indo-European language at home (100% speak English very well).
| Here: | 5.7 |
| State: | 6.6 |
| Here: | 5.2 |
| State: | 4.3 |

- Bedrooms in owner-occupied houses and condos in Chandler, Indiana
- 0no bedroom
- 671 bedroom
- 2262 bedrooms
- 7723 bedrooms
- 1834 bedrooms
- 05+ bedrooms

- Bedrooms in renter-occupied apartments in Chandler, Indiana
- 0no bedroom
- 381 bedroom
- 1082 bedrooms
- 893 bedrooms
- 104 bedrooms
- 05+ bedrooms

- Cars and other vehicles available in Chandler in owner-occupied houses/condos
- 0no vehicle
- 2951 vehicle
- 6122 vehicles
- 1843 vehicles
- 924 vehicles
- 645+ vehicles

- Cars and other vehicles available in Chandler in renter-occupied apartments
- 6no vehicle
- 791 vehicle
- 1142 vehicles
- 473 vehicles
- 04 vehicles
- 05+ vehicles

- Rooms in owner-occupied houses in Chandler, Indiana
- 01 room
- 02 rooms
- 483 rooms
- 974 rooms
- 3535 rooms
- 3886 rooms
- 1957 rooms
- 708 rooms
- 969+ rooms

- Rooms in renter-occupied apartments in Chandler, Indiana
- 01 room
- 242 rooms
- 383 rooms
- 384 rooms
- 285 rooms
- 836 rooms
- 247 rooms
- 08 rooms
- 109+ rooms


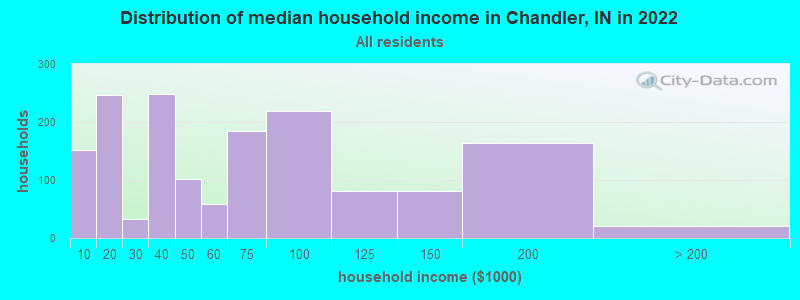
Chandler, IN household income distribution

- 151Less than $10,000
- 246$10,000 to $19,999
- 33$20,000 to $29,999
- 248$30,000 to $39,999
- 102$40,000 to $49,999
- 59$50,000 to $59,999
- 184$60,000 to $74,999
- 219$75,000 to $99,999
- 81$100,000 to $124,999
- 81$125,000 to $149,999
- 164$150,000 to $199,999
- 20$200,000 or more
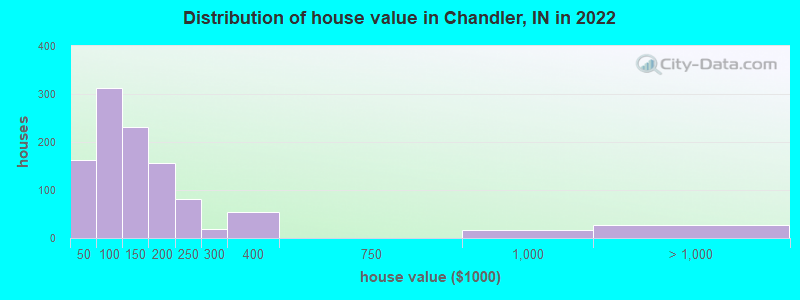
Home value of owner - occupied houses in 2022 in Chandler, IN
-
- 19Less than $10,000
- 5$10,000 to $14,999
- 12$15,000 to $19,999
- 53$30,000 to $34,999
- 67$35,000 to $39,999
- 4$40,000 to $49,999
- 65$50,000 to $59,999
- 35$60,000 to $69,999
- 59$70,000 to $79,999
- 124$80,000 to $89,999
- 21$90,000 to $99,999
- 91$100,000 to $124,999
- 139$125,000 to $149,999
- 106$150,000 to $174,999
- 49$175,000 to $199,999
- 81$200,000 to $249,999
- 18$250,000 to $299,999
- 54$300,000 to $399,999
- 16$750,000 to $999,999
- 26$2,000,000 or more
Rent paid by renters in 2022 in Chandler, IN
-
- 10$350 to $399
- 56$450 to $499
- 38$500 to $549
- 5$550 to $599
- 58$600 to $649
- 19$650 to $699
- 0$700 to $749
- 21$800 to $899
- 16No cash rent


Percentage of workers working in this county: 28.5%
Number of people working at home: 122 (6.6% of all workers)
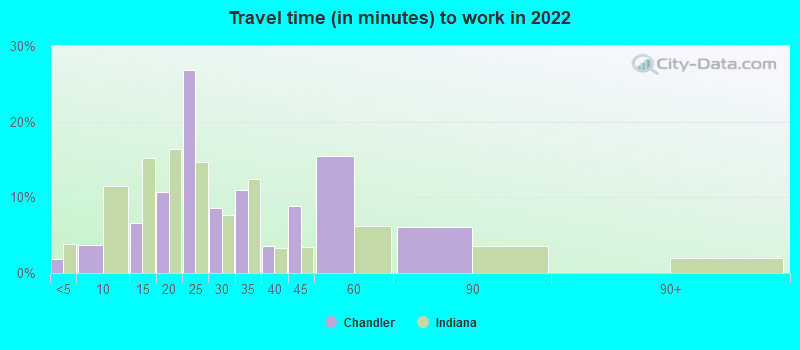
Travel time to work (commute)
- Less than 5 minutes: 0
- 5 to 9 minutes: 81
- 10 to 14 minutes: 175
- 15 to 19 minutes: 337
- 20 to 24 minutes: 294
- 25 to 29 minutes: 167
- 30 to 34 minutes: 347
- 35 to 39 minutes: 43
- 40 to 44 minutes: 49
- 45 to 59 minutes: 204
- 60 to 89 minutes: 23
- 90 or more minutes: 41
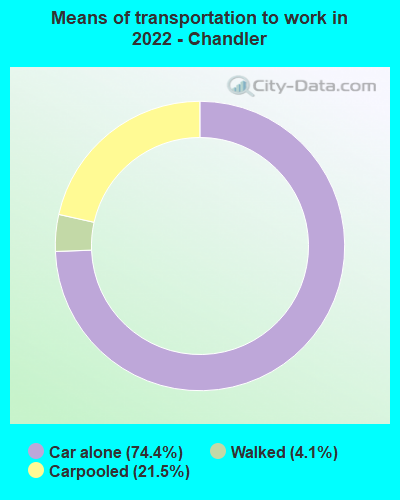
Means of transportation to work:
- Drove a car alone: 757 (65.7%)
- Carpooled: 241 (20.9%)
- Walked: 41 (3.6%)
- Worked at home: 122 (10.6%)

- Unemployment by race in 2022
- Unemployment rate for White non-Hispanic residents
- 12.0%Males
- 3.0%Females

- Year of entry for the foreign-born population in Chandler, Indiana
- 01995 to March 2000
- 01990 to 1994
- 01985 to 1989
- 01980 to 1984
- 01975 to 1979
- 01970 to 1974
- 01965 to 1969
- 7Before 1965

First ancestries reported:
- German: 361 (21.1%)
- American: 246 (14.4%)
- English: 241 (14.1%)
- Irish: 194 (11.4%)
- Scandinavian: 35 (2.0%)
- French Canadian: 34 (2.0%)
- Italian: 28 (1.6%)
- Dutch: 13 (0.8%)
- Czech: 12 (0.7%)
- Polish: 12 (0.7%)
- Welsh: 12 (0.7%)
- European: 10 (0.6%)
Most common places of birth for foreign-born residents (%):
| Chandler: | 100.0% (7) |
| Indiana: | 5.3% (9,823) |
Place of birth for U.S.-born residents:
- This state: 3,211
- Other state: 632
- Northeast: 27
- Midwest: 130
- South: 373
- West: 103
97.6% of Chandler residents lived in the same house 1 years ago.
Out of people who lived in different houses, 28.3% lived in this county.
Out of people who lived in different counties, 87.0% lived in Indiana.
| Chandler: | 97.6% |
| State average: | 87.1% |
Education attainment for males 25 years and older:
- No schooling: 0
- Nursery to 4th grade: 0
- 5th and 6th grade: 0
- 7th and 8th grade: 37
- 9th grade: 4
- 10th grade: 16
- 11th grade: 13
- 12th grade, no diploma: 0
- High school graduate (or equivalency): 650
- Less than 1 year of college: 62
- Some college more than 1 year, no degree: 101
- Associate degree: 69
- Bachelor's degree: 127
- Master's degree: 0
- Professional school degree: 0
- Doctorate degree: 0

Education attainment for females 25 years and older:
- No schooling: 35
- Nursery to 4th grade: 0
- 5th and 6th grade: 0
- 7th and 8th grade: 23
- 9th grade: 11
- 10th grade: 15
- 11th grade: 0
- 12th grade, no diploma: 35
- High school graduate (or equivalency): 468
- Less than 1 year of college: 124
- Some college more than 1 year, no degree: 160
- Associate degree: 128
- Bachelor's degree: 172
- Master's degree: 121
- Professional school degree: 0
- Doctorate degree: 0


Housing units in structures:
- One, detached: 1,334
- Two: 24
- 3 or 4: 90
- 5 to 9: 24
- Mobile homes: 197
Median worth of mobile homes: $72,483
Housing units lacking complete kitchen facilities in 2022: 2.1%
House/condo owner moved in on average 11 years ago
Renter moved in on average 4 years ago

Private vs. public school enrollment:
| Here: | 12.3% |
| Indiana: | 14.9% |
| Here: | 0.0% |
| Indiana: | 11.4% |
| Here: | 2.0% |
| Indiana: | 22.3% |


