Chandler, TX (Texas) Houses and Residents
| Chandler: | $267,413 |
| Texas: | $275,400 |
Mean price in 2022:
Detached houses: $309,245
Here: $309,245 State: $369,058
Total population: 2,861 (Urban population: 0, Rural population: 2,083 (all nonfarm))
Houses: 1,566 (1,436 occupied: 1,053 owner occupied, 429 renter occupied)
| % of renters here: | 29% |
| State: | 38% |
Housing density: 447 houses/condos per square mile
Median price asked for vacant for-sale houses and condos in 2022 in this county: $379,227.
Median contract rent in 2022: $1,013 (lower quartile is $360, upper quartile is $1,061)
Median rent asked for vacant for-rent units in 2022: $1,552
Median gross rent in Chandler, TX in 2022: $996
Housing units in Chandler with a mortgage: 436 (0 second mortgage, 0 home equity loan, 0 both second mortgage and home equity loan)
Houses without a mortgage: 0
Median household income for houses/condos with a mortgage: $113,200
Median household income for apartments without a mortgage: $55,292
Median monthly housing costs: $885
Compare current foreclosures near Chandler, TX:
| Photo | Address | Area | Beds / Baths | Price | Details |
|---|---|---|---|---|---|

|
#1
Jak Ln
Chandler, TX 75758
|
1,654 sq. feet
|
2 baths 3 beds |
show details | |

|
#2
Joe Paul Ln
Chandler, TX 75758
|
- sq. feet
|
- baths - beds |
show details | |

|
#3
Lakewood Ln
Chandler, TX 75758
|
2,267 sq. feet
|
- baths - beds |
show details | |

|
#4
Kingsley Cir
Chandler, TX 75758
|
1,568 sq. feet
|
- baths - beds |
show details | |

|
#5
Ridge Rd
Chandler, TX 75758
|
1,120 sq. feet
|
- baths - beds |
show details | |

|
#6
Vz County Road 4811
Chandler, TX 75758
|
- sq. feet
|
- baths - beds |
show details | |

|
#7
Pecan Rdg
Chandler, TX 75758
|
1,904 sq. feet
|
- baths - beds |
show details | |

|
#8
4th St
Chandler, TX 75758
|
- sq. feet
|
- baths - beds |
show details | |

|
#9
Neches Dr
Chandler, TX 75758
|
1,418 sq. feet
|
- baths - beds |
show details | |

|
#10
Lakeview Dr
Lindale, TX 75771
|
3,796 sq. feet
|
3 baths 4 beds |
$415,000
|
show details |
| Photo | Address | Area | Beds / Baths | Price | Details |
|---|---|---|---|---|---|

|
#11
County Road 3105
Chandler, TX 75758
|
- sq. feet
|
- baths - beds |
show details | |

|
#12
County Road 3411
Chandler, TX 75758
|
- sq. feet
|
- baths - beds |
show details | |

|
#13
E Devine St
Tyler, TX 75701
|
1,073 sq. feet
|
1 baths 3 beds |
show details | |

|
#14
Gretna Green Ln
Tyler, TX 75703
|
2,662 sq. feet
|
2 baths 3 beds |
show details | |

|
#15
Saint Andrews Cir
Lindale, TX 75771
|
2,320 sq. feet
|
2 baths 3 beds |
show details | |

|
#16
Mary Martin Dr
Flint, TX 75762
|
1,837 sq. feet
|
2 baths 3 beds |
show details | |

|
#17
San Saba St
Bullard, TX 75757
|
- sq. feet
|
1 baths 2 beds |
show details | |

|
#18
Bois D Arc Dr
Bullard, TX 75757
|
1,756 sq. feet
|
2 baths 4 beds |
show details | |

|
#19
El Paso Dr
Bullard, TX 75757
|
- sq. feet
|
2 baths 4 beds |
show details | |

|
#20
County Road 1223
Tyler, TX 75709
|
- sq. feet
|
2 baths 3 beds |
show details |
| Photo | Address | Area | Beds / Baths | Price | Details |
|---|---|---|---|---|---|

|
#21
County 1197 Rd
Flint, TX 75762
|
- sq. feet
|
2 baths 3 beds |
show details | |

|
#22
E Amherst Dr
Tyler, TX 75701
|
1,170 sq. feet
|
2 baths - beds |
show details | |

|
#23
E Houston St
Tyler, TX 75702
|
1,120 sq. feet
|
1 baths - beds |
show details | |

|
#24
Greenwood Trl
Bullard, TX 75757
|
2,428 sq. feet
|
3 baths - beds |
show details | |

|
#25
E Dawson St
Tyler, TX 75701
|
1,007 sq. feet
|
1 baths - beds |
show details | |

|
#26
Vanderbilt
Tyler, TX 75703
|
4,532 sq. feet
|
3 baths - beds |
show details | |

|
#27
W 2nd St
Tyler, TX 75701
|
1,491 sq. feet
|
1 baths - beds |
show details | |

|
#28
County Road 122
Tyler, TX 75703
|
3,160 sq. feet
|
4 baths - beds |
show details | |

|
#29
Big Oak Dr
Flint, TX 75762
|
1,309 sq. feet
|
2 baths - beds |
show details | |

|
#30
Ashwood Dr
Tyler, TX 75703
|
3,090 sq. feet
|
3 baths - beds |
show details |
| Photo | Address | Area | Beds / Baths | Price | Details |
|---|---|---|---|---|---|

|
#31
Arlington Ave
Tyler, TX 75701
|
2,925 sq. feet
|
2 baths - beds |
show details | |

|
#32
Joel Dr
Tyler, TX 75703
|
1,501 sq. feet
|
2 baths - beds |
show details | |

|
#33
Ruggles Ct W
Flint, TX 75762
|
1,877 sq. feet
|
2 baths - beds |
show details | |

|
#34
Brigadoon St
Tyler, TX 75703
|
2,156 sq. feet
|
2 baths - beds |
show details | |

|
#35
Belmont Dr
Tyler, TX 75701
|
1,226 sq. feet
|
2 baths - beds |
show details | |

|
#36
S Keaton Ave
Tyler, TX 75701
|
1,934 sq. feet
|
2 baths - beds |
show details | |

|
#37
Bain Pl
Tyler, TX 75701
|
2,156 sq. feet
|
2 baths - beds |
show details | |

|
#38
Lonetree Cir
Tyler, TX 75706
|
2,011 sq. feet
|
2 baths - beds |
show details | |

|
#39
Preakness Dr
Flint, TX 75762
|
1,467 sq. feet
|
2 baths - beds |
show details | |

|
#40
Triple Crown Dr
Flint, TX 75762
|
1,615 sq. feet
|
2 baths - beds |
show details |
| Photo | Address | Area | Beds / Baths | Price | Details |
|---|---|---|---|---|---|

|
#41
N Confederate Ave
Tyler, TX 75702
|
1,716 sq. feet
|
2 baths - beds |
show details | |

|
#42
Baylor Dr
Tyler, TX 75703
|
2,617 sq. feet
|
2 baths - beds |
show details | |

|
#43
Rana Park
Flint, TX 75762
|
2,253 sq. feet
|
2 baths - beds |
show details | |

|
#44
Cass Cir
Flint, TX 75762
|
1,811 sq. feet
|
2 baths - beds |
show details | |

|
#45
E Plainview St
Tyler, TX 75701
|
2,133 sq. feet
|
2 baths - beds |
show details | |

|
#46
Lakeland Dr
Tyler, TX 75708
|
1,720 sq. feet
|
2 baths - beds |
show details | |

|
#47
County Road 4104
Lindale, TX 75771
|
1,400 sq. feet
|
2 baths - beds |
show details | |

|
#48
County Road 214
Tyler, TX 75707
|
1,384 sq. feet
|
2 baths - beds |
show details | |

|
#49
Fm 848
Whitehouse, TX 75791
|
1,250 sq. feet
|
2 baths - beds |
show details | |

|
Check over 1 million property listings on Foreclosure.com!
|
browse all offers | |||

Latest news about housing in Chandler, TX collected exclusively by city-data.com from local newspapers, TV, and radio stations

 | Apartments near Katy Area(Houston) (3 replies) |
| Dallas core developments thread (148 replies) |
| southern homes (28 replies) |
| real estate in Tyler area. (14 replies) |
| If you needed a 4 or 5 bdr house... (17 replies) |
| Bring Back Metro Matt and Mark Senior Development News & Analysis (1297 replies) |

Median year apartment built: 2018
Household type by relationship:
Households: 3,383- Male householders: 694 (160 living alone), Female householders: 745 (387 living alone)
782 spouses (782 opposite-sex spouses), 0 unmarried partners, (0 opposite-sex unmarried partners), 906 children (829 natural, 50 adopted, 26 stepchildren), 29 grandchildren, 45 brothers or sisters, 90 parents, 0 foster children, 0 other relatives, 8 non-relatives
- In group quarters: 81
Size of family households: 411 2-persons, 158 3-persons, 262 4-persons, 2 5-persons, 8 7-or-more-persons.
Size of nonfamily households: 640 1-person, 4 2-persons.
523 married couples with children.
27 single-parent households (27 men, 0 women).
95.7% of residents of Chandler speak English at home.
4.6% of residents speak Spanish at home (20% speak English very well, 70% speak English well, 3% speak English not well, 7% don't speak English at all).
0.2% of residents speak other Indo-European language at home (100% speak English very well).
Foreign born population: 113 (3.3%)
(45.1% of them are naturalized citizens)
| Here: | 5.8 |
| State: | 6.3 |
| Here: | 4.3 |
| State: | 4.0 |

- Bedrooms in owner-occupied houses and condos in Chandler, Texas
- 6no bedroom
- 281 bedroom
- 1532 bedrooms
- 7113 bedrooms
- 1484 bedrooms
- 65+ bedrooms

- Bedrooms in renter-occupied apartments in Chandler, Texas
- 0no bedroom
- 1381 bedroom
- 1772 bedrooms
- 1043 bedrooms
- 114 bedrooms
- 05+ bedrooms

- Cars and other vehicles available in Chandler in owner-occupied houses/condos
- 0no vehicle
- 3311 vehicle
- 5072 vehicles
- 1543 vehicles
- 564 vehicles
- 65+ vehicles

- Cars and other vehicles available in Chandler in renter-occupied apartments
- 0no vehicle
- 3311 vehicle
- 862 vehicles
- 133 vehicles
- 04 vehicles
- 05+ vehicles

- Rooms in owner-occupied houses in Chandler, Texas
- 01 room
- 62 rooms
- 453 rooms
- 724 rooms
- 4005 rooms
- 3136 rooms
- 867 rooms
- 998 rooms
- 329+ rooms

- Rooms in renter-occupied apartments in Chandler, Texas
- 01 room
- 342 rooms
- 1103 rooms
- 1174 rooms
- 835 rooms
- 676 rooms
- 117 rooms
- 88 rooms
- 09+ rooms


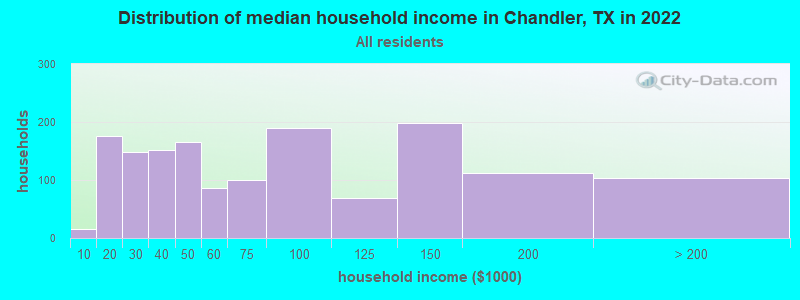
Chandler, TX household income distribution

- 16Less than $10,000
- 176$10,000 to $19,999
- 149$20,000 to $29,999
- 152$30,000 to $39,999
- 165$40,000 to $49,999
- 86$50,000 to $59,999
- 100$60,000 to $74,999
- 190$75,000 to $99,999
- 69$100,000 to $124,999
- 199$125,000 to $149,999
- 112$150,000 to $199,999
- 104$200,000 or more
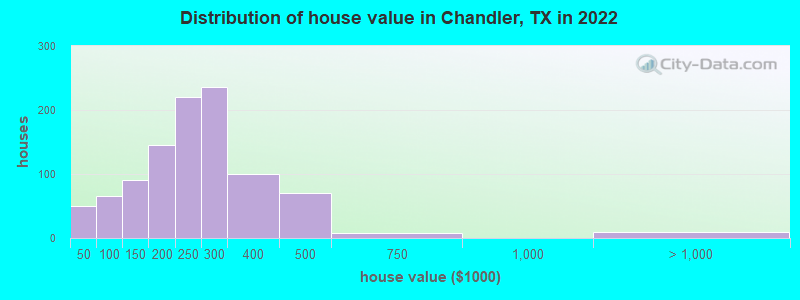
Home value of owner - occupied houses in 2022 in Chandler, TX
-
- 31Less than $10,000
- 9$15,000 to $19,999
- 4$20,000 to $24,999
- 3$40,000 to $49,999
- 2$50,000 to $59,999
- 6$60,000 to $69,999
- 17$80,000 to $89,999
- 35$90,000 to $99,999
- 47$100,000 to $124,999
- 42$125,000 to $149,999
- 86$150,000 to $174,999
- 58$175,000 to $199,999
- 219$200,000 to $249,999
- 235$250,000 to $299,999
- 100$300,000 to $399,999
- 71$400,000 to $499,999
- 7$500,000 to $749,999
- 10$2,000,000 or more
Rent paid by renters in 2022 in Chandler, TX
-
- 11$150 to $199
- 51$200 to $249
- 69$300 to $349
- 12$550 to $599
- 37$600 to $649
- 9$750 to $799
- 86$800 to $899
- 44$900 to $999
- 32$1,000 to $1,249
- 10$1,250 to $1,499
- 14$1,500 to $1,999
- 40No cash rent


Percentage of workers working in this county: 33.1%
Number of people working at home: 123 (8.0% of all workers)
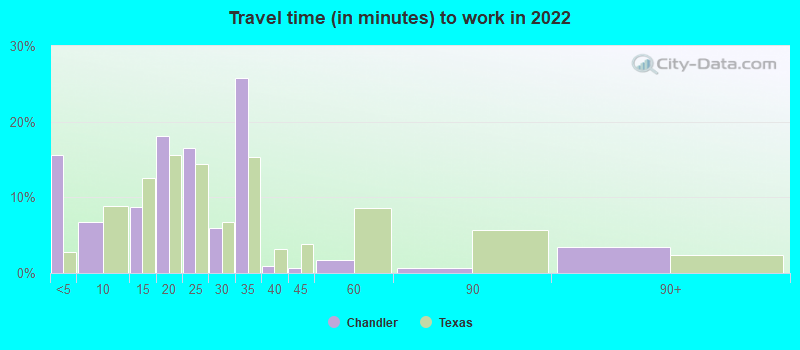
Travel time to work (commute)
- Less than 5 minutes: 43
- 5 to 9 minutes: 60
- 10 to 14 minutes: 253
- 15 to 19 minutes: 85
- 20 to 24 minutes: 419
- 25 to 29 minutes: 54
- 30 to 34 minutes: 388
- 35 to 39 minutes: 5
- 40 to 44 minutes: 41
- 45 to 59 minutes: 90
- 60 to 89 minutes: 39
- 90 or more minutes: 52
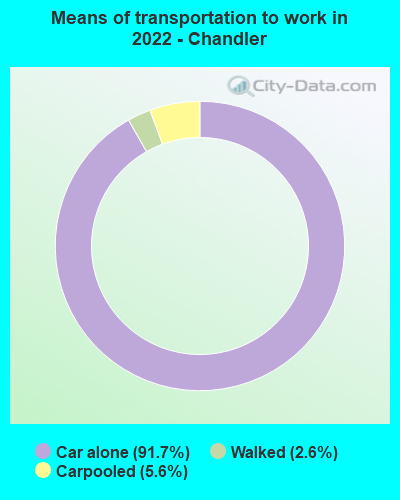
Means of transportation to work:
- Drove a car alone: 586 (76.4%)
- Carpooled: 38 (5.0%)
- Walked: 18 (2.3%)
- Worked at home: 123 (16.0%)

- Unemployment by race in 2022
- Unemployment rate for White non-Hispanic residents
- 0.8%Males
- 1.7%Females
- Unemployment rate for Black residents
- 84.4%Females
- Unemployment rate for Hispanic or Latino residents
- 27.1%Females

- Year of entry for the foreign-born population in Chandler, Texas
- 02010 or later
- 722000 to 2009
- 111990 to 1999
- 51980 to 1989
- 01970 to 1979
- 9Before 1970

First ancestries reported:
- American: 355 (25.2%)
- English: 207 (14.7%)
- German: 145 (10.3%)
- Irish: 144 (10.2%)
- Scottish: 66 (4.7%)
- Scotch-Irish: 37 (2.6%)
- French: 26 (1.8%)
- French Canadian: 22 (1.6%)
- Dutch: 8 (0.6%)
- European: 4 (0.3%)
- British: 1 (0.07%)
Most common places of birth for foreign-born residents (%):
| Chandler: | 67.0% (63) |
| Texas: | 48.4% (2,411,723) |
| Chandler: | 10.6% (10) |
| Texas: | 3.7% (184,770) |
| Chandler: | 9.6% (9) |
| Texas: | 0.4% (21,746) |
| Chandler: | 6.4% (6) |
| Texas: | 2.3% (115,558) |
Place of birth for U.S.-born residents:
- This state: 2,246
- Other state: 962
- Northeast: 125
- Midwest: 185
- South: 304
- West: 351
86.5% of Chandler residents lived in the same house 1 years ago.
Out of people who lived in different houses, 34.2% lived in this county.
Out of people who lived in different counties, 76.1% lived in Texas.
| Chandler: | 86.5% |
| State average: | 85.7% |
Education attainment for males 25 years and older:
- No schooling: 38
- Nursery to 4th grade: 0
- 5th and 6th grade: 5
- 7th and 8th grade: 0
- 9th grade: 0
- 10th grade: 0
- 11th grade: 0
- 12th grade, no diploma: 0
- High school graduate (or equivalency): 279
- Less than 1 year of college: 78
- Some college more than 1 year, no degree: 250
- Associate degree: 316
- Bachelor's degree: 109
- Master's degree: 34
- Professional school degree: 33
- Doctorate degree: 0

Education attainment for females 25 years and older:
- No schooling: 0
- Nursery to 4th grade: 7
- 5th and 6th grade: 22
- 7th and 8th grade: 0
- 9th grade: 7
- 10th grade: 0
- 11th grade: 0
- 12th grade, no diploma: 0
- High school graduate (or equivalency): 483
- Less than 1 year of college: 158
- Some college more than 1 year, no degree: 246
- Associate degree: 181
- Bachelor's degree: 217
- Master's degree: 164
- Professional school degree: 0
- Doctorate degree: 13


Housing units in structures:
- One, detached: 1,207
- One, attached: 44
- Two: 42
- 3 or 4: 150
- 5 to 9: 34
- 20 to 49: 40
- Mobile homes: 44
House/condo owner moved in on average 8 years ago
Renter moved in on average 0 years ago

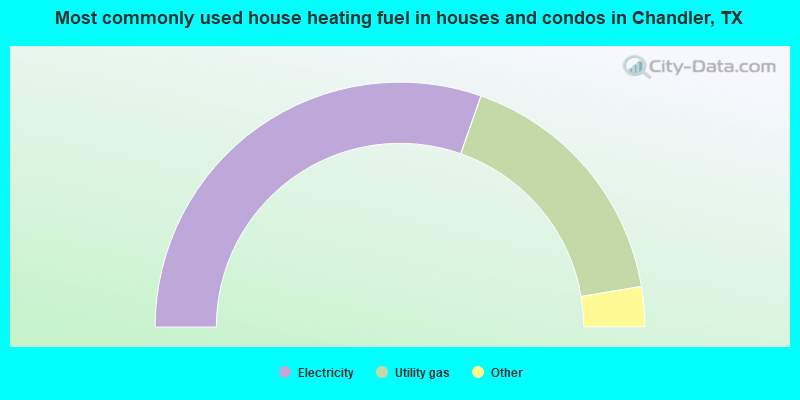
- 60.8%Electricity
- 34.0%Utility gas
- 3.1%Bottled, tank, or LP gas
- 2.1%Wood
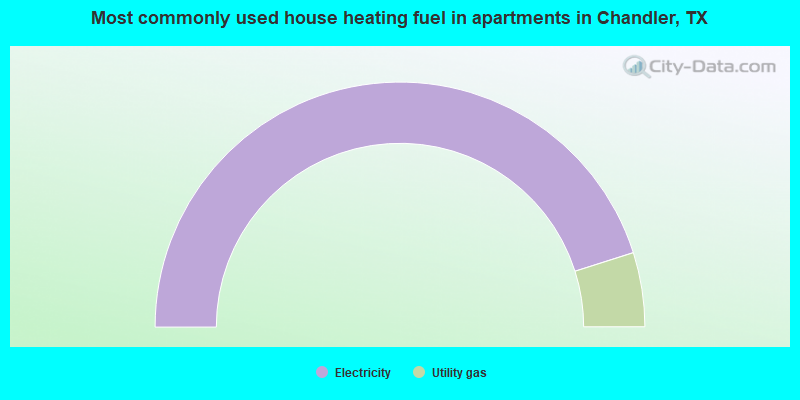
- 90.2%Electricity
- 9.8%Utility gas
Private vs. public school enrollment:
| Here: | 0.0% |
| Texas: | 8.8% |
| Here: | 0.0% |
| Texas: | 8.0% |
| Here: | 9.1% |
| Texas: | 16.2% |


