Charleston, TN (Tennessee) Houses and Residents
| Charleston: | $175,912 |
| Tennessee: | $284,800 |
Mean price in 2022:
Detached houses: $236,551
Here: $236,551 State: $374,382 Mobile homes: $86,396
Here: $86,396 State: $101,421
Total population: 671 (Urban population: 0, Rural population: 676 (all nonfarm))
Houses: 307 (253 occupied: 186 owner occupied, 66 renter occupied)
| % of renters here: | 26% |
| State: | 33% |
Housing density: 312 houses/condos per square mile
Median price asked for vacant for-sale houses and condos in 2022 in this county: $235,873.
Median contract rent in 2022: $727 (lower quartile is $524, upper quartile is $803)
Median rent asked for vacant for-rent units in 2022: $1,971
Median gross rent in Charleston, TN in 2022: $946
Housing units in Charleston with a mortgage: 96 (6 second mortgage, 0 home equity loan, 6 both second mortgage and home equity loan)
Houses without a mortgage: 0
Median household income for houses/condos with a mortgage: $81,942
Median monthly housing costs: $814
Compare current foreclosures near Charleston, TN:
| Photo | Address | Area | Beds / Baths | Price | Details |
|---|---|---|---|---|---|

|
#1
Jessie Ln NW
Charleston, TN 37310
|
2,117 sq. feet
|
3 baths 4 beds |
show details | |

|
#2
Wool St NE
Charleston, TN 37310
|
1,428 sq. feet
|
1 baths - beds |
show details | |

|
#3
Union Grove Rd NE
Charleston, TN 37310
|
1,932 sq. feet
|
2 baths - beds |
show details | |

|
#4
Chatata Valley Rd NE
Charleston, TN 37310
|
1,588 sq. feet
|
2 baths - beds |
show details | |

|
#5
Chatata Valley Rd NE
Charleston, TN 37310
|
1,796 sq. feet
|
1 baths - beds |
show details | |

|
#6
Baker Bridge Rd NE
Charleston, TN 37310
|
750 sq. feet
|
1 baths - beds |
show details | |

|
#7
Longwith St NE
Charleston, TN 37310
|
1,269 sq. feet
|
1 baths - beds |
show details | |

|
#8
Scott St NE
Charleston, TN 37310
|
1,512 sq. feet
|
- baths - beds |
show details | |

|
#9
Mustang Dr NW
Charleston, TN 37310
|
- sq. feet
|
- baths - beds |
show details | |

|
#10
Hiwassee St Nw, Apt 6
Charleston, TN 37310
|
- sq. feet
|
- baths - beds |
show details |
| Photo | Address | Area | Beds / Baths | Price | Details |
|---|---|---|---|---|---|

|
#11
Chatata Valley Rd NE
Charleston, TN 37310
|
- sq. feet
|
- baths - beds |
show details | |

|
#12
Maple Crest Cir NW
Charleston, TN 37310
|
- sq. feet
|
- baths - beds |
show details | |

|
#13
Old Wagon Rd NE
Charleston, TN 37310
|
1,976 sq. feet
|
- baths - beds |
show details | |

|
#14
Morgan Nichole Dr
Charleston, TN 37310
|
- sq. feet
|
- baths - beds |
show details | |

|
#15
Bates St NE
Charleston, TN 37310
|
- sq. feet
|
- baths - beds |
show details | |

|
#16
Baker Bridge Rd NE
Charleston, TN 37310
|
1,960 sq. feet
|
- baths - beds |
show details | |

|
#17
Eureka Rd NW
Charleston, TN 37310
|
952 sq. feet
|
- baths - beds |
show details | |

|
#18
Burnt Ridge Dr
Charleston, TN 37310
|
- sq. feet
|
- baths - beds |
show details | |

|
#19
Leyland Dr
Charleston, TN 37310
|
- sq. feet
|
- baths - beds |
show details | |

|
#20
Chatata Valley Rd NE
Charleston, TN 37310
|
- sq. feet
|
- baths - beds |
show details |
| Photo | Address | Area | Beds / Baths | Price | Details |
|---|---|---|---|---|---|

|
#21
Hiwassee St NW # 8927
Charleston, TN 37310
|
- sq. feet
|
- baths - beds |
show details | |

|
#22
Scott St NE
Charleston, TN 37310
|
- sq. feet
|
- baths - beds |
show details | |

|
#23
Spring Place Rd SE
Cleveland, TN 37323
|
3,440 sq. feet
|
2 baths 3 beds |
$99,000
|
show details |

|
#24
Georgetown Cir NW
Cleveland, TN 37312
|
1,216 sq. feet
|
2 baths 3 beds |
show details | |

|
#25
County Road 112
Athens, TN 37303
|
1,456 sq. feet
|
2 baths 3 beds |
show details | |

|
#26
Dunn St
Etowah, TN 37331
|
1,398 sq. feet
|
1 baths 3 beds |
show details | |

|
#27
Canal St
Athens, TN 37303
|
1,590 sq. feet
|
1 baths - beds |
show details | |

|
#28
Pin Oaks Cir NE
Cleveland, TN 37323
|
1,664 sq. feet
|
2 baths 3 beds |
show details | |

|
#29
Virginia Ave SW
Cleveland, TN 37311
|
1,196 sq. feet
|
2 baths 3 beds |
show details | |

|
#30
Lee St SE
Cleveland, TN 37311
|
1,180 sq. feet
|
2 baths 3 beds |
show details |
| Photo | Address | Area | Beds / Baths | Price | Details |
|---|---|---|---|---|---|

|
#31
White Oak Rd NW
Cleveland, TN 37312
|
1,308 sq. feet
|
1 baths - beds |
show details | |

|
#32
State Highway 58 S
Georgetown, TN 37336
|
3,279 sq. feet
|
2 baths - beds |
show details | |

|
#33
Ladd Springs Rd SE
Cleveland, TN 37323
|
792 sq. feet
|
1 baths 2 beds |
show details | |

|
#34
Silver Springs Trl NW
Cleveland, TN 37312
|
2,144 sq. feet
|
3 baths 3 beds |
show details | |

|
#35
Eldredge Cir NW
Cleveland, TN 37312
|
1,678 sq. feet
|
2 baths 3 beds |
show details | |

|
#36
Black Fox Rd
Mc Donald, TN 37353
|
2,442 sq. feet
|
3 baths 3 beds |
show details | |

|
#37
Abshire Ln NE
Cleveland, TN 37323
|
2,643 sq. feet
|
3 baths 4 beds |
show details | |

|
#38
Farmway Dr SE
Cleveland, TN 37323
|
1,408 sq. feet
|
2 baths 3 beds |
show details | |

|
#39
Stonewood Dr NW
Cleveland, TN 37311
|
2,530 sq. feet
|
3 baths 3 beds |
show details | |

|
#40
Webb Ln NE
Cleveland, TN 37323
|
1,635 sq. feet
|
2 baths 3 beds |
show details |
| Photo | Address | Area | Beds / Baths | Price | Details |
|---|---|---|---|---|---|

|
#41
Webb Ln NE
Cleveland, TN 37323
|
1,710 sq. feet
|
2 baths 3 beds |
show details | |

|
#42
Fern Dr SE
Cleveland, TN 37323
|
1,337 sq. feet
|
2 baths 3 beds |
show details | |

|
#43
Thoroughbred Dr NW
Cleveland, TN 37312
|
2,501 sq. feet
|
4 baths 4 beds |
show details | |

|
#44
Horton Rd SE
Cleveland, TN 37323
|
1,144 sq. feet
|
2 baths 3 beds |
show details | |

|
#45
Blue Springs Rd
Cleveland, TN 37311
|
1,495 sq. feet
|
2 baths 3 beds |
show details | |

|
#46
Old York Rd NE
Cleveland, TN 37323
|
1,480 sq. feet
|
1 baths 3 beds |
show details | |

|
#47
Williamsburg Cir SE
Cleveland, TN 37323
|
950 sq. feet
|
1 baths - beds |
show details | |

|
#48
Dixie Dr NE
Cleveland, TN 37323
|
936 sq. feet
|
1 baths - beds |
show details | |

|
#49
Crescent Dr SE
Cleveland, TN 37323
|
1,064 sq. feet
|
2 baths - beds |
show details | |

|
Check over 1 million property listings on Foreclosure.com!
|
browse all offers | |||

Latest news about housing in Charleston, TN collected exclusively by city-data.com from local newspapers, TV, and radio stations

 | Housing demand, contractors availability, lead time, wells, septic, permits? (15 replies) |
| Nashville skyline thread (314 replies) |
| Igor Blevin's, "A Native Californian in Knoxville" (220 replies) |
| Looking for a progressive community near Knoxville or Nashville (46 replies) |
| Is TN right for me? (36 replies) |
| Tellico Village Master Thread (573 replies) |

Median year apartment built: 1975
Household type by relationship:
Households: 651- Male householders: 124 (38 living alone), Female householders: 127 (44 living alone)
140 spouses (140 opposite-sex spouses), 5 unmarried partners, (5 opposite-sex unmarried partners), 143 children (129 natural, 10 adopted, 4 stepchildren), 31 grandchildren, 4 brothers or sisters, 5 parents, 0 foster children, 57 other relatives, 12 non-relatives
Size of family households: 56 2-persons, 42 3-persons, 39 4-persons, 8 5-persons, 13 6-persons, 7 7-or-more-persons.
Size of nonfamily households: 81 1-person, 4 2-persons.
80 married couples with children.
9 single-parent households (5 men, 4 women).
96.8% of residents of Charleston speak English at home.
1.9% of residents speak Spanish at home (83% speak English very well, 17% speak English not well).
0.6% of residents speak Asian or Pacific Island language at home (100% speak English very well).
Foreign born population: 5 (0.8%)
(80.0% of them are naturalized citizens)
| Here: | 6.6 |
| State: | 6.5 |
| Here: | 4.6 |
| State: | 4.4 |

- Bedrooms in owner-occupied houses and condos in Charleston, Tennessee
- 0no bedroom
- 01 bedroom
- 332 bedrooms
- 1233 bedrooms
- 274 bedrooms
- 35+ bedrooms

- Bedrooms in renter-occupied apartments in Charleston, Tennessee
- 0no bedroom
- 101 bedroom
- 232 bedrooms
- 223 bedrooms
- 104 bedrooms
- 05+ bedrooms

- Cars and other vehicles available in Charleston in owner-occupied houses/condos
- 2no vehicle
- 331 vehicle
- 652 vehicles
- 713 vehicles
- 94 vehicles
- 65+ vehicles

- Cars and other vehicles available in Charleston in renter-occupied apartments
- 7no vehicle
- 151 vehicle
- 342 vehicles
- 33 vehicles
- 04 vehicles
- 75+ vehicles

- Rooms in owner-occupied houses in Charleston, Tennessee
- 01 room
- 02 rooms
- 03 rooms
- 284 rooms
- 325 rooms
- 396 rooms
- 487 rooms
- 198 rooms
- 209+ rooms

- Rooms in renter-occupied apartments in Charleston, Tennessee
- 01 room
- 02 rooms
- 123 rooms
- 214 rooms
- 95 rooms
- 26 rooms
- 07 rooms
- 118 rooms
- 109+ rooms


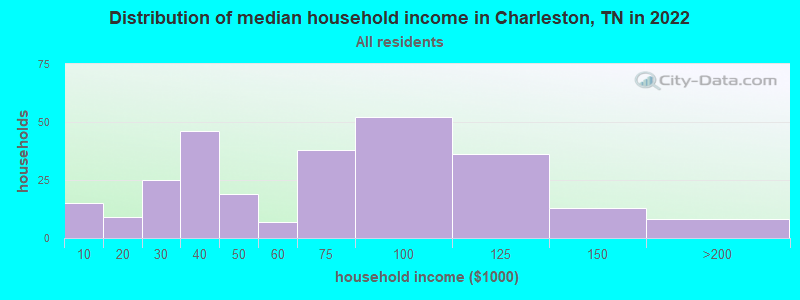
Charleston, TN household income distribution

- 15Less than $10,000
- 9$10,000 to $19,999
- 25$20,000 to $29,999
- 46$30,000 to $39,999
- 19$40,000 to $49,999
- 7$50,000 to $59,999
- 38$60,000 to $74,999
- 52$75,000 to $99,999
- 36$100,000 to $124,999
- 13$125,000 to $149,999
- 8$150,000 to $199,999
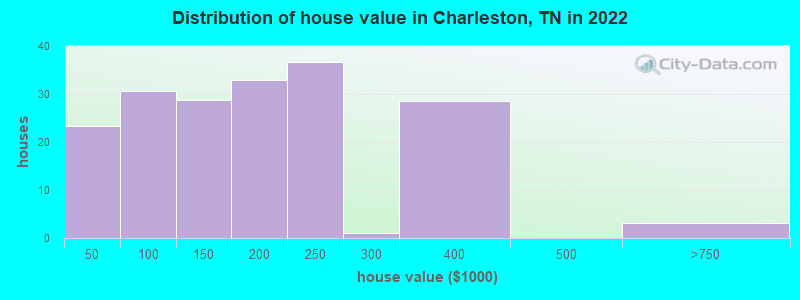
Home value of owner - occupied houses in 2022 in Charleston, TN
-
- 1Less than $10,000
- 1$10,000 to $14,999
- 4$25,000 to $29,999
- 16$30,000 to $34,999
- 1$50,000 to $59,999
- 21$60,000 to $69,999
- 4$70,000 to $79,999
- 3$80,000 to $89,999
- 10$100,000 to $124,999
- 17$125,000 to $149,999
- 20$150,000 to $174,999
- 11$175,000 to $199,999
- 36$200,000 to $249,999
- 0$250,000 to $299,999
- 28$300,000 to $399,999
- 3$500,000 to $749,999
Rent paid by renters in 2022 in Charleston, TN
-
- 3$300 to $349
- 7$400 to $449
- 1$450 to $499
- 11$500 to $549
- 18$650 to $699
- 4$700 to $749
- 3$800 to $899
- 13$1,000 to $1,249
- 1$1,250 to $1,499


Percentage of workers working in this county: 70.8%
Number of people working at home: 14 (4.6% of all workers)
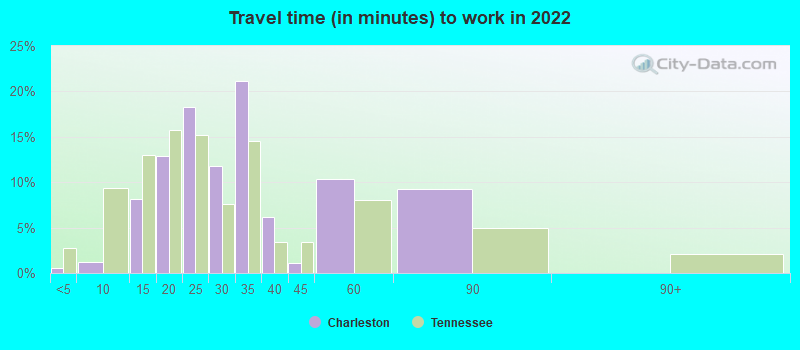
Travel time to work (commute)
- Less than 5 minutes: 19
- 5 to 9 minutes: 21
- 10 to 14 minutes: 15
- 15 to 19 minutes: 63
- 20 to 24 minutes: 27
- 25 to 29 minutes: 14
- 30 to 34 minutes: 61
- 35 to 39 minutes: 17
- 40 to 44 minutes: 4
- 45 to 59 minutes: 13
- 60 to 89 minutes: 28
- 90 or more minutes: 4
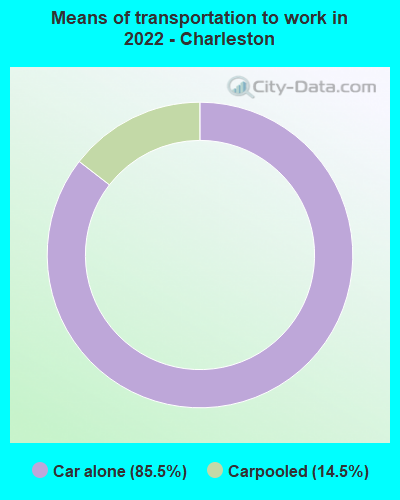
Means of transportation to work:
- Drove a car alone: 689 (79.9%)
- Carpooled: 118 (13.7%)
- Worked at home: 5 (0.6%)

- Unemployment by race in 2022
- Unemployment rate for White non-Hispanic residents
- 1.3%Males
- 1.0%Females
- Unemployment rate for two or more race residents
- 15.8%Males
- Unemployment rate for Hispanic or Latino residents
- 18.6%Males

- Year of entry for the foreign-born population in Charleston, Tennessee
- 22010 or later
- 32000 to 2009
- 21990 to 1999
- 01980 to 1989
- 01970 to 1979
- 6Before 1970

First ancestries reported:
- Irish: 73 (26.6%)
- American: 54 (19.7%)
- English: 51 (18.6%)
- German: 18 (6.6%)
- Belgian: 4 (1.5%)
- European: 3 (1.1%)
- British: 2 (0.7%)
- Dutch: 2 (0.7%)
- French: 2 (0.7%)
Most common places of birth for foreign-born residents (%):
| Charleston: | 42.9% (3) |
| Tennessee: | 23.0% (86,435) |
| Charleston: | 28.6% (2) |
| Tennessee: | 5.7% (21,286) |
Place of birth for U.S.-born residents:
- This state: 392
- Other state: 249
- Northeast: 27
- Midwest: 47
- South: 168
- West: 4
89.5% of Charleston residents lived in the same house 1 years ago.
Out of people who lived in different houses, 20.5% lived in this county.
Out of people who lived in different counties, 55.8% lived in Tennessee.
| Charleston: | 89.5% |
| State average: | 87.0% |
Education attainment for males 25 years and older:
- No schooling: 0
- Nursery to 4th grade: 1
- 5th and 6th grade: 0
- 7th and 8th grade: 0
- 9th grade: 0
- 10th grade: 20
- 11th grade: 10
- 12th grade, no diploma: 6
- High school graduate (or equivalency): 140
- Less than 1 year of college: 28
- Some college more than 1 year, no degree: 15
- Associate degree: 25
- Bachelor's degree: 13
- Master's degree: 0
- Professional school degree: 0
- Doctorate degree: 1

Education attainment for females 25 years and older:
- No schooling: 2
- Nursery to 4th grade: 0
- 5th and 6th grade: 2
- 7th and 8th grade: 1
- 9th grade: 2
- 10th grade: 0
- 11th grade: 2
- 12th grade, no diploma: 3
- High school graduate (or equivalency): 108
- Less than 1 year of college: 14
- Some college more than 1 year, no degree: 42
- Associate degree: 30
- Bachelor's degree: 17
- Master's degree: 2
- Professional school degree: 0
- Doctorate degree: 2


Housing units in structures:
- One, detached: 231
- One, attached: 2
- Two: 37
- 10 to 19: 2
- Mobile homes: 33
Median worth of mobile homes: $104,274
Housing units lacking complete kitchen facilities in 2022: 8.6%
House/condo owner moved in on average 9 years ago
Renter moved in on average 5 years ago

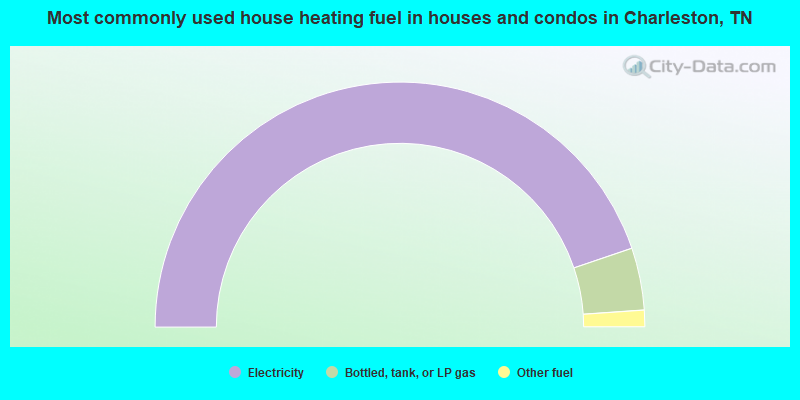
- 89.6%Electricity
- 8.2%Bottled, tank, or LP gas
- 2.2%Other fuel
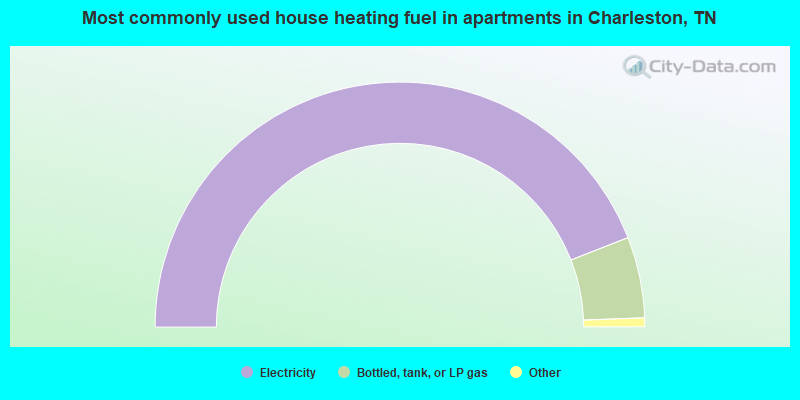
- 89.2%Electricity
- 10.8%Bottled, tank, or LP gas
Private vs. public school enrollment:
| Here: | 20.4% |
| Tennessee: | 15.0% |
| Here: | 31.0% |
| Tennessee: | 16.2% |
| Here: | 0.0% |
| Tennessee: | 23.5% |


