Charleston, VT (Vermont) Houses and Residents
| Charleston: | $210,945 |
| Vermont: | $304,700 |
Total population: 1,023 (Urban population: 0, Rural population: 901 (60 farm, 841 nonfarm))
Houses: 588 (364 occupied: 300 owner occupied, 64 renter occupied)
| % of renters here: | 18% |
| State: | 26% |
Housing density: 16 houses/condos per square mile
Median price asked for vacant for-sale houses and condos in 2022 in this county: $197,886.
Median contract rent in 2022: $694 (lower quartile is $592, upper quartile is $810)
Median gross rent in Charleston, VT in 2022: $929
Housing units in Charleston with a mortgage: 85 (0 second mortgage, 3 home equity loan, 0 both second mortgage and home equity loan)
Houses without a mortgage: 41
Compare current foreclosures near Charleston, VT:
| Photo | Address | Area | Beds / Baths | Price | Details |
|---|---|---|---|---|---|

|
#1
Depot St
West Burke, VT 05871
|
1,320 sq. feet
|
2 baths 2 beds |
$205,000
|
show details |

|
#2
South St
Orleans, VT 05860
|
2,135 sq. feet
|
2 baths 3 beds |
$275,500
|
show details |

|
#3
Salem Derby Rd
Newport, VT 05855
|
- sq. feet
|
1 baths 3 beds |
$119,900
|
show details |

|
#4
Ponemah Path
West Burke, VT 05871
|
- sq. feet
|
- baths - beds |
show details | |

|
#5
Vt Route 14 N
Newport, VT 05855
|
- sq. feet
|
- baths - beds |
show details | |

|
#6
Vt Route 105
Newport Center, VT 05857
|
- sq. feet
|
- baths - beds |
show details | |

|
#7
Hinman Rd
Glover, VT 05839
|
- sq. feet
|
- baths - beds |
show details | |

|
#8
Mount Vernon St
Newport, VT 05855
|
- sq. feet
|
- baths - beds |
show details | |

|
#9
Depot St
West Burke, VT 05871
|
- sq. feet
|
- baths - beds |
show details | |

|
Check over 1 million property listings on Foreclosure.com!
|
browse all offers | |||

Household type by relationship:
Households: 26,413- In family households: 21,371 (5,129 male householders, 2,169 female householders)
5,656 spouses, 6,697 children (6,082 natural, 229 adopted, 386 stepchildren), 334 grandchildren, 119 brothers or sisters, 162 parents, foster children, 130 other relatives, 867 non-relatives
- In nonfamily households: 5,042 (2,023 male householders (1,486 living alone)), 1,999 female householders (1,659 living alone)), 1,020 nonrelatives
- In group quarters: 818 (679 institutionalized population)
4,545 married couples with children.
1,627 single-parent households (444 men, 1,183 women).
94.8% of residents of Charleston speak English at home.
5.2% of residents speak other Indo-European language at home (80% speak English very well, 16% speak English well, 5% speak English not well).
Foreign born population: 36 (3.6%)
(69.4% of them are naturalized citizens)
| Here: | 5.3 |
| State: | 6.4 |
| Here: | 4.3 |
| State: | 3.9 |

- Bedrooms in owner-occupied houses and condos in Charleston, Vermont
- 9no bedroom
- 191 bedroom
- 702 bedrooms
- 1303 bedrooms
- 544 bedrooms
- 185+ bedrooms

- Bedrooms in renter-occupied apartments in Charleston, Vermont
- 4no bedroom
- 121 bedroom
- 162 bedrooms
- 263 bedrooms
- 64 bedrooms
- 05+ bedrooms

- Cars and other vehicles available in Charleston in owner-occupied houses/condos
- 4no vehicle
- 951 vehicle
- 1372 vehicles
- 493 vehicles
- 84 vehicles
- 75+ vehicles

- Cars and other vehicles available in Charleston in renter-occupied apartments
- 0no vehicle
- 371 vehicle
- 232 vehicles
- 03 vehicles
- 44 vehicles
- 05+ vehicles

- Rooms in owner-occupied houses in Charleston, Vermont
- 91 room
- 02 rooms
- 153 rooms
- 364 rooms
- 775 rooms
- 546 rooms
- 557 rooms
- 288 rooms
- 269+ rooms

- Rooms in renter-occupied apartments in Charleston, Vermont
- 41 room
- 82 rooms
- 63 rooms
- 104 rooms
- 155 rooms
- 106 rooms
- 67 rooms
- 58 rooms
- 09+ rooms


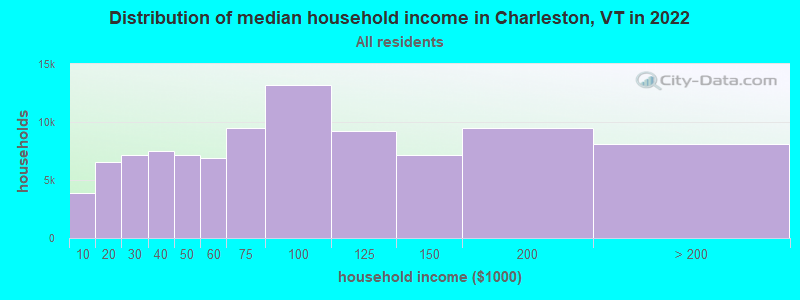
Charleston, VT household income distribution

- 3,460Less than $10,000
- 7,065$10,000 to $19,999
- 8,111$20,000 to $29,999
- 9,441$30,000 to $39,999
- 8,756$40,000 to $49,999
- 8,533$50,000 to $59,999
- 11,357$60,000 to $74,999
- 17,190$75,000 to $99,999
- 11,383$100,000 to $124,999
- 9,088$125,000 to $149,999
- 11,540$150,000 to $199,999
- 10,424$200,000 or more
Percentage of workers working in this county: 85.3%
Number of people working at home: 80 (17.3% of all workers)
Travel time to work (commute)
- Less than 5 minutes: 36
- 5 to 9 minutes: 23
- 10 to 14 minutes: 47
- 15 to 19 minutes: 44
- 20 to 24 minutes: 86
- 25 to 29 minutes: 32
- 30 to 34 minutes: 74
- 35 to 39 minutes: 9
- 40 to 44 minutes: 6
- 45 to 59 minutes: 9
- 60 to 89 minutes: 8
- 90 or more minutes: 7
Means of transportation to work:
- Drove a car alone: 284 (67.0%)
- Carpooled: 49 (11.6%)
- Bus or trolley bus: 2 (0.5%)
- Walked: 44 (10.4%)
- Other means: 2 (0.5%)
- Worked at home: 43 (10.1%)

- Year of entry for the foreign-born population in Charleston, Vermont
- 21995 to March 2000
- 01990 to 1994
- 01985 to 1989
- 31980 to 1984
- 01975 to 1979
- 01970 to 1974
- 01965 to 1969
- 28Before 1965

First ancestries reported:
- English: 233 (22.9%)
- French: 197 (19.4%)
- Other: 126 (12.4%)
- United States: 112 (11.0%)
- Irish: 86 (8.4%)
- French Canadian: 54 (5.3%)
- Scottish: 49 (4.8%)
- German: 47 (4.6%)
- Italian: 34 (3.3%)
- Dutch: 15 (1.5%)
- Polish: 14 (1.4%)
- Danish: 13 (1.3%)
- Scotch-Irish: 12 (1.2%)
- Swedish: 9 (0.9%)
- Swiss: 7 (0.7%)
- Greek: 2 (0.2%)
- Hungarian: 2 (0.2%)
- Norwegian: 2 (0.2%)
- Russian: 2 (0.2%)
- Subsaharan African: 2 (0.2%)
Most common places of birth for foreign-born residents (%):
| Charleston: | 78.8% (26) |
| Vermont: | 34.0% (7,912) |
| Charleston: | 15.2% (5) |
| Vermont: | 1.2% (273) |
| Charleston: | 6.1% (2) |
| Vermont: | 2.5% (588) |
Place of birth for U.S.-born residents:
- This state: 640
- Other state: 226
- Northeast: 181
- Midwest: 16
- South: 13
- West: 16
62% of Charleston residents lived in the same house 5 years ago.
Out of people who lived in different houses, 51% lived in this county.
Out of people who lived in different counties, 56% lived in Vermont.
Education attainment for males 25 years and older:
- No schooling: 0
- Nursery to 4th grade: 0
- 5th and 6th grade: 4
- 7th and 8th grade: 39
- 9th grade: 10
- 10th grade: 13
- 11th grade: 13
- 12th grade, no diploma: 16
- High school graduate (or equivalency): 120
- Less than 1 year of college: 16
- Some college more than 1 year, no degree: 18
- Associate degree: 7
- Bachelor's degree: 27
- Master's degree: 4
- Professional school degree: 2
- Doctorate degree: 0

Education attainment for females 25 years and older:
- No schooling: 0
- Nursery to 4th grade: 0
- 5th and 6th grade: 0
- 7th and 8th grade: 18
- 9th grade: 4
- 10th grade: 16
- 11th grade: 0
- 12th grade, no diploma: 2
- High school graduate (or equivalency): 150
- Less than 1 year of college: 19
- Some college more than 1 year, no degree: 33
- Associate degree: 25
- Bachelor's degree: 29
- Master's degree: 12
- Professional school degree: 0
- Doctorate degree: 0


Housing units in structures:
- One, detached: 486
- One, attached: 10
- Two: 4
- 5 to 9: 12
- Mobile homes: 72
- Boats, RVs, vans, etc.: 4
Median worth of mobile homes: $69,660
Housing units lacking complete kitchen facilities: 9.2%

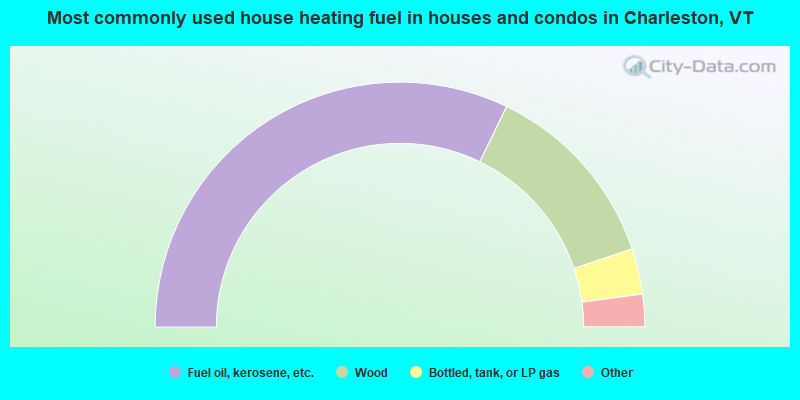
- 64.3%Fuel oil, kerosene, etc.
- 25.3%Wood
- 6.0%Bottled, tank, or LP gas
- 2.7%Electricity
- 1.0%Coal or coke
- 0.7%Other fuel
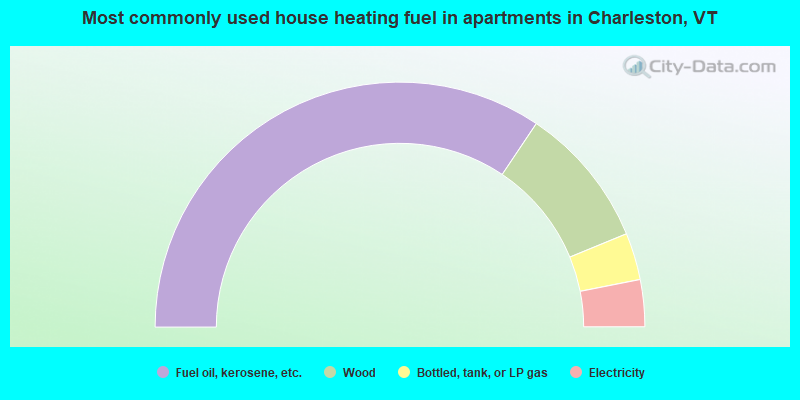
- 68.8%Fuel oil, kerosene, etc.
- 18.8%Wood
- 6.2%Bottled, tank, or LP gas
- 6.2%Electricity
Private vs. public school enrollment:
| Here: | 4.7% |
| Vermont: | 7.2% |
| Here: | 13.8% |
| Vermont: | 10.4% |
| Here: | 0.0% |
| Vermont: | 37.7% |


