Charlotte, TN (Tennessee) Houses and Residents
| Charlotte: | $239,890 |
| Tennessee: | $284,800 |
Mean price in 2022:
Detached houses: $265,961
Here: $265,961 State: $374,382 Mobile homes: $144,920
Here: $144,920 State: $101,421
Total population: 1,494 (Urban population: 0, Rural population: 1,200 (6 farm, 1,194 nonfarm))
Houses: 720 (597 occupied: 496 owner occupied, 112 renter occupied)
| % of renters here: | 18% |
| State: | 33% |
Housing density: 413 houses/condos per square mile
Median price asked for vacant for-sale houses and condos in 2022 in this county: $194,059.
Median contract rent in 2022: $692 (lower quartile is $634, upper quartile is $739)
Median rent asked for vacant for-rent units in 2022: $486
Median gross rent in Charlotte, TN in 2022: $873
Housing units in Charlotte with a mortgage: 285 (22 second mortgage, 0 home equity loan, 22 both second mortgage and home equity loan)
Houses without a mortgage: 17
Median household income for houses/condos with a mortgage: $83,003
Median household income for apartments without a mortgage: $56,759
Median monthly housing costs: $869
Compare current foreclosures near Charlotte, TN:
| Photo | Address | Area | Beds / Baths | Price | Details |
|---|---|---|---|---|---|

|
#1
Waters Street
Charlotte, TN 37036
|
1,248 sq. feet
|
2 baths - beds |
show details | |

|
#2
Water St
Charlotte, TN 37036
|
1,248 sq. feet
|
2 baths - beds |
show details | |

|
#3
Hooper Rd
Charlotte, TN 37036
|
1,188 sq. feet
|
2 baths - beds |
show details | |

|
#4
Highway 49 E
Charlotte, TN 37036
|
1,728 sq. feet
|
2 baths - beds |
show details | |

|
#5
Promise Land Rd
Charlotte, TN 37036
|
1,680 sq. feet
|
2 baths - beds |
show details | |

|
#6
Saint James St
Charlotte, TN 37036
|
1,440 sq. feet
|
1 baths - beds |
show details | |

|
#7
Hayshed Rd
Charlotte, TN 37036
|
- sq. feet
|
- baths - beds |
show details | |

|
#8
Stage Rd
Charlotte, TN 37036
|
1,216 sq. feet
|
- baths - beds |
show details | |

|
#9
Coaling Rd
Charlotte, TN 37036
|
- sq. feet
|
- baths - beds |
show details | |

|
#10
Highway 49 E
Charlotte, TN 37036
|
- sq. feet
|
- baths - beds |
show details |
| Photo | Address | Area | Beds / Baths | Price | Details |
|---|---|---|---|---|---|

|
#11
Highway 49 E
Charlotte, TN 37036
|
- sq. feet
|
- baths - beds |
show details | |

|
#12
Highway 48 N
Charlotte, TN 37036
|
- sq. feet
|
- baths - beds |
show details | |

|
#13
Holland Ct
Bon Aqua, TN 37025
|
2,016 sq. feet
|
3 baths 4 beds |
$109,200
|
show details |

|
#14
Highway 49 E
Charlotte, TN 37036
|
- sq. feet
|
- baths - beds |
show details | |

|
#15
Red Fox Dr
Burns, TN 37029
|
1,721 sq. feet
|
2 baths 3 beds |
show details | |

|
#16
Baggett Ln
Dickson, TN 37055
|
1,754 sq. feet
|
2 baths 3 beds |
show details | |

|
#17
Beech Hill Rd
Pegram, TN 37143
|
1,564 sq. feet
|
3 baths 3 beds |
show details | |

|
#18
Ccc Rd
Mc Ewen, TN 37101
|
2,010 sq. feet
|
1 baths 4 beds |
show details | |

|
#19
Shoulder Strap Branch Ln
Vanleer, TN 37181
|
1,568 sq. feet
|
2 baths 3 beds |
show details | |

|
#20
Stephen St
Dickson, TN 37055
|
- sq. feet
|
2 baths - beds |
show details |
| Photo | Address | Area | Beds / Baths | Price | Details |
|---|---|---|---|---|---|

|
#21
Poplar Ridge Rd
Chapmansboro, TN 37035
|
1,680 sq. feet
|
2 baths - beds |
show details | |

|
#22
Grays Chapel Rd
Southside, TN 37171
|
1,374 sq. feet
|
2 baths - beds |
show details | |

|
#23
Lonesome Pine Rd
Kingston Springs, TN 37082
|
2,100 sq. feet
|
2 baths - beds |
show details | |

|
#24
N Hurricane Creek Rd
Mc Ewen, TN 37101
|
2,048 sq. feet
|
2 baths - beds |
show details | |

|
#25
Manley Loop
Dickson, TN 37055
|
1,866 sq. feet
|
2 baths - beds |
show details | |

|
#26
Lonesome Pine Rd
Kingston Springs, TN 37082
|
2,001 sq. feet
|
2 baths - beds |
show details | |

|
#27
Primm Rd
Ashland City, TN 37015
|
2,508 sq. feet
|
1 baths - beds |
show details | |

|
#28
Marty Ln
White Bluff, TN 37187
|
1,660 sq. feet
|
2 baths - beds |
show details | |

|
#29
Old White Bluff Rd
Burns, TN 37029
|
1,176 sq. feet
|
1 baths - beds |
show details | |

|
#30
Eno Rd
Dickson, TN 37055
|
892 sq. feet
|
1 baths - beds |
show details |
| Photo | Address | Area | Beds / Baths | Price | Details |
|---|---|---|---|---|---|

|
#31
Slayden Marion Rd
Cumberland Furnace, TN 37051
|
1,475 sq. feet
|
1 baths - beds |
show details | |

|
#32
Stoney Point Rd
Vanleer, TN 37181
|
1,877 sq. feet
|
2 baths - beds |
show details | |

|
#33
Black Rd
Dickson, TN 37055
|
1,850 sq. feet
|
2 baths - beds |
show details | |

|
#34
Robin Hood Rd
Dickson, TN 37055
|
2,242 sq. feet
|
2 baths - beds |
show details | |

|
#35
Bradley Dozier Rd
Ashland City, TN 37015
|
1,200 sq. feet
|
1 baths - beds |
show details | |

|
#36
Twin Pine Rd
Dickson, TN 37055
|
1,837 sq. feet
|
2 baths - beds |
show details | |

|
#37
Blakemore Rd
Dickson, TN 37055
|
1,928 sq. feet
|
2 baths - beds |
show details | |

|
#38
Carriage Way
White Bluff, TN 37187
|
1,338 sq. feet
|
2 baths - beds |
show details | |

|
#39
Dennie Bybee Blvd
White Bluff, TN 37187
|
2,464 sq. feet
|
2 baths - beds |
show details | |

|
#40
Spencer Mill Rd
Burns, TN 37029
|
2,358 sq. feet
|
2 baths - beds |
show details |
| Photo | Address | Area | Beds / Baths | Price | Details |
|---|---|---|---|---|---|

|
#41
Highway 13
Cunningham, TN 37052
|
1,220 sq. feet
|
1 baths - beds |
show details | |

|
#42
S Hinton Rd
Southside, TN 37171
|
960 sq. feet
|
1 baths - beds |
show details | |

|
#43
Mosley Ferry Rd
Ashland City, TN 37015
|
1,332 sq. feet
|
1 baths - beds |
show details | |

|
#44
Rye St
Mc Ewen, TN 37101
|
1,175 sq. feet
|
1 baths - beds |
show details | |

|
#45
N Vine St
Ashland City, TN 37015
|
980 sq. feet
|
1 baths - beds |
show details | |

|
#46
Valley Rd
Mc Ewen, TN 37101
|
1,104 sq. feet
|
2 baths - beds |
show details | |

|
#47
Leo Baker Rd
Ashland City, TN 37015
|
2,052 sq. feet
|
2 baths - beds |
show details | |

|
#48
Beth St
Mc Ewen, TN 37101
|
1,334 sq. feet
|
2 baths - beds |
show details | |

|
#49
Lock B Rd S
Clarksville, TN 37040
|
2,880 sq. feet
|
1 baths - beds |
show details | |

|
Check over 1 million property listings on Foreclosure.com!
|
browse all offers | |||

Latest news about housing in Charlotte, TN collected exclusively by city-data.com from local newspapers, TV, and radio stations


Median year apartment built: 1976
Household type by relationship:
Households: 2,033- Male householders: 281 (81 living alone), Female householders: 309 (87 living alone)
341 spouses (341 opposite-sex spouses), 39 unmarried partners, (39 opposite-sex unmarried partners), 486 children (474 natural, 0 adopted, 12 stepchildren), 139 grandchildren, 38 brothers or sisters, 10 parents, 28 foster children, 66 other relatives, 30 non-relatives
- In group quarters: 261
Size of family households: 184 2-persons, 63 3-persons, 80 4-persons, 34 5-persons, 16 6-persons, 24 7-or-more-persons.
Size of nonfamily households: 172 1-person, 33 2-persons.
291 married couples with children.
77 single-parent households (18 men, 59 women).
97.2% of residents of Charlotte speak English at home.
1.9% of residents speak Spanish at home (31% speak English very well, 40% speak English well, 11% speak English not well, 17% don't speak English at all).
0.2% of residents speak other Indo-European language at home (100% speak English very well).
Foreign born population: 20 (1.0%)
(0.0% of them are naturalized citizens)
| Here: | 6.3 |
| State: | 6.5 |
| Here: | 4.7 |
| State: | 4.4 |

- Bedrooms in owner-occupied houses and condos in Charlotte, Tennessee
- 0no bedroom
- 01 bedroom
- 992 bedrooms
- 2633 bedrooms
- 894 bedrooms
- 455+ bedrooms

- Bedrooms in renter-occupied apartments in Charlotte, Tennessee
- 0no bedroom
- 151 bedroom
- 542 bedrooms
- 333 bedrooms
- 124 bedrooms
- 05+ bedrooms

- Cars and other vehicles available in Charlotte in owner-occupied houses/condos
- 10no vehicle
- 1061 vehicle
- 1752 vehicles
- 813 vehicles
- 454 vehicles
- 795+ vehicles

- Cars and other vehicles available in Charlotte in renter-occupied apartments
- 5no vehicle
- 621 vehicle
- 412 vehicles
- 43 vehicles
- 04 vehicles
- 05+ vehicles

- Rooms in owner-occupied houses in Charlotte, Tennessee
- 01 room
- 02 rooms
- 33 rooms
- 214 rooms
- 1525 rooms
- 886 rooms
- 937 rooms
- 678 rooms
- 719+ rooms

- Rooms in renter-occupied apartments in Charlotte, Tennessee
- 01 room
- 02 rooms
- 283 rooms
- 174 rooms
- 395 rooms
- 86 rooms
- 107 rooms
- 98 rooms
- 09+ rooms


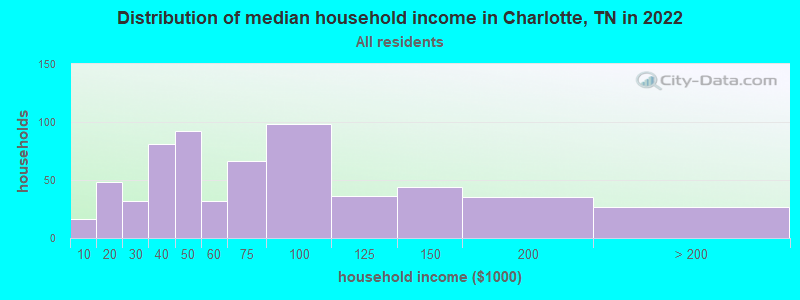
Charlotte, TN household income distribution

- 16Less than $10,000
- 48$10,000 to $19,999
- 32$20,000 to $29,999
- 81$30,000 to $39,999
- 92$40,000 to $49,999
- 32$50,000 to $59,999
- 66$60,000 to $74,999
- 98$75,000 to $99,999
- 36$100,000 to $124,999
- 44$125,000 to $149,999
- 35$150,000 to $199,999
- 27$200,000 or more
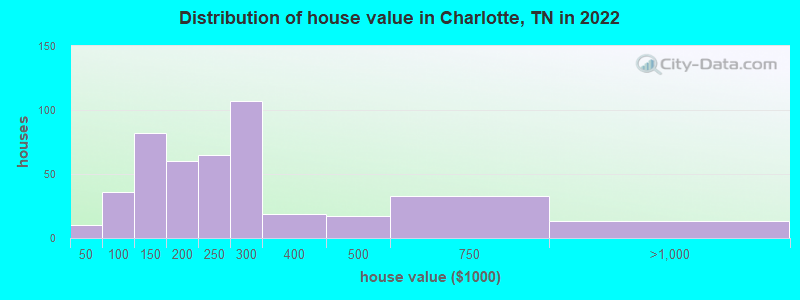
Home value of owner - occupied houses in 2022 in Charlotte, TN
-
- 5$10,000 to $14,999
- 3$20,000 to $24,999
- 10$70,000 to $79,999
- 6$80,000 to $89,999
- 18$90,000 to $99,999
- 62$100,000 to $124,999
- 19$125,000 to $149,999
- 26$150,000 to $174,999
- 33$175,000 to $199,999
- 65$200,000 to $249,999
- 107$250,000 to $299,999
- 18$300,000 to $399,999
- 16$400,000 to $499,999
- 32$500,000 to $749,999
- 12$750,000 to $999,999
Rent paid by renters in 2022 in Charlotte, TN
-
- 5$350 to $399
- 3$400 to $449
- 11$500 to $549
- 23$600 to $649
- 25$650 to $699
- 8$700 to $749
- 4$900 to $999
- 3$1,000 to $1,249
- 24No cash rent

Percentage of workers working in this county: 53.5%
Number of people working at home: 69 (10.0% of all workers)
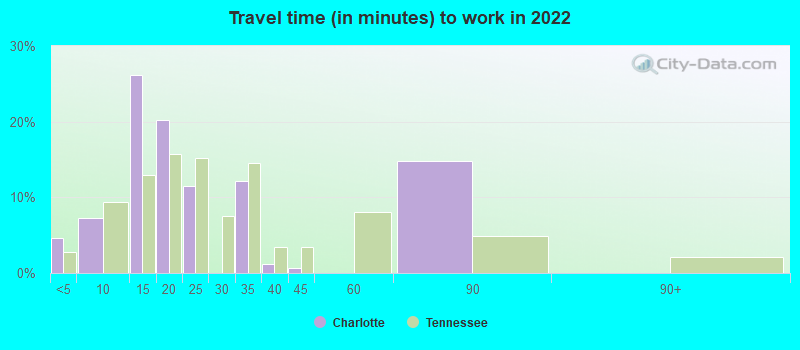
Travel time to work (commute)
- Less than 5 minutes: 12
- 5 to 9 minutes: 23
- 10 to 14 minutes: 46
- 15 to 19 minutes: 94
- 20 to 24 minutes: 134
- 25 to 29 minutes: 21
- 30 to 34 minutes: 47
- 35 to 39 minutes: 10
- 40 to 44 minutes: 0
- 45 to 59 minutes: 66
- 60 to 89 minutes: 130
- 90 or more minutes: 22
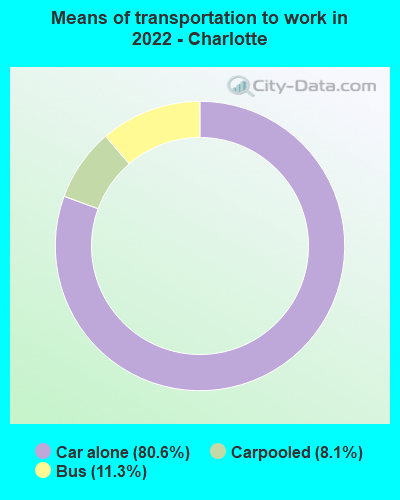
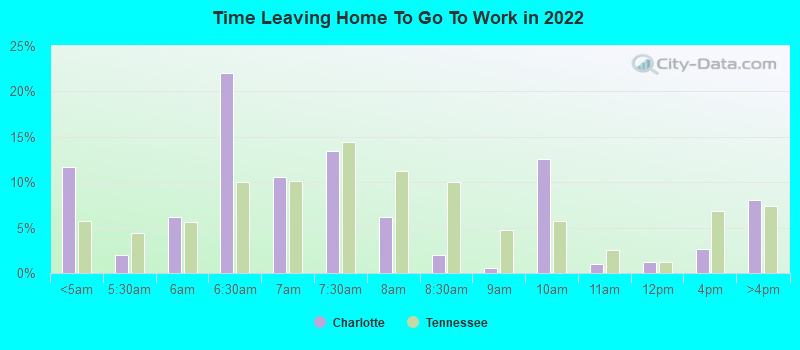
Means of transportation to work:
- Drove a car alone: 682 (72.6%)
- Carpooled: 72 (7.7%)
- Bus: 82 (8.7%)
- Worked at home: 69 (7.3%)
- Unemployment by race in 2022
- Unemployment rate for White non-Hispanic residents
- 4.3%Males
- 2.7%Females

- Year of entry for the foreign-born population in Charlotte, Tennessee
- 02010 or later
- 132000 to 2009
- 01990 to 1999
- 01980 to 1989
- 01970 to 1979
- 0Before 1970
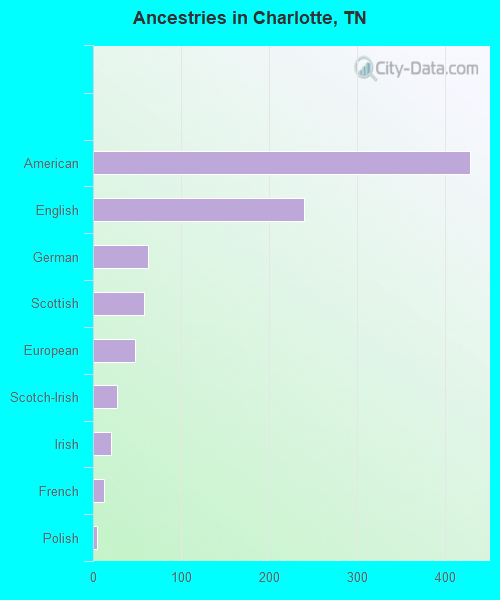
First ancestries reported:
- American: 429 (38.7%)
- English: 240 (21.7%)
- German: 63 (5.7%)
- Scottish: 58 (5.2%)
- European: 48 (4.3%)
- Scotch-Irish: 27 (2.4%)
- Irish: 21 (1.9%)
- French: 13 (1.2%)
- Polish: 5 (0.5%)
- British: 2 (0.2%)
- African: 1 (0.09%)
Most common places of birth for foreign-born residents (%):
| Charlotte: | 85.0% (17) |
| Tennessee: | 23.0% (86,435) |
Place of birth for U.S.-born residents:
- This state: 1,459
- Other state: 533
- Northeast: 15
- Midwest: 93
- South: 243
- West: 190
86.4% of Charlotte residents lived in the same house 1 years ago.
Out of people who lived in different houses, 29.8% lived in this county.
Out of people who lived in different counties, 70.1% lived in Tennessee.
| Charlotte: | 86.4% |
| State average: | 87.0% |
Education attainment for males 25 years and older:
- No schooling: 3
- Nursery to 4th grade: 12
- 5th and 6th grade: 0
- 7th and 8th grade: 38
- 9th grade: 3
- 10th grade: 6
- 11th grade: 34
- 12th grade, no diploma: 12
- High school graduate (or equivalency): 278
- Less than 1 year of college: 79
- Some college more than 1 year, no degree: 100
- Associate degree: 27
- Bachelor's degree: 56
- Master's degree: 36
- Professional school degree: 0
- Doctorate degree: 0

Education attainment for females 25 years and older:
- No schooling: 2
- Nursery to 4th grade: 0
- 5th and 6th grade: 3
- 7th and 8th grade: 27
- 9th grade: 12
- 10th grade: 20
- 11th grade: 21
- 12th grade, no diploma: 10
- High school graduate (or equivalency): 226
- Less than 1 year of college: 55
- Some college more than 1 year, no degree: 81
- Associate degree: 56
- Bachelor's degree: 60
- Master's degree: 24
- Professional school degree: 0
- Doctorate degree: 0


Housing units in structures:
- One, detached: 558
- Two: 8
- 3 or 4: 12
- 5 to 9: 25
- 20 to 49: 14
- Mobile homes: 101
Median worth of mobile homes: $129,644
Housing units lacking complete kitchen facilities in 2022: 3.7%
House/condo owner moved in on average 15 years ago
Renter moved in on average 5 years ago

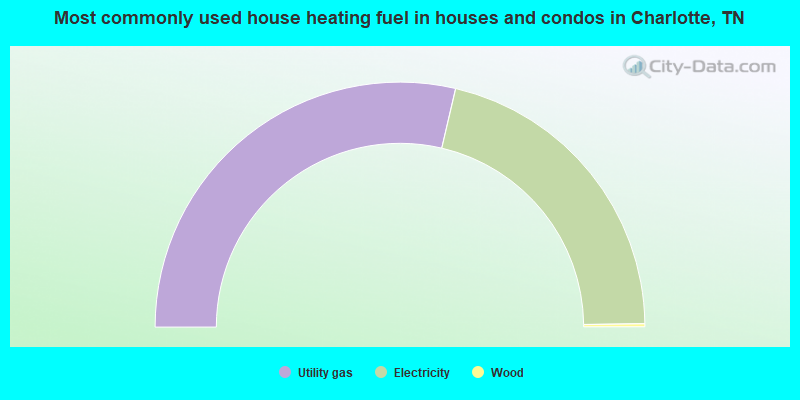
- 57.3%Utility gas
- 42.3%Electricity
- 0.4%Wood
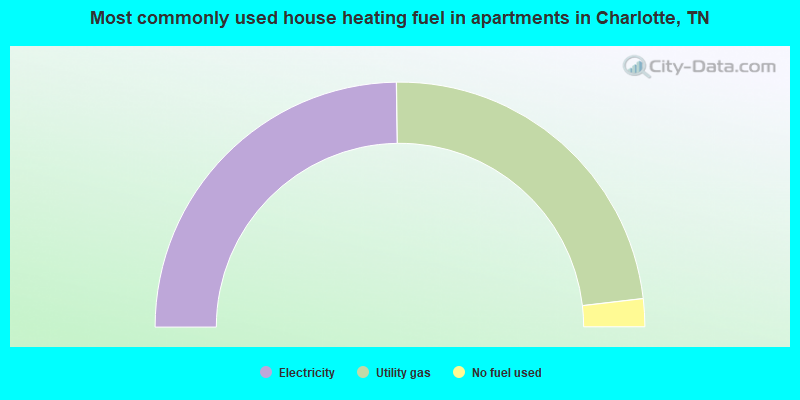
- 49.5%Electricity
- 46.7%Utility gas
- 3.7%No fuel used
Private vs. public school enrollment:
| Here: | 5.2% |
| Tennessee: | 15.0% |
| Here: | 2.6% |
| Tennessee: | 16.2% |
| Here: | 15.0% |
| Tennessee: | 23.5% |


