Charlottesville, VA (Virginia) Houses and Residents
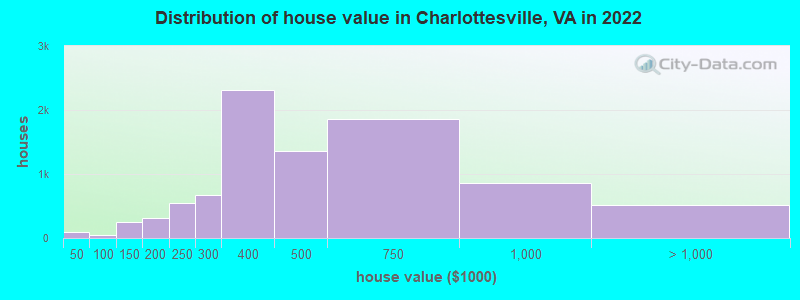
Estimated median house or condo value in 2022: $428,767 (it was $117,800 in 2000 )
Charlottesville:
$428,767Virginia:
$365,700
Lower value quartile - upper value quartile: $323,713 - $659,604Total population: 45,593 (Urban population: 45,049, Rural population: 0)
Houses: 21,779 (19,833 occupied: 8,490 owner occupied, 11,559 renter occupied )
% of renters here:
58%State:
33%
Housing density: 2,122 houses/condos per square mile
Median price asked for vacant for-sale houses and condos in 2022: $629,474.
Median contract rent in 2022: $1,193 (lower quartile is $906, upper quartile is $1,703)
Median rent asked for vacant for-rent units in 2022: $1,602
Median gross rent in Charlottesville, VA in 2022: $1,357
Housing units in Charlottesville with a mortgage: 5,688 (458 second mortgage, 10 home equity loan, 358 both second mortgage and home equity loan )Houses without a mortgage: 109
Median household income for houses/condos with a mortgage: $122,241
Median household income for apartments without a mortgage: $106,020
Median monthly housing costs: $1,379
Data:
Median house or condo value ($)
Median house or condo value ($ change since 2000)
Median house or condo value ($) - White
Median house or condo value ($) - Black or African American
Median house or condo value ($) - Asian
Median house or condo value ($) - Hispanic or Latino
Median house or condo value ($) - American Indian and Alaska Native
Median house or condo value ($) - Multirace
Median house or condo value ($) - Other Race
Median price asked for mobile homes ($)
Household density (households per square mile)
Mean house or condo value by units in structure - 1, detached ($)
Mean house or condo value by units in structure - 1, attached ($)
Mean house or condo value by units in structure - 2 ($)
Mean house or condo value by units in structure by units in structure - 3 or 4 ($)
Mean house or condo value by units in structure - 5 or more ($)
Mean house or condo value by units in structure - Boat, RV, van, etc. ($)
Mean house or condo value by units in structure - Mobile home ($)
Median contract rent ($)
Median contract rent - Lower quartile ($)
Median contract rent - Upper quartile ($)
Median gross rent ($)
Urban houses (%)
Rural houses (%)
Houses occupied (%)
Houses occupied (% change since 2000)
Houses owner occupied (%)
Houses owner occupied (% change since 2000)
Houses renter occupied (%)
Houses renter occupied (% change since 2000)
Vacant housing units - For rent (%)
Vacant housing units - For rent (% change since 2000)
Vacant housing units - For sale only (%)
Vacant housing units - For sale only (% change since 2000)
Vacant housing units - Rented or sold, not occupied (%)
Vacant housing units - Rented or sold, not occupied (% change since 2000)
Vacant housing units - For seasonal, recreational, or occasional use (%)
Vacant housing units - For seasonal, recreational, or occasional use (% change since 2000)
Vacant housing units - For migrant workers (%)
Vacant housing units - For migrant workers (% change since 2000)
Vacant housing units - Other vacant (%)
Vacant housing units - Other vacant (% change since 2000)
Median monthly housing costs ($)
Median household income for houses/condos with a mortgage ($)
Median household income for houses/condos without a mortgage ($)
Median household income ($)
Median household income ($) - White
Median household income ($) - Black or African American
Median household income ($) - Asian
Median household income ($) - Hispanic or Latino
Median household income ($) - American Indian and Alaska Native
Median household income ($) - Multirace
Median household income ($) - Other Race
Mortgage status - with mortgage (%)
Mortgage status - with second mortgage (%)
Mortgage status - with home equity loan (%)
Mortgage status - with both second mortgage and home equity loan (%)
Mortgage status - without a mortgage (%)
Median year house/condo built
Median year apartment built
Household type by relationship - Male householder living alone (%)
Household type by relationship - Male householder not living alone (%)
Household type by relationship - Female householder living alone (%)
Household type by relationship - Female householder not living alone (%)
Household type by relationship - Opposite-Sex spouse (%)
Household type by relationship - Same-Sex spouse (%)
Household type by relationship - Opposite-Sex unmarried partner (%)
Household type by relationship - Same-Sex unmarried partner (%)
Household type by relationship - In group quarters (%)
Size of family households - 2-person household (%)
Size of family households - 3-person household (%)
Size of family households - 4-person household (%)
Size of family households - 5-person household (%)
Size of family households - 6-person household (%)
Size of family households - 7-or-more-person household (%)
Size of nonfamily households - 1-person household (%)
Size of nonfamily households - 2-person household (%)
Size of nonfamily households - 3-person household (%)
Size of nonfamily households - 4-person household (%)
Size of nonfamily households - 5-person household (%)
Size of nonfamily households - 6-person household (%)
Size of nonfamily households - 7-or-moreperson household (%)
Year house built - Built 2010 or later (%)
Year house built - Built 2000 to 2009 (%)
Year house built - Built 1990 to 1999 (%)
Year house built - Built 1980 to 1989 (%)
Year house built - Built 1970 to 1979 (%)
Year house built - Built 1960 to 1969 (%)
Year house built - Built 1950 to 1959 (%)
Year house built - Built 1940 to 1949 (%)
Year house built - Built 1939 or earlier (%)
Median number of rooms in houses and condos
Median number of rooms in apartments
Median number of bedrooms in owner occupied houses
Mean number of bedrooms in owner occupied houses
Median number of bedrooms in renter occupied houses
Mean number of bedrooms in renter occupied houses
Median number of vehichles in owner occupied houses
Mean number of vehichles in owner occupied houses
Median number of vehichles in renter occupied houses
Mean number of vehichles in renter occupied houses
Rooms in owner-occupied houses - 1 room (%)
Rooms in owner-occupied houses - 2 rooms (%)
Rooms in owner-occupied houses - 3 rooms (%)
Rooms in owner-occupied houses - 4 rooms (%)
Rooms in owner-occupied houses - 5 rooms (%)
Rooms in owner-occupied houses - 6 rooms (%)
Rooms in owner-occupied houses - 7 rooms (%)
Rooms in owner-occupied houses - 8 rooms (%)
Rooms in owner-occupied houses - 9+ rooms (%)
Rooms in renter-occupied houses - 1 room (%)
Rooms in renter-occupied houses - 2 rooms (%)
Rooms in renter-occupied houses - 3 rooms (%)
Rooms in renter-occupied houses - 4 rooms (%)
Rooms in renter-occupied houses - 5 rooms (%)
Rooms in renter-occupied houses - 6 rooms (%)
Rooms in renter-occupied houses - 7 rooms (%)
Rooms in renter-occupied houses - 8 rooms (%)
Rooms in renter-occupied houses - 9+ rooms (%)
Bedrooms in owner-occupied houses - no bedrooms (%)
Bedrooms in owner-occupied houses - 1 bedroom (%)
Bedrooms in owner-occupied houses - 2 bedrooms (%)
Bedrooms in owner-occupied houses - 3 bedrooms (%)
Bedrooms in owner-occupied houses - 4 bedrooms (%)
Bedrooms in owner-occupied houses - 5+ bedrooms (%)
Bedrooms in renter-occupied houses - no bedrooms (%)
Bedrooms in renter-occupied houses - 1 bedroom (%)
Bedrooms in renter-occupied houses - 2 bedrooms (%)
Bedrooms in renter-occupied houses - 3 bedrooms (%)
Bedrooms in renter-occupied houses - 4 bedrooms (%)
Bedrooms in renter-occupied houses - 5+ bedrooms (%)
Vehicles available in owner-occupied houses - no vehicle available (%)
Vehicles available in owner-occupied houses - 1 vehicle available(%)
Vehicles available in owner-occupied houses - 2 Vehicles available (%)
Vehicles available in owner-occupied houses - 3 Vehicles available (%)
Vehicles available in owner-occupied houses - 4 Vehicles available (%)
Vehicles available in owner-occupied houses - 5+ Vehicles available (%)
Vehicles available in renter-occupied houses - no vehicle available (%)
Vehicles available in renter-occupied houses - 1 vehicle available (%)
Vehicles available in renter-occupied houses - 2 Vehicles available (%)
Vehicles available in renter-occupied houses - 3 Vehicles available (%)
Vehicles available in renter-occupied houses - 4 Vehicles available (%)
Vehicles available in renter-occupied houses - 5+ Vehicles available (%)
Housing units in structures - 1, detached (%)
Housing units in structures - 1, attached (%)
Housing units in structures - 2 (%)
Housing units in structures - 3 or 4 (%)
Housing units in structures - 5 to 9 (%)
Housing units in structures - 10 to 19 (%)
Housing units in structures - 20 to 49 (%)
Housing units in structures - 50 or more (%)
Housing units in structures - Mobile home (%)
Housing units in structures - Boat, RV, van, etc. (%)
Housing units in structures - Owners - 1, detached (%)
Housing units in structures - Owners - 1, attached (%)
Housing units in structures - Owners - 2 (%)
Housing units in structures - Owners - 3 or 4 (%)
Housing units in structures - Owners - 5 to 9 (%)
Housing units in structures - Owners - 10 to 19 (%)
Housing units in structures - Owners - 20 to 49 (%)
Housing units in structures - Owners - 50 or more (%)
Housing units in structures - Owners - Mobile home (%)
Housing units in structures - Owners - Boat, RV, van, etc. (%)
Housing units in structures - Renters - 1, detached (%)
Housing units in structures - Renters - 1, attached (%)
Housing units in structures - Renters - 2 (%)
Housing units in structures - Renters - 3 or 4 (%)
Housing units in structures - Renters - 5 to 9 (%)
Housing units in structures - Renters - 10 to 19 (%)
Housing units in structures - Renters - 20 to 49 (%)
Housing units in structures - Renters - 50 or more (%)
Housing units in structures - Renters - Mobile home (%)
Housing units in structures - Renters - Boat, RV, van, etc. (%)
House/condo owner moved in on average (years ago)
Renter moved in on average (years ago)
Year householder moved into unit - Moved in 1999 to March 2000 (%)
Year householder moved into unit - Moved in 1999 to March 2000 (%) - White
Year householder moved into unit - Moved in 1999 to March 2000 (%) - Black or African American
Year householder moved into unit - Moved in 1999 to March 2000 (%) - Asian
Year householder moved into unit - Moved in 1999 to March 2000 (%) - Hispanic or Latino
Year householder moved into unit - Moved in 1999 to March 2000 (%) - American Indian and Alaska Native
Year householder moved into unit - Moved in 1999 to March 2000 (%) - Multirace
Year householder moved into unit - Moved in 1999 to March 2000 (%) - Other Race
Year householder moved into unit - Moved in 1995 to 1998 (%)
Year householder moved into unit - Moved in 1995 to 1998 (%) - White
Year householder moved into unit - Moved in 1995 to 1998 (%) - Black or African American
Year householder moved into unit - Moved in 1995 to 1998 (%) - Asian
Year householder moved into unit - Moved in 1995 to 1998 (%) - Hispanic or Latino
Year householder moved into unit - Moved in 1995 to 1998 (%) - American Indian and Alaska Native
Year householder moved into unit - Moved in 1995 to 1998 (%) - Multirace
Year householder moved into unit - Moved in 1995 to 1998 (%) - Other Race
Year householder moved into unit - Moved in 1990 to 1994 (%)
Year householder moved into unit - Moved in 1990 to 1994 (%) - White
Year householder moved into unit - Moved in 1990 to 1994 (%) - Black or African American
Year householder moved into unit - Moved in 1990 to 1994 (%) - Asian
Year householder moved into unit - Moved in 1990 to 1994 (%) - Hispanic or Latino
Year householder moved into unit - Moved in 1990 to 1994 (%) - American Indian and Alaska Native
Year householder moved into unit - Moved in 1990 to 1994 (%) - Multirace
Year householder moved into unit - Moved in 1990 to 1994 (%) - Other Race
Year householder moved into unit - Moved in 1980 to 1989 (%)
Year householder moved into unit - Moved in 1980 to 1989 (%) - White
Year householder moved into unit - Moved in 1980 to 1989 (%) - Black or African American
Year householder moved into unit - Moved in 1980 to 1989 (%) - Asian
Year householder moved into unit - Moved in 1980 to 1989 (%) - Hispanic or Latino
Year householder moved into unit - Moved in 1980 to 1989 (%) - American Indian and Alaska Native
Year householder moved into unit - Moved in 1980 to 1989 (%) - Multirace
Year householder moved into unit - Moved in 1980 to 1989 (%) - Other Race
Year householder moved into unit - Moved in 1970 to 1979 (%)
Year householder moved into unit - Moved in 1970 to 1979 (%) - White
Year householder moved into unit - Moved in 1970 to 1979 (%) - Black or African American
Year householder moved into unit - Moved in 1970 to 1979 (%) - Asian
Year householder moved into unit - Moved in 1970 to 1979 (%) - Hispanic or Latino
Year householder moved into unit - Moved in 1970 to 1979 (%) - American Indian and Alaska Native
Year householder moved into unit - Moved in 1970 to 1979 (%) - Multirace
Year householder moved into unit - Moved in 1970 to 1979 (%) - Other Race
Year householder moved into unit - Moved in 1969 or earlier (%)
Year householder moved into unit - Moved in 1969 or earlier (%) - White
Year householder moved into unit - Moved in 1969 or earlier (%) - Black or African American
Year householder moved into unit - Moved in 1969 or earlier (%) - Asian
Year householder moved into unit - Moved in 1969 or earlier (%) - Hispanic or Latino
Year householder moved into unit - Moved in 1969 or earlier (%) - American Indian and Alaska Native
Year householder moved into unit - Moved in 1969 or earlier (%) - Multirace
Year householder moved into unit - Moved in 1969 or earlier (%) - Other Race
Housing units lacking complete plumbing facilities (%)
Housing units lacking complete kitchen facilities (%)
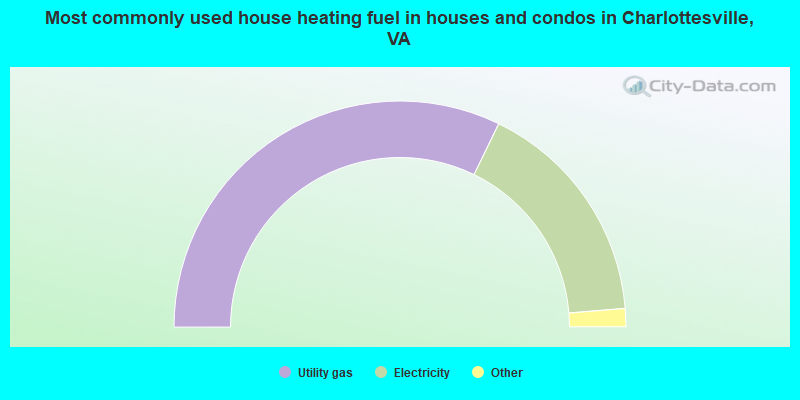
House heating fuel used in houses and condos - Utility gas (%)
House heating fuel used in houses and condos - Bottled, tank, or LP gas (%)
House heating fuel used in houses and condos - Electricity (%)
House heating fuel used in houses and condos - Fuel oil, kerosene, etc. (%)
House heating fuel used in houses and condos - Coal or coke (%)
House heating fuel used in houses and condos - Wood (%)
House heating fuel used in houses and condos - Solar energy (%)
House heating fuel used in houses and condos - Other fuel (%)
House heating fuel used in houses and condos - No fuel used (%)
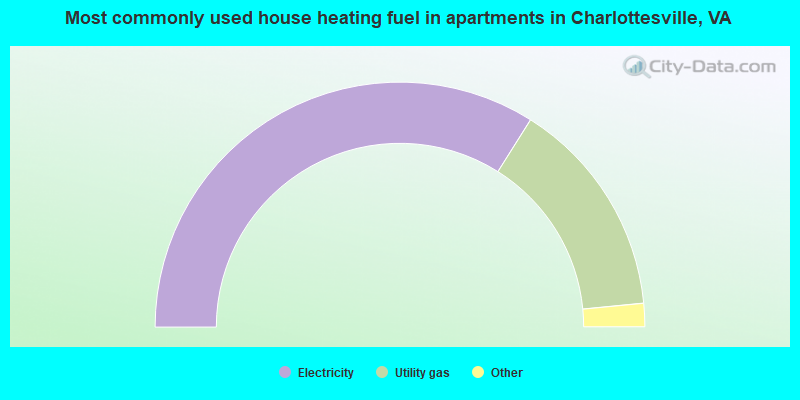
House heating fuel used in apartments - Utility gas (%)
House heating fuel used in apartments - Bottled, tank, or LP gas (%)
House heating fuel used in apartments - Electricity (%)
House heating fuel used in apartments - Fuel oil, kerosene, etc. (%)
House heating fuel used in apartments - Coal or coke (%)
House heating fuel used in apartments - Wood (%)
House heating fuel used in apartments - Solar energy (%)
House heating fuel used in apartments - Other fuel (%)
House heating fuel used in apartments - No fuel used (%)
Latest news about housing in Charlottesville, VA collected exclusively by city-data.com from local newspapers, TV, and radio stations
Median year house/condo built: 1962Median year apartment built: 1977Household type by relationship:
Households: 46,606
Male householders: 8,881 (3,132 living alone ), Female householders: 10,763 (4,290 living alone )6,211 spouses (6,122 opposite-sex spouses ), 1,415 unmarried partners , (1,382 opposite-sex unmarried partners ), 8,516 children (8,132 natural , 159 adopted , 225 stepchildren ), 625 grandchildren , 483 brothers or sisters , 340 parents , 19 foster children , 516 other relatives , 5,878 non-relatives In group quarters: 2,955
Size of family households: 4,382 2-persons , 2,054 3-persons , 1,629 4-persons , 525 5-persons , 314 6-persons , 84 7-or-more-persons .
Size of nonfamily households: 7,636 1-person , 2,176 2-persons , 686 3-persons , 473 4-persons , 59 5-persons , 27 6-persons , 80 7-or-more-persons .
3,861 married couples with children. single-parent households (575 men , 2,156 women ).
85.7% of residents of Charlottesville speak English at home. of residents speak Spanish at home (72% speak English very well , 11% speak English well , 12% speak English not well , 5% don't speak English at all ).of residents speak other Indo-European language at home (84% speak English very well , 10% speak English well , 6% speak English not well ).of residents speak Asian or Pacific Island language at home (71% speak English very well , 18% speak English well , 8% speak English not well , 3% don't speak English at all ).of residents speak other language at home (57% speak English very well , 10% speak English well , 18% speak English not well , 16% don't speak English at all ).
Foreign born population: 4,686 (10.1%)of them are naturalized citizens )
Median number of rooms in houses and condos:
Median number of rooms in apartments
Owner-occupied Renter-occupied
Rooms in owner-occupied houses in Charlottesville, Virginia
9 1 room 13 2 rooms 229 3 rooms 565 4 rooms 952 5 rooms 1,851 6 rooms 1,541 7 rooms 1,588 8 rooms 1,742 9+ rooms
Rooms in renter-occupied apartments in Charlottesville, Virginia
460 1 room 891 2 rooms 2,614 3 rooms 2,651 4 rooms 2,315 5 rooms 1,141 6 rooms 630 7 rooms 408 8 rooms 449 9+ rooms
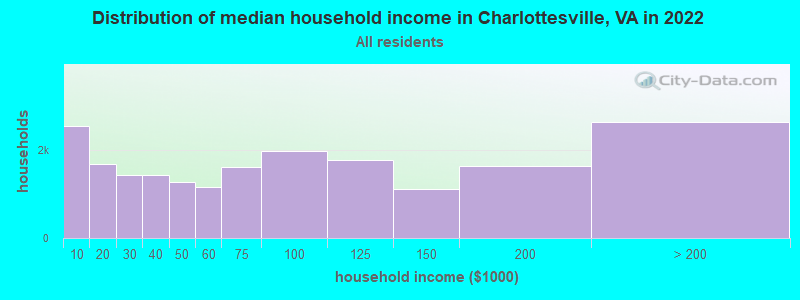
Charlottesville, VA household income distribution 2,541 Less than $10,0001,691 $10,000 to $19,9991,438 $20,000 to $29,9991,428 $30,000 to $39,9991,283 $40,000 to $49,9991,159 $50,000 to $59,9991,620 $60,000 to $74,9991,991 $75,000 to $99,9991,778 $100,000 to $124,9991,105 $125,000 to $149,9991,629 $150,000 to $199,9992,642 $200,000 or more
Home value of owner - occupied houses in 2022 in Charlottesville, VA 36 Less than $10,0006 $10,000 to $14,9994 $20,000 to $24,9998 $25,000 to $29,99910 $35,000 to $39,99919 $40,000 to $49,99911 $70,000 to $79,9998 $80,000 to $89,9999 $90,000 to $99,99984 $100,000 to $124,999172 $125,000 to $149,999170 $150,000 to $174,999139 $175,000 to $199,999542 $200,000 to $249,999677 $250,000 to $299,9992,318 $300,000 to $399,9991,366 $400,000 to $499,9991,865 $500,000 to $749,999865 $750,000 to $999,999212 $1,000,000 to $1,499,999207 $1,500,000 to $1,999,99989 $2,000,000 or moreRent paid by renters in 2022 in Charlottesville, VA 106 Less than $10096 $100 to $14986 $150 to $199137 $200 to $24979 $250 to $299163 $300 to $34974 $350 to $399145 $400 to $44939 $450 to $499132 $500 to $549149 $550 to $599145 $600 to $64967 $650 to $699196 $700 to $749266 $750 to $799840 $800 to $8991,422 $900 to $9991,814 $1,000 to $1,2491,333 $1,250 to $1,4992,343 $1,500 to $1,999785 $2,000 to $2,499320 $2,500 to $2,999122 $3,000 to $3,499220 $3,500 or more204 No cash rent
Percentage of workers working in this county: 65.6%Number of people working at home: 5,650 (23.5% of all workers )
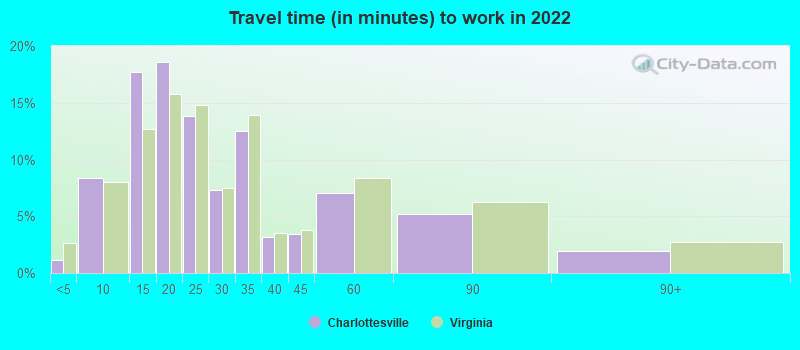
Travel time to work (commute)
Less than 5 minutes: 3785 to 9 minutes: 3,19710 to 14 minutes: 5,48715 to 19 minutes: 4,45520 to 24 minutes: 2,13825 to 29 minutes: 1,02330 to 34 minutes: 99935 to 39 minutes: 17140 to 44 minutes: 32345 to 59 minutes: 37460 to 89 minutes: 36390 or more minutes: 126
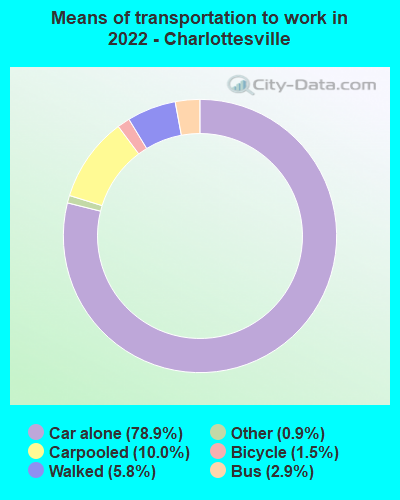
Means of transportation to work:
Drove a car alone: 29,760 (67.7%)Carpooled: 3,830 (8.7%)Bus : 795 (1.8%)Taxi: 410 (0.9%)Bicycle: 556 (1.3%)Walked: 2,341 (5.3%)Worked at home: 5,650 (12.9%)
Unemployment by race in 2022
Unemployment rate for White non-Hispanic residents 3.2% Males3.2% FemalesUnemployment rate for Black residents 4.0% Males11.4% FemalesUnemployment rate for Asian residents 8.6% Males3.5% FemalesUnemployment rate for two or more race residents 5.3% Males1.6% FemalesUnemployment rate for Hispanic or Latino residents 11.0% Males
Year of entry for the foreign-born population in Charlottesville, Virginia
2,408 2010 or later 1,411 2000 to 2009 484 1990 to 1999 849 1980 to 1989 271 1970 to 1979 174 Before 1970
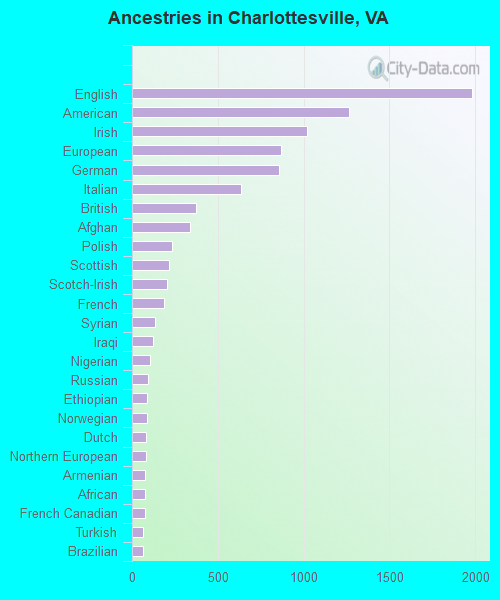
First ancestries reported:
English: 1,982 (8.8%)
American: 1,265 (5.6%)
Irish: 1,022 (4.5%)
European: 866 (3.8%)
German: 855 (3.8%)
Italian: 636 (2.8%)
British: 373 (1.7%)
Afghan: 336 (1.5%)
Polish: 231 (1.0%)
Scottish: 214 (0.9%)
Scotch-Irish: 204 (0.9%)
French: 184 (0.8%)
Syrian: 136 (0.6%)
Iraqi: 125 (0.6%)
Nigerian: 103 (0.5%)
Russian: 92 (0.4%)
Ethiopian: 88 (0.4%)
Norwegian: 88 (0.4%)
Dutch: 80 (0.4%)
Northern European: 79 (0.4%)
Armenian: 78 (0.3%)
African: 76 (0.3%)
French Canadian: 73 (0.3%)
Turkish: 64 (0.3%)
Brazilian: 63 (0.3%)
Greek: 63 (0.3%)
Arab: 61 (0.3%)
Hungarian: 58 (0.3%)
Swedish: 57 (0.3%)
Lebanese: 41 (0.2%)
Eastern European: 40 (0.2%)
Finnish: 38 (0.2%)
Serbian: 38 (0.2%)
Lithuanian: 35 (0.2%)
Iranian: 34 (0.2%)
Liberian: 34 (0.2%)
Jamaican: 31 (0.1%)
Pennsylvania German: 30 (0.1%)
Canadian: 26 (0.1%)
Swiss: 25 (0.1%)
Ukrainian: 22 (0.10%)
Bulgarian: 19 (0.08%)
Welsh: 13 (0.06%)
Egyptian: 10 (0.04%)
Haitian: 10 (0.04%)
Romanian: 7 (0.03%)
Scandinavian: 6 (0.03%)
Czech: 6 (0.03%)
Slovak: 6 (0.03%)
Portuguese: 4 (0.02%)
Most common places of birth for foreign-born residents (%): China, excluding Hong Kong and Taiwan Charlottesville:
14.1% (661)Virginia:
3.9% (42,989)
Afghanistan Charlottesville:
9.7% (455)Virginia:
1.8% (19,426)
Syria Charlottesville:
6.5% (304)Virginia:
0.3% (2,743)
Mexico Charlottesville:
6.4% (302)Virginia:
5.3% (57,498)
India Charlottesville:
5.1% (237)Virginia:
9.0% (97,830)
Canada Charlottesville:
4.4% (207)Virginia:
1.2% (12,984)
Honduras Charlottesville:
3.4% (160)Virginia:
3.0% (32,892)
Iraq Charlottesville:
3.1% (147)Virginia:
0.9% (9,351)
Korea Charlottesville:
3.1% (145)Virginia:
4.9% (52,857)
England Charlottesville:
3.1% (144)Virginia:
0.9% (9,842)
Taiwan Charlottesville:
1.9% (91)Virginia:
0.6% (7,042)
Ethiopia Charlottesville:
1.8% (86)Virginia:
2.9% (32,082)
Liberia Charlottesville:
1.8% (84)Virginia:
0.2% (2,214)
Brazil Charlottesville:
1.7% (79)Virginia:
0.7% (8,081)
United Kingdom, excluding England and Scotland Charlottesville:
1.7% (78)Virginia:
0.8% (8,513)
Place of birth for U.S.-born residents:
This state: 22,361Other state: 18,769Northeast: 6,140Midwest: 3,113South: 7,563West: 1,932 73.1% of Charlottesville residents lived in the same house 1 years ago.
Out of people who lived in different houses, 24.6% lived in this county.
Out of people who lived in different counties, 71.9% lived in Virginia.
Charlottesville:
73.1%State average:
86.6%
Education attainment for males 25 years and older:
No schooling: 262Nursery to 4th grade: 235th and 6th grade: 627th and 8th grade: 549th grade: 10210th grade: 18811th grade: 14812th grade, no diploma: 255High school graduate (or equivalency): 2,344Less than 1 year of college: 449Some college more than 1 year, no degree: 1,369Associate degree: 437Bachelor's degree: 3,942Master's degree: 2,254Professional school degree: 996Doctorate degree: 1,487
Education attainment for females 25 years and older:
No schooling: 312Nursery to 4th grade: 185th and 6th grade: 207th and 8th grade: 1949th grade: 1210th grade: 21311th grade: 28512th grade, no diploma: 180High school graduate (or equivalency): 2,336Less than 1 year of college: 652Some college more than 1 year, no degree: 1,058Associate degree: 1,006Bachelor's degree: 4,562Master's degree: 3,107Professional school degree: 785Doctorate degree: 961
Housing units in structures:
One, detached: 10,024One, attached: 1,874Two: 2,2893 or 4: 9865 to 9: 1,49310 to 19: 1,62520 to 49: 1,54050 or more: 1,743Mobile homes: 203Housing units lacking complete plumbing facilities in 2022: 0.9%Housing units lacking complete kitchen facilities in 2022: 2.2%House/condo owner moved in on average 10 years ago
Renter moved in on average 1 years ago
Private vs. public school enrollment:
Students in private schools in grades 1 to 8 (elementary and middle school): 813 Students in private schools in grades 9 to 12 (high school): 178 Students in private undergraduate colleges: 169