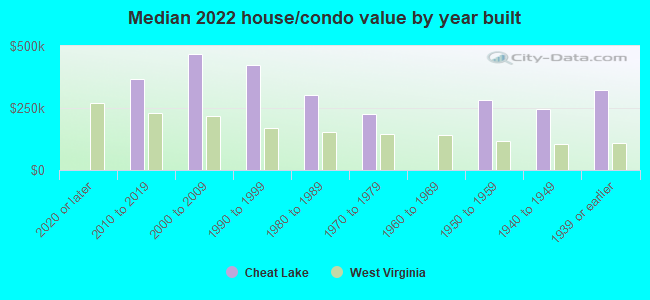
Cheat Lake, WV (West Virginia) Houses and Residents
| Cheat Lake: | $339,981 |
| West Virginia: | $155,100 |
Mean price in 2022:
Detached houses: $472,234
Here: $472,234 State: $206,655 Townhouses or other attached units: $233,283
Here: $233,283 State: $205,683 Mobile homes: $85,576
Here: $85,576 State: $63,963
Total population: 7,988 (Urban population: 5,123, Rural population: 1,234 (all nonfarm))
Houses: 4,442 (4,105 occupied: 3,254 owner occupied, 870 renter occupied)
| % of renters here: | 21% |
| State: | 26% |
Housing density: 308 houses/condos per square mile
Median price asked for vacant for-sale houses and condos in 2022: $719,362.
Median contract rent in 2022: $925 (lower quartile is $727, upper quartile is $1,352)
Median rent asked for vacant for-rent units in 2022: $2,222
Median gross rent in Cheat Lake, WV in 2022: $1,105
Housing units in Cheat Lake with a mortgage: 2,184 (255 second mortgage, 32 home equity loan, 201 both second mortgage and home equity loan)
Houses without a mortgage: 16
Median household income for houses/condos with a mortgage: $130,282
Median household income for apartments without a mortgage: $82,862
Median monthly housing costs: $1,264
Compare current foreclosures near Cheat Lake, WV:
| Photo | Address | Area | Beds / Baths | Price | Details |
|---|---|---|---|---|---|

|
#1
Main St
Uniontown, PA 15401
|
1,137 sq. feet
|
1 baths 3 beds |
$25,000
|
show details |

|
#2
Stevenson St
Ronco, PA 15476
|
- sq. feet
|
2 baths 4 beds |
$16,500
|
show details |

|
#3
A-B Richmond St
Morgantown, WV 26501
|
1,433 sq. feet
|
2 baths 7 beds |
show details | |

|
#4
Single St
Carmichaels, PA 15320
|
1,178 sq. feet
|
1 baths 3 beds |
show details | |

|
#5
Woodstock Ave
Hopwood, PA 15445
|
- sq. feet
|
2 baths 4 beds |
show details | |

|
#6
Indian Rock Rd
Reedsville, WV 26547
|
1,512 sq. feet
|
2 baths 3 beds |
show details | |

|
#7
Herman Ave
Morgantown, WV 26505
|
1,248 sq. feet
|
2 baths 4 beds |
show details | |

|
#8
Old Mcclellandtown Rd
Mc Clellandtown, PA 15458
|
- sq. feet
|
1 baths 3 beds |
show details | |

|
#9
Hutchinson St
Uniontown, PA 15401
|
1,928 sq. feet
|
2 baths 4 beds |
show details | |

|
#10
1st St
Uniontown, PA 15401
|
1,850 sq. feet
|
2 baths 4 beds |
show details |
| Photo | Address | Area | Beds / Baths | Price | Details |
|---|---|---|---|---|---|

|
#11
Pine Knob Rd
Hopwood, PA 15445
|
1,565 sq. feet
|
1 baths 3 beds |
show details | |

|
#12
Sangston Ave
Masontown, PA 15461
|
1,080 sq. feet
|
2 baths 3 beds |
show details | |

|
#13
Maurice St
Uniontown, PA 15401
|
1,620 sq. feet
|
1 baths 3 beds |
show details | |

|
#14
Peaceful Rd
Morgantown, WV 26501
|
1,440 sq. feet
|
2 baths 3 beds |
show details | |

|
#15
Beth Dr
Fairchance, PA 15436
|
1,200 sq. feet
|
2 baths 3 beds |
show details | |

|
#16
S Ross St
Masontown, PA 15461
|
1,288 sq. feet
|
1 baths 3 beds |
show details | |

|
#17
Virginia Ave
Uniontown, PA 15401
|
1,008 sq. feet
|
1 baths 2 beds |
show details | |

|
#18
Gilmore Ave
Masontown, PA 15461
|
1,294 sq. feet
|
2 baths 3 beds |
show details | |

|
#19
Dixon Blvd
Uniontown, PA 15401
|
868 sq. feet
|
1 baths 2 beds |
show details | |

|
#20
High Ave
Masontown, PA 15461
|
1,757 sq. feet
|
2 baths 3 beds |
show details |
| Photo | Address | Area | Beds / Baths | Price | Details |
|---|---|---|---|---|---|

|
#21
S Ross St
Masontown, PA 15461
|
1,524 sq. feet
|
2 baths 5 beds |
show details | |

|
#22
River Ave
Masontown, PA 15461
|
900 sq. feet
|
1 baths 2 beds |
show details | |

|
#23
Post Office Rd
Uniontown, PA 15401
|
1,736 sq. feet
|
1 baths 4 beds |
show details | |

|
#24
Lafayette St
Uniontown, PA 15401
|
1,270 sq. feet
|
2 baths 2 beds |
show details | |

|
#25
Hopwood Coolspring Rd
Hopwood, PA 15445
|
2,024 sq. feet
|
1 baths 4 beds |
show details | |

|
#26
Long St
Mc Clellandtown, PA 15458
|
952 sq. feet
|
1 baths 2 beds |
show details | |

|
#27
Old Mcclellandtown Rd
Mc Clellandtown, PA 15458
|
3,480 sq. feet
|
1 baths 3 beds |
show details | |

|
#28
Bennington Rd
Hopwood, PA 15445
|
1,025 sq. feet
|
1 baths 2 beds |
show details | |

|
#29
Railroad St
Smithfield, PA 15478
|
1,728 sq. feet
|
1 baths 4 beds |
show details | |

|
#30
Messmore Rd
Mc Clellandtown, PA 15458
|
1,179 sq. feet
|
1 baths 2 beds |
show details |
| Photo | Address | Area | Beds / Baths | Price | Details |
|---|---|---|---|---|---|

|
#31
Farm Rd
Uniontown, PA 15401
|
1,344 sq. feet
|
2 baths 3 beds |
show details | |

|
#32
Ball Hill Rd
Adah, PA 15410
|
2,192 sq. feet
|
1 baths 2 beds |
show details | |

|
#33
Hopwood Fairchance Rd
Uniontown, PA 15401
|
902 sq. feet
|
1 baths 2 beds |
show details | |

|
#34
Carnation St
Uniontown, PA 15401
|
993 sq. feet
|
1 baths 2 beds |
show details | |

|
#35
Redstone Furnace Rd
Hopwood, PA 15445
|
1,273 sq. feet
|
1 baths 3 beds |
show details | |

|
#36
Mapletown Rd
Greensboro, PA 15338
|
- sq. feet
|
1 baths 3 beds |
show details | |

|
#37
Jefferson Ave
Masontown, PA 15461
|
1,188 sq. feet
|
1 baths 3 beds |
show details | |

|
#38
Morgantown Rd
Lake Lynn, PA 15451
|
1,316 sq. feet
|
1 baths 2 beds |
show details | |

|
#39
Wisconsin Ave
Morgantown, WV 26501
|
984 sq. feet
|
1 baths 3 beds |
show details | |

|
#40
Cable Ln
Morgantown, WV 26508
|
2,560 sq. feet
|
1 baths 3 beds |
show details |
| Photo | Address | Area | Beds / Baths | Price | Details |
|---|---|---|---|---|---|

|
#41
Cathy Dr
Morgantown, WV 26505
|
1,712 sq. feet
|
1 baths 3 beds |
show details | |

|
#42
Tyrone Rd
Morgantown, WV 26508
|
1,368 sq. feet
|
3 baths 4 beds |
show details | |

|
#43
Cadet Ct
Morgantown, WV 26508
|
2,147 sq. feet
|
2 baths 2 beds |
show details | |

|
#44
Cherry Ln
Morgantown, WV 26505
|
1,744 sq. feet
|
2 baths 4 beds |
show details | |

|
#45
Cupelli St
Point Marion, PA 15474
|
945 sq. feet
|
1 baths 1 beds |
show details | |

|
#46
Gans Rd
Lake Lynn, PA 15451
|
1,900 sq. feet
|
1 baths 3 beds |
show details | |

|
#47
Bethel Rd
Morgantown, WV 26501
|
1,000 sq. feet
|
1 baths 3 beds |
show details | |

|
#48
Summers School Rd
Morgantown, WV 26508
|
1,620 sq. feet
|
1 baths 3 beds |
show details | |

|
#49
Laurel St
Morgantown, WV 26505
|
908 sq. feet
|
1 baths 2 beds |
show details | |

|
Check over 1 million property listings on Foreclosure.com!
|
browse all offers | |||


 | Ideas for visiting Morgantown/Cheat Lake area? (4 replies) |
| WestRidge/UTC/Mall/Gateway Developments (1501 replies) |
| Morgantown Business News (1161 replies) |
| Downtown observations (179 replies) |
| Mylan closure - effect on Real Estate market (11 replies) |
| Morgantown Condo/Townhome/Apartment Utility Costs? (6 replies) |
Median year apartment built: 1984
Household type by relationship:
Households: 10,117- Male householders: 2,087 (458 living alone), Female householders: 2,020 (484 living alone)
2,675 spouses (2,642 opposite-sex spouses), 240 unmarried partners, (240 opposite-sex unmarried partners), 2,606 children (2,441 natural, 40 adopted, 125 stepchildren), 75 grandchildren, 39 brothers or sisters, 60 parents, 0 foster children, 239 other relatives, 68 non-relatives
- In group quarters: 3
Size of family households: 1,381 2-persons, 558 3-persons, 496 4-persons, 275 5-persons, 57 6-persons, 20 7-or-more-persons.
Size of nonfamily households: 1,085 1-person, 218 2-persons.
1,803 married couples with children.
223 single-parent households (110 men, 113 women).
96.0% of residents of Cheat Lake speak English at home.
1.8% of residents speak Spanish at home (80% speak English very well, 20% speak English well).
0.8% of residents speak other Indo-European language at home (100% speak English very well).
1.3% of residents speak Asian or Pacific Island language at home (83% speak English very well, 17% speak English well).
0.1% of residents speak other language at home (100% speak English very well).
Foreign born population: 288 (2.8%)
(91.7% of them are naturalized citizens)
| Here: | 7.8 |
| State: | 6.5 |
| Here: | 4.7 |
| State: | 4.7 |
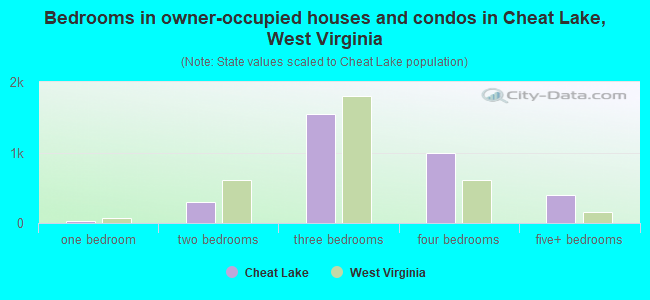
- Bedrooms in owner-occupied houses and condos in Cheat Lake, West Virginia
- 0no bedroom
- 231 bedroom
- 2932 bedrooms
- 1,5473 bedrooms
- 9934 bedrooms
- 3985+ bedrooms
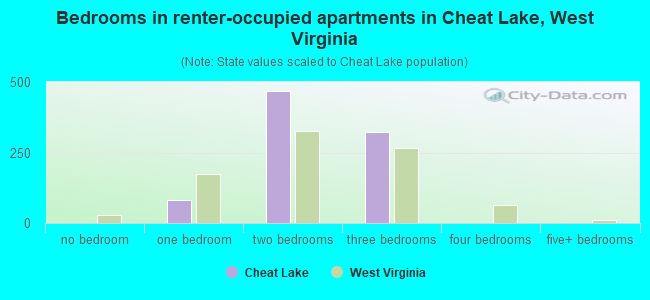
- Bedrooms in renter-occupied apartments in Cheat Lake, West Virginia
- 0no bedroom
- 821 bedroom
- 4672 bedrooms
- 3223 bedrooms
- 04 bedrooms
- 05+ bedrooms
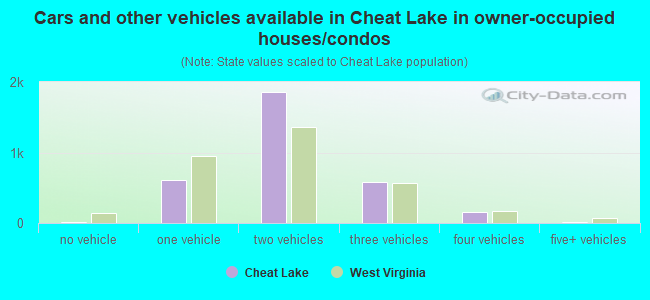
- Cars and other vehicles available in Cheat Lake in owner-occupied houses/condos
- 21no vehicle
- 6141 vehicle
- 1,8622 vehicles
- 5823 vehicles
- 1574 vehicles
- 185+ vehicles
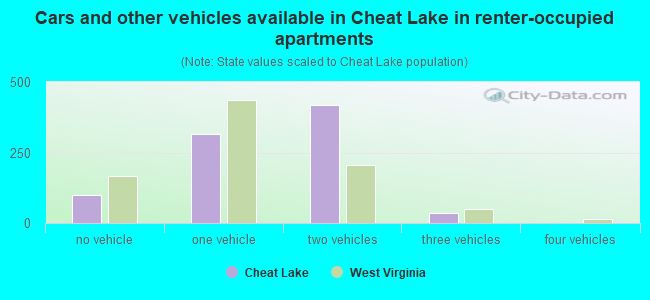
- Cars and other vehicles available in Cheat Lake in renter-occupied apartments
- 98no vehicle
- 3171 vehicle
- 4202 vehicles
- 353 vehicles
- 04 vehicles
- 05+ vehicles
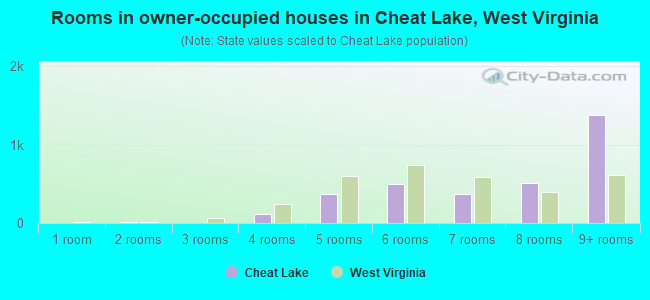
- Rooms in owner-occupied houses in Cheat Lake, West Virginia
- 01 room
- 122 rooms
- 03 rooms
- 1214 rooms
- 3685 rooms
- 4976 rooms
- 3677 rooms
- 5108 rooms
- 1,3809+ rooms
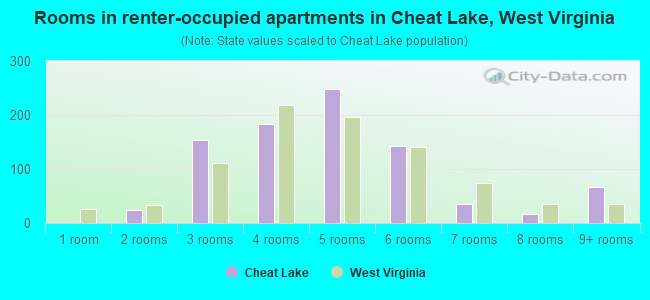
- Rooms in renter-occupied apartments in Cheat Lake, West Virginia
- 01 room
- 252 rooms
- 1533 rooms
- 1834 rooms
- 2485 rooms
- 1426 rooms
- 357 rooms
- 178 rooms
- 679+ rooms
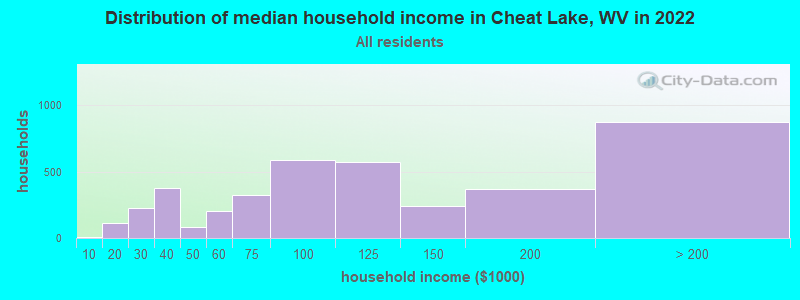
Cheat Lake, WV household income distribution

- 11Less than $10,000
- 112$10,000 to $19,999
- 228$20,000 to $29,999
- 377$30,000 to $39,999
- 84$40,000 to $49,999
- 201$50,000 to $59,999
- 323$60,000 to $74,999
- 585$75,000 to $99,999
- 571$100,000 to $124,999
- 238$125,000 to $149,999
- 366$150,000 to $199,999
- 873$200,000 or more
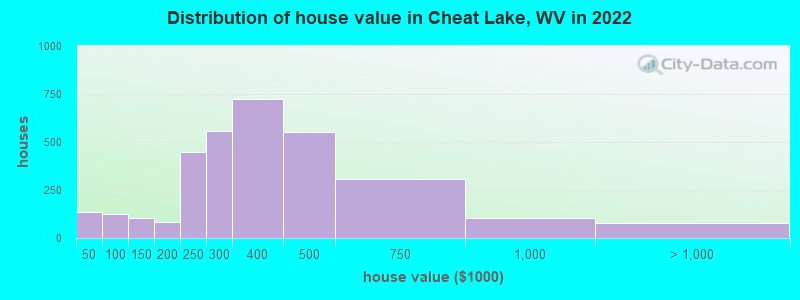
Home value of owner - occupied houses in 2022 in Cheat Lake, WV
-
- 21Less than $10,000
- 42$15,000 to $19,999
- 33$20,000 to $24,999
- 22$30,000 to $34,999
- 14$40,000 to $49,999
- 44$50,000 to $59,999
- 41$60,000 to $69,999
- 4$70,000 to $79,999
- 9$80,000 to $89,999
- 10$90,000 to $99,999
- 1$100,000 to $124,999
- 104$125,000 to $149,999
- 43$150,000 to $174,999
- 39$175,000 to $199,999
- 446$200,000 to $249,999
- 555$250,000 to $299,999
- 724$300,000 to $399,999
- 554$400,000 to $499,999
- 306$500,000 to $749,999
- 104$750,000 to $999,999
- 35$1,000,000 to $1,499,999
- 9$1,500,000 to $1,999,999
- 31$2,000,000 or more
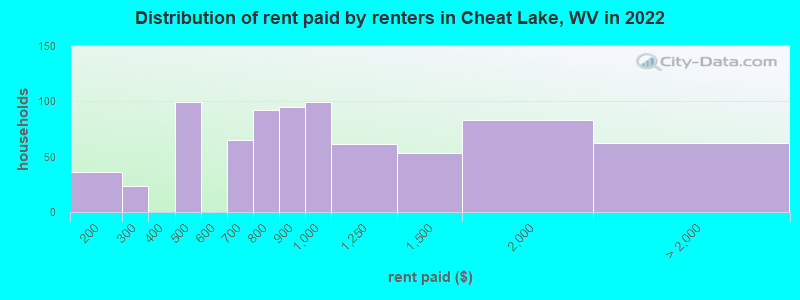
Rent paid by renters in 2022 in Cheat Lake, WV
-
- 3$100 to $149
- 33$150 to $199
- 23$250 to $299
- 99$400 to $449
- 35$600 to $649
- 29$650 to $699
- 34$700 to $749
- 58$750 to $799
- 94$800 to $899
- 99$900 to $999
- 61$1,000 to $1,249
- 53$1,250 to $1,499
- 82$1,500 to $1,999
- 29$2,000 to $2,499
- 32No cash rent
Percentage of workers working in this county: 86.1%
Number of people working at home: 862 (15.7% of all workers)
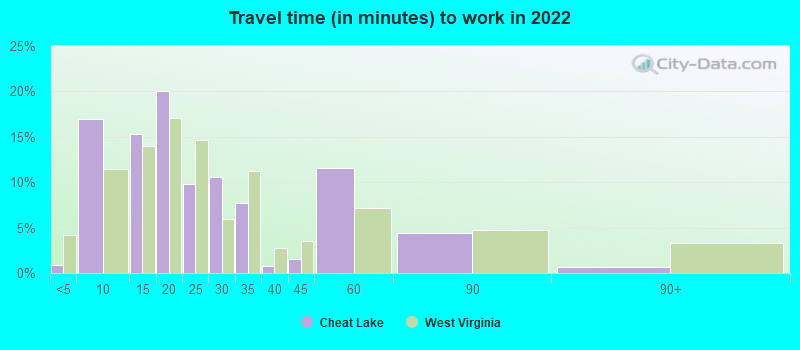
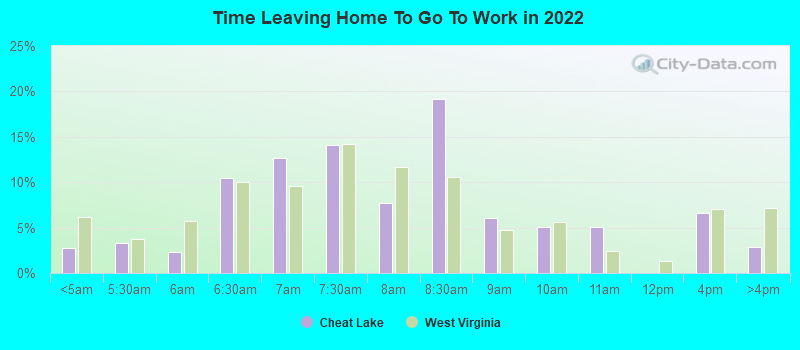
Travel time to work (commute)
- Less than 5 minutes: 57
- 5 to 9 minutes: 592
- 10 to 14 minutes: 547
- 15 to 19 minutes: 932
- 20 to 24 minutes: 1,061
- 25 to 29 minutes: 379
- 30 to 34 minutes: 340
- 35 to 39 minutes: 137
- 40 to 44 minutes: 113
- 45 to 59 minutes: 175
- 60 to 89 minutes: 230
- 90 or more minutes: 51
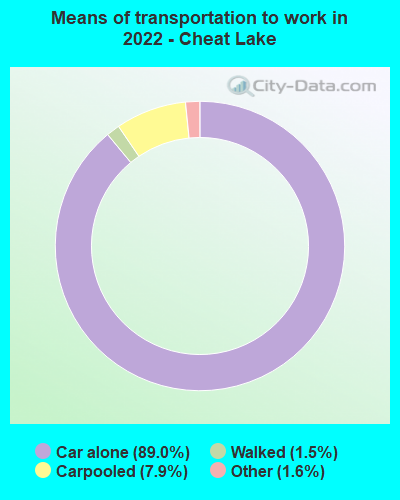
Means of transportation to work:
- Drove a car alone: 2,325 (69.9%)
- Carpooled: 205 (6.2%)
- Taxi: 47 (1.4%)
- Walked: 37 (1.1%)
- Worked at home: 862 (25.9%)
- Unemployment by race in 2022
- Unemployment rate for White non-Hispanic residents
- 1.1%Males
- 0.8%Females
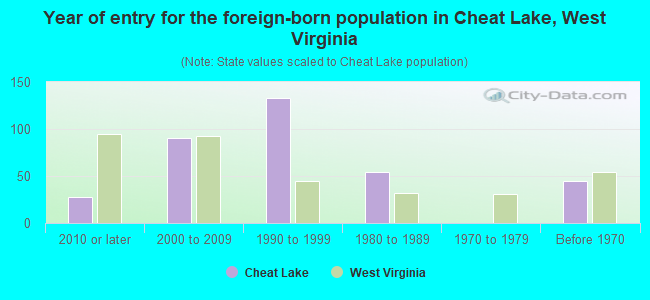
- Year of entry for the foreign-born population in Cheat Lake, West Virginia
- 282010 or later
- 902000 to 2009
- 1331990 to 1999
- 541980 to 1989
- 01970 to 1979
- 45Before 1970
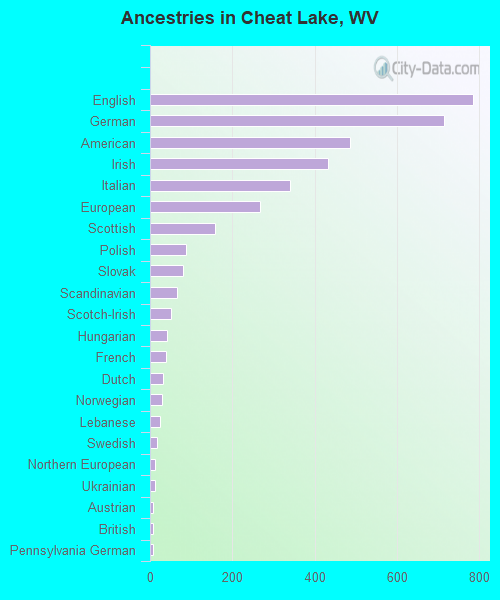
First ancestries reported:
- English: 785 (18.4%)
- German: 716 (16.8%)
- American: 486 (11.4%)
- Irish: 432 (10.1%)
- Italian: 341 (8.0%)
- European: 267 (6.3%)
- Scottish: 159 (3.7%)
- Polish: 88 (2.1%)
- Slovak: 81 (1.9%)
- Scandinavian: 65 (1.5%)
- Scotch-Irish: 52 (1.2%)
- Hungarian: 41 (1.0%)
- French: 38 (0.9%)
- Dutch: 32 (0.8%)
- Norwegian: 29 (0.7%)
- Lebanese: 25 (0.6%)
- Swedish: 17 (0.4%)
- Northern European: 12 (0.3%)
- Ukrainian: 11 (0.3%)
- Austrian: 8 (0.2%)
- British: 8 (0.2%)
- Pennsylvania German: 8 (0.2%)
- Czechoslovakian: 5 (0.1%)
- Romanian: 4 (0.09%)
Most common places of birth for foreign-born residents (%):
| Cheat Lake: | 26.6% (67) |
| West Virginia: | 0.4% (119) |
| Cheat Lake: | 17.1% (43) |
| West Virginia: | 5.8% (1,673) |
| Cheat Lake: | 15.1% (38) |
| West Virginia: | 7.4% (2,143) |
| Cheat Lake: | 8.3% (21) |
| West Virginia: | 0.7% (202) |
| Cheat Lake: | 7.9% (20) |
| West Virginia: | 1.5% (442) |
| Cheat Lake: | 4.8% (12) |
| West Virginia: | 4.3% (1,233) |
| Cheat Lake: | 4.4% (11) |
| West Virginia: | 2.3% (665) |
| Cheat Lake: | 3.6% (9) |
| West Virginia: | 0.6% (178) |
| Cheat Lake: | 2.4% (6) |
| West Virginia: | 0.1% (43) |
| Cheat Lake: | 2.0% (5) |
| West Virginia: | 0.1% (40) |
| Cheat Lake: | 1.6% (4) |
| West Virginia: | 1.0% (294) |
Place of birth for U.S.-born residents:
- This state: 5,415
- Other state: 4,247
- Northeast: 1,671
- Midwest: 698
- South: 1,361
- West: 466
96.5% of Cheat Lake residents lived in the same house 1 years ago.
Out of people who lived in different houses, 26.7% lived in this county.
Out of people who lived in different counties, 22.6% lived in West Virginia.
| Cheat Lake: | 96.5% |
| State average: | 89.6% |
Education attainment for males 25 years and older:
- No schooling: 3
- Nursery to 4th grade: 0
- 5th and 6th grade: 0
- 7th and 8th grade: 0
- 9th grade: 14
- 10th grade: 35
- 11th grade: 24
- 12th grade, no diploma: 0
- High school graduate (or equivalency): 611
- Less than 1 year of college: 223
- Some college more than 1 year, no degree: 462
- Associate degree: 82
- Bachelor's degree: 1,035
- Master's degree: 563
- Professional school degree: 317
- Doctorate degree: 271
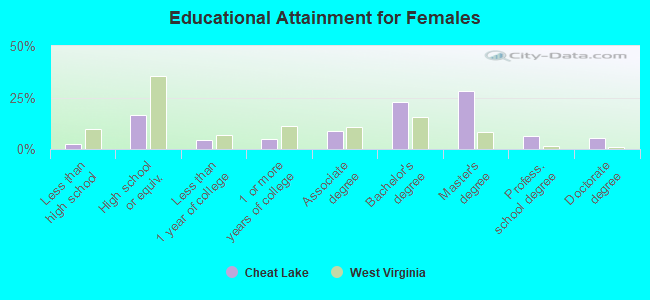
Education attainment for females 25 years and older:
- No schooling: 13
- Nursery to 4th grade: 0
- 5th and 6th grade: 0
- 7th and 8th grade: 13
- 9th grade: 0
- 10th grade: 7
- 11th grade: 56
- 12th grade, no diploma: 8
- High school graduate (or equivalency): 627
- Less than 1 year of college: 170
- Some college more than 1 year, no degree: 184
- Associate degree: 321
- Bachelor's degree: 853
- Master's degree: 1,064
- Professional school degree: 232
- Doctorate degree: 200
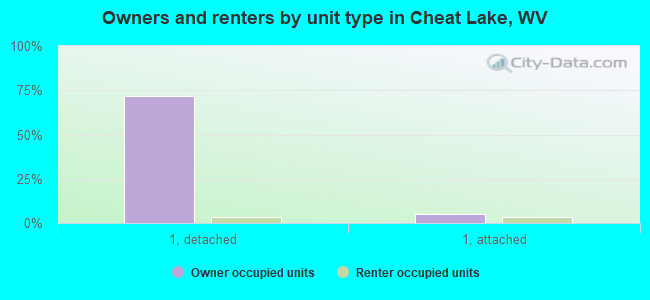
Housing units in structures:
- One, detached: 3,033
- One, attached: 576
- Two: 35
- 3 or 4: 71
- 5 to 9: 347
- 10 to 19: 82
- 20 to 49: 20
- 50 or more: 43
- Mobile homes: 231
Median worth of mobile homes: $52,613
Housing units lacking complete kitchen facilities in 2022: 0.7%
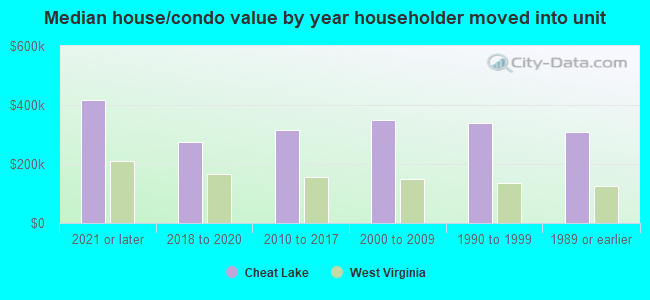
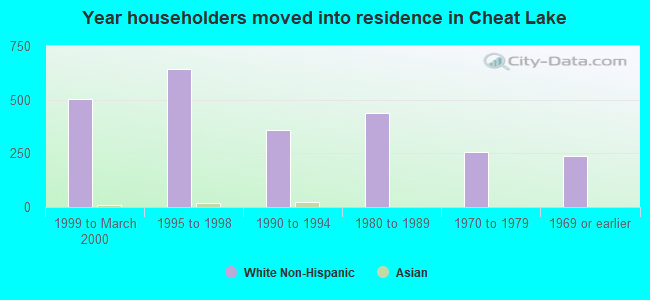
House/condo owner moved in on average 9 years ago
Renter moved in on average 4 years ago
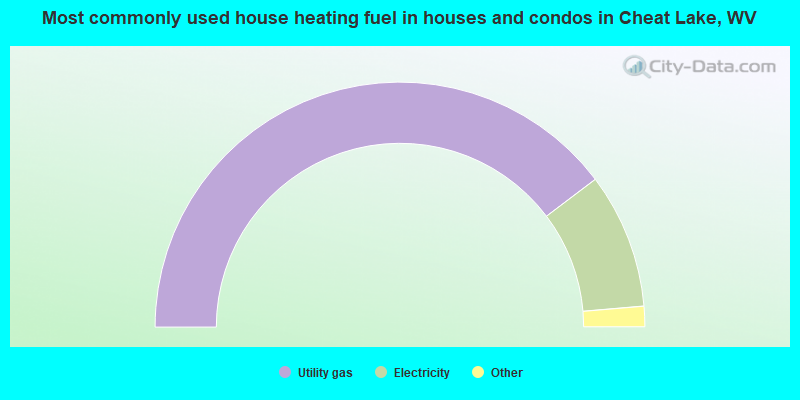
- 79.5%Utility gas
- 17.9%Electricity
- 1.5%Bottled, tank, or LP gas
- 0.6%No fuel used
- 0.4%Fuel oil, kerosene, etc.
- 0.3%Wood
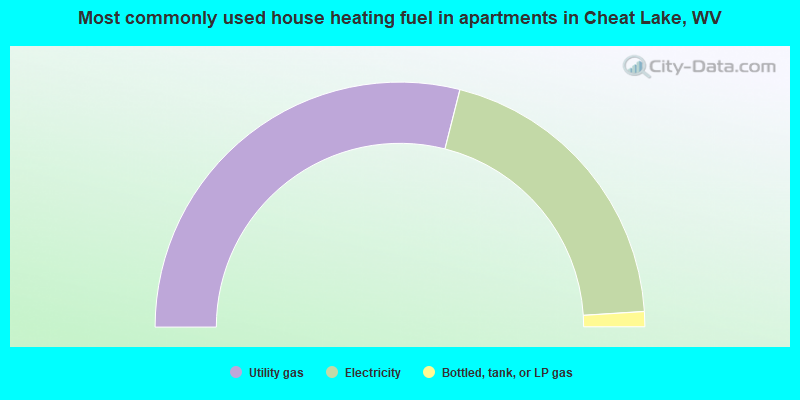
- 57.9%Utility gas
- 40.1%Electricity
- 2.0%Bottled, tank, or LP gas
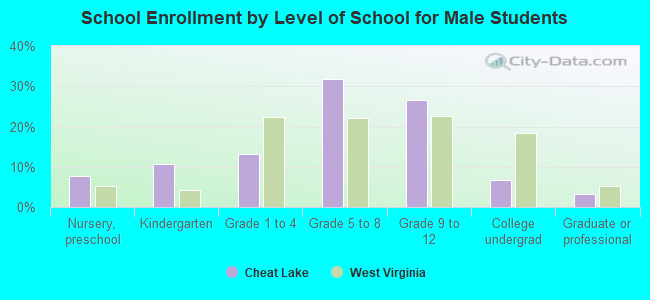
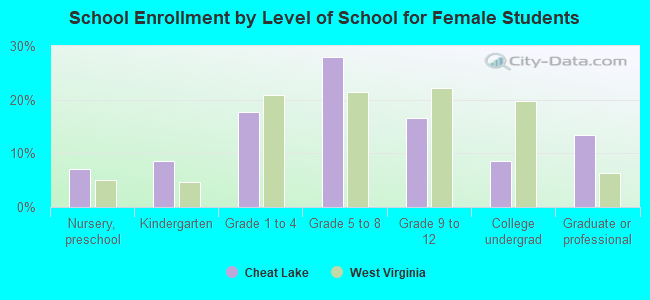
Private vs. public school enrollment:
| Here: | 11.6% |
| West Virginia: | 12.2% |
| Here: | 0.0% |
| West Virginia: | 8.8% |
| Here: | 36.6% |
| West Virginia: | 17.3% |