Cheektowaga, NY (New York) Houses and Residents
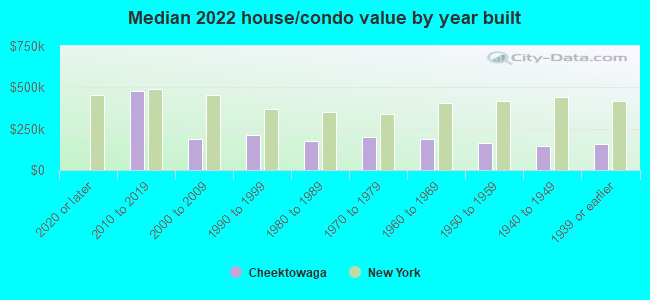
| Cheektowaga: | $174,100 |
| New York: | $400,400 |
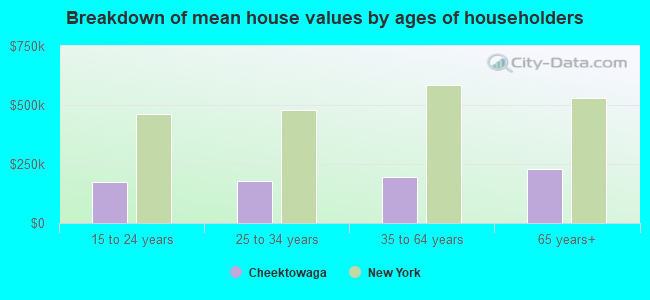
Mean price in 2022:
Detached houses: $172,686
Here: $172,686 State: $476,719 Townhouses or other attached units: $148,962
Here: $148,962 State: $699,270 In 2-unit structures: $230,865
Here: $230,865 State: $713,077 In 3-to-4-unit structures: $266,794
Here: $266,794 State: $764,568 In 5-or-more-unit structures: $526,694
Here: $526,694 State: $912,009 Mobile homes: $43,018
Here: $43,018 State: $88,925
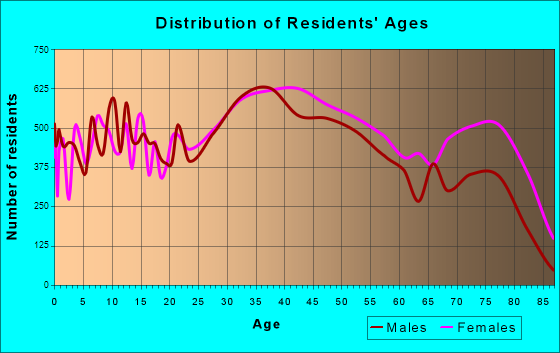
Total population: 75,178 (All urban)
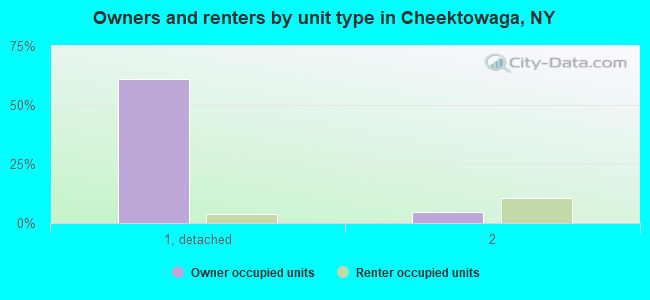
Houses: 34,944 (33,432 occupied: 24,099 owner occupied, 9,333 renter occupied)
| % of renters here: | 28% |
| State: | 46% |
Housing density: 1,373 houses/condos per square mile
Median price asked for vacant for-sale houses and condos in 2022: $213,930.
Median contract rent in 2022: $900 (lower quartile is $729, upper quartile is $1,084)
Median rent asked for vacant for-rent units in 2022: $893
Median gross rent in Cheektowaga, NY in 2022: $1,023
Housing units in Cheektowaga with a mortgage: 14,497 (1,365 second mortgage, 218 home equity loan, 1,028 both second mortgage and home equity loan)
Houses without a mortgage: 552
Median household income for houses/condos with a mortgage: $81,558
Median household income for apartments without a mortgage: $59,380
Median monthly housing costs: $1,035
Compare current foreclosures near Cheektowaga, NY:
| Photo | Address | Area | Beds / Baths | Price | Details |
|---|---|---|---|---|---|

|
#1
Tremaine Ave
Buffalo, NY 14217
|
1,144 sq. feet
|
1 baths 3 beds |
$245,000
|
show details |

|
#2
Heussy Ave
Buffalo, NY 14220
|
1,455 sq. feet
|
2 baths 3 beds |
$245,000
|
show details |

|
#3
Lee St
Depew, NY 14043
|
1,040 sq. feet
|
1 baths 3 beds |
$169,900
|
show details |

|
#4
George Dr
Buffalo, NY 14224
|
1,706 sq. feet
|
1 baths 3 beds |
show details | |

|
#5
Cherrywood Ln
Lockport, NY 14094
|
1,896 sq. feet
|
2 baths 3 beds |
show details | |

|
#6
Colvin Blvd
Buffalo, NY 14223
|
3,258 sq. feet
|
4 baths 5 beds |
show details | |

|
#7
Eastwood Ave
Hamburg, NY 14075
|
2,206 sq. feet
|
2 baths 3 beds |
show details | |

|
#8
Dempster St
Buffalo, NY 14206
|
1,070 sq. feet
|
1 baths 3 beds |
show details | |

|
#9
Bickford Ave
Buffalo, NY 14215
|
1,462 sq. feet
|
2 baths 3 beds |
show details | |

|
#10
Enola Ave
Buffalo, NY 14217
|
892 sq. feet
|
1 baths 2 beds |
show details |
| Photo | Address | Area | Beds / Baths | Price | Details |
|---|---|---|---|---|---|

|
#11
Abbott Rd
Orchard Park, NY 14127
|
1,232 sq. feet
|
1 baths 3 beds |
show details | |

|
#12
Ward Rd
Sanborn, NY 14132
|
2,156 sq. feet
|
2 baths 4 beds |
show details | |

|
#13
Taylor Dr
Tonawanda, NY 14150
|
1,376 sq. feet
|
1 baths 3 beds |
show details | |

|
#14
Hiler Ave
Buffalo, NY 14217
|
1,060 sq. feet
|
1 baths 2 beds |
show details | |

|
#15
Maple Dr
Bowmansville, NY 14026
|
4,508 sq. feet
|
3 baths 3 beds |
show details | |

|
#16
Revere Ave
North Tonawanda, NY 14120
|
936 sq. feet
|
1 baths 3 beds |
show details | |

|
#17
Edward St
North Tonawanda, NY 14120
|
1,248 sq. feet
|
1 baths 4 beds |
show details | |

|
#18
Jamison Rd
Elma, NY 14059
|
2,457 sq. feet
|
2 baths 4 beds |
show details | |

|
#19
Newman St
Buffalo, NY 14218
|
1,344 sq. feet
|
1 baths 3 beds |
show details | |

|
#20
Greiner Rd
Buffalo, NY 14221
|
1,622 sq. feet
|
1 baths 3 beds |
show details |
| Photo | Address | Area | Beds / Baths | Price | Details |
|---|---|---|---|---|---|

|
#21
100th St
Niagara Falls, NY 14304
|
1,680 sq. feet
|
2 baths 3 beds |
show details | |

|
#22
Stephenson Ave
Niagara Falls, NY 14304
|
1,080 sq. feet
|
1 baths 2 beds |
show details | |

|
#23
Eureka Pl
Buffalo, NY 14204
|
1,308 sq. feet
|
1 baths 3 beds |
show details | |

|
#24
70th St
Niagara Falls, NY 14304
|
924 sq. feet
|
1 baths 3 beds |
show details | |

|
#25
Genesee St
Corfu, NY 14036
|
1,458 sq. feet
|
1 baths 3 beds |
show details | |

|
#26
Buckeye Rd
Buffalo, NY 14226
|
1,004 sq. feet
|
1 baths 2 beds |
show details | |

|
#27
Central Blvd
Buffalo, NY 14225
|
1,406 sq. feet
|
1 baths 3 beds |
show details | |

|
#28
Pinehurst Ave
Buffalo, NY 14225
|
1,050 sq. feet
|
1 baths 3 beds |
show details | |

|
#29
Pryor Ave
Tonawanda, NY 14150
|
1,691 sq. feet
|
1 baths 5 beds |
show details | |

|
#30
Farmer St
Buffalo, NY 14207
|
1,849 sq. feet
|
3 baths 7 beds |
show details |
| Photo | Address | Area | Beds / Baths | Price | Details |
|---|---|---|---|---|---|

|
#31
Calvin Ct S
Tonawanda, NY 14150
|
1,302 sq. feet
|
1 baths 3 beds |
show details | |

|
#32
Nason Pkwy
Buffalo, NY 14218
|
1,040 sq. feet
|
1 baths 4 beds |
show details | |

|
#33
Mang Ave
Buffalo, NY 14217
|
1,272 sq. feet
|
1 baths 3 beds |
show details | |

|
#34
Fernald Ave
Buffalo, NY 14218
|
2,488 sq. feet
|
2 baths 6 beds |
show details | |

|
#35
Brighton Rd
Tonawanda, NY 14150
|
1,188 sq. feet
|
1 baths 3 beds |
show details | |

|
#36
Brighton Rd
Tonawanda, NY 14150
|
1,188 sq. feet
|
1 baths 3 beds |
show details | |

|
#37
Leonard St
Buffalo, NY 14218
|
2,056 sq. feet
|
2 baths 6 beds |
show details | |

|
#38
Hinman Ave
Buffalo, NY 14216
|
947 sq. feet
|
1 baths 2 beds |
show details | |

|
#39
Greenhill Ter
Buffalo, NY 14224
|
1,347 sq. feet
|
1 baths 3 beds |
show details | |

|
#40
Cottonwood Dr
Buffalo, NY 14221
|
2,655 sq. feet
|
2 baths 4 beds |
show details |
| Photo | Address | Area | Beds / Baths | Price | Details |
|---|---|---|---|---|---|

|
#41
Hartwell Rd
Buffalo, NY 14216
|
1,361 sq. feet
|
1 baths 2 beds |
show details | |

|
#42
Glenwood Dr
Buffalo, NY 14221
|
1,428 sq. feet
|
2 baths 3 beds |
show details | |

|
#43
Grote St
Buffalo, NY 14207
|
1,672 sq. feet
|
2 baths 4 beds |
show details | |

|
#44
Mckinley Pkwy
Buffalo, NY 14218
|
1,552 sq. feet
|
1 baths 2 beds |
show details | |

|
#45
Prospect Ave
Buffalo, NY 14201
|
2,440 sq. feet
|
2 baths 4 beds |
show details | |

|
#46
Cottonwood Dr
Buffalo, NY 14221
|
2,442 sq. feet
|
2 baths 4 beds |
show details | |

|
#47
Villa Ave
Buffalo, NY 14216
|
2,102 sq. feet
|
1 baths 4 beds |
show details | |

|
#48
Knowlton Ave
Buffalo, NY 14217
|
2,022 sq. feet
|
1 baths 4 beds |
show details | |

|
#49
Woodland Dr
Buffalo, NY 14223
|
1,114 sq. feet
|
1 baths 3 beds |
show details | |

|
Check over 1 million property listings on Foreclosure.com!
|
browse all offers | |||

Latest news about housing in Cheektowaga, NY collected exclusively by city-data.com from local newspapers, TV, and radio stations


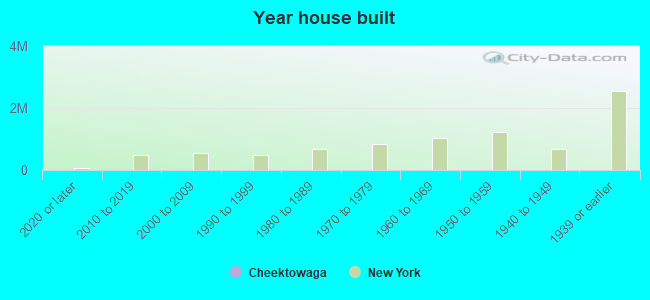
Median year apartment built: 1966
Household type by relationship:
Households: 75,261- Male householders: 15,448 (5,090 living alone), Female householders: 17,984 (7,913 living alone)
14,175 spouses (13,967 opposite-sex spouses), 1,909 unmarried partners, (1,870 opposite-sex unmarried partners), 18,690 children (16,829 natural, 1,482 adopted, 379 stepchildren), 1,215 grandchildren, 260 brothers or sisters, 568 parents, 0 foster children, 825 other relatives, 1,035 non-relatives
- In group quarters: 3,152
Size of family households: 8,735 2-persons, 5,450 3-persons, 3,089 4-persons, 516 5-persons, 744 6-persons, 329 7-or-more-persons.
Size of nonfamily households: 13,003 1-person, 1,366 2-persons, 162 3-persons, 38 4-persons.
8,523 married couples with children.
4,996 single-parent households (677 men, 4,319 women).
89.9% of residents of Cheektowaga speak English at home.
1.8% of residents speak Spanish at home (78% speak English very well, 15% speak English well, 8% speak English not well).
4.8% of residents speak other Indo-European language at home (57% speak English very well, 33% speak English well, 10% speak English not well).
1.1% of residents speak Asian or Pacific Island language at home (58% speak English very well, 15% speak English well, 26% speak English not well, 1% don't speak English at all).
2.7% of residents speak other language at home (67% speak English very well, 19% speak English well, 13% speak English not well, 1% don't speak English at all).
Foreign born population: 7,313 (9.7%)
(46.5% of them are naturalized citizens)
| Here: | 6.0 |
| State: | 6.3 |
| Here: | 4.3 |
| State: | 3.8 |
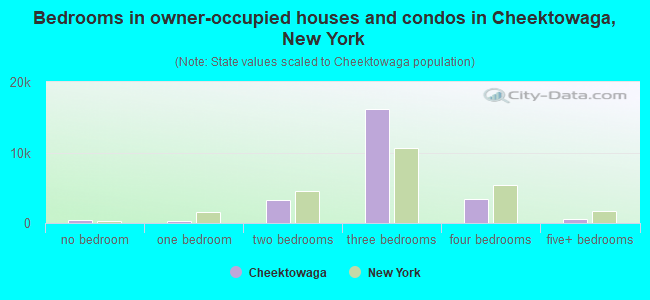
- Bedrooms in owner-occupied houses and condos in Cheektowaga, New York
- 373no bedroom
- 2451 bedroom
- 3,3282 bedrooms
- 16,1473 bedrooms
- 3,3824 bedrooms
- 6245+ bedrooms
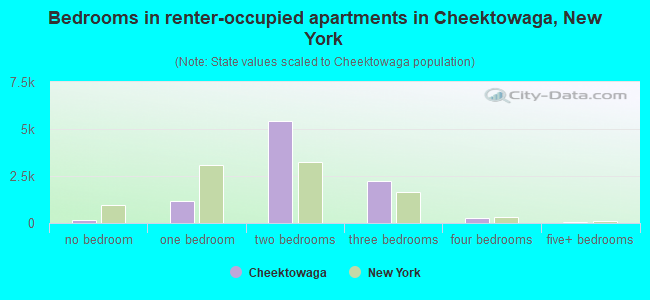
- Bedrooms in renter-occupied apartments in Cheektowaga, New York
- 170no bedroom
- 1,1701 bedroom
- 5,4522 bedrooms
- 2,2553 bedrooms
- 2564 bedrooms
- 305+ bedrooms
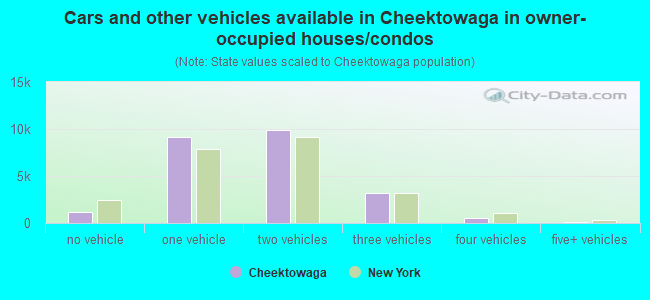
- Cars and other vehicles available in Cheektowaga in owner-occupied houses/condos
- 1,202no vehicle
- 9,1291 vehicle
- 9,8912 vehicles
- 3,2293 vehicles
- 5414 vehicles
- 1075+ vehicles
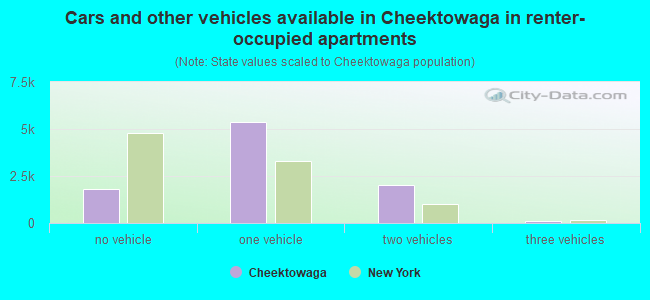
- Cars and other vehicles available in Cheektowaga in renter-occupied apartments
- 1,823no vehicle
- 5,3511 vehicle
- 2,0272 vehicles
- 1033 vehicles
- 294 vehicles
- 05+ vehicles
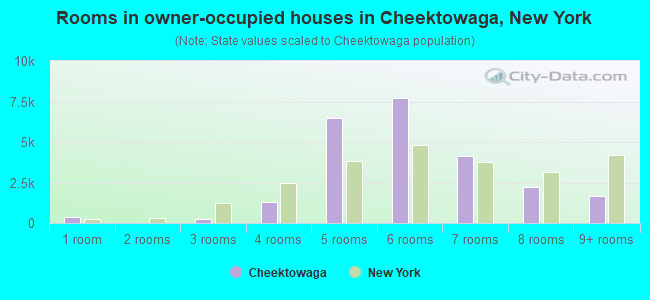
- Rooms in owner-occupied houses in Cheektowaga, New York
- 3731 room
- 02 rooms
- 2593 rooms
- 1,2694 rooms
- 6,4695 rooms
- 7,6976 rooms
- 4,1507 rooms
- 2,2388 rooms
- 1,6449+ rooms
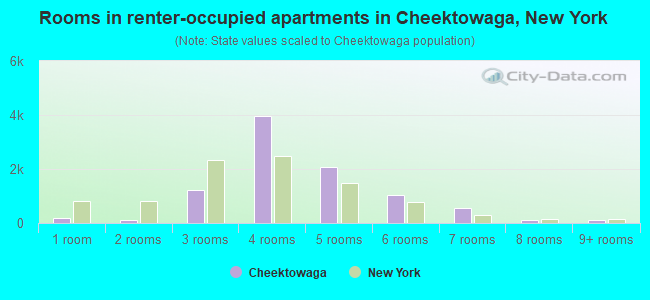
- Rooms in renter-occupied apartments in Cheektowaga, New York
- 1701 room
- 1122 rooms
- 1,2053 rooms
- 3,9564 rooms
- 2,0565 rooms
- 1,0306 rooms
- 5677 rooms
- 1098 rooms
- 1289+ rooms
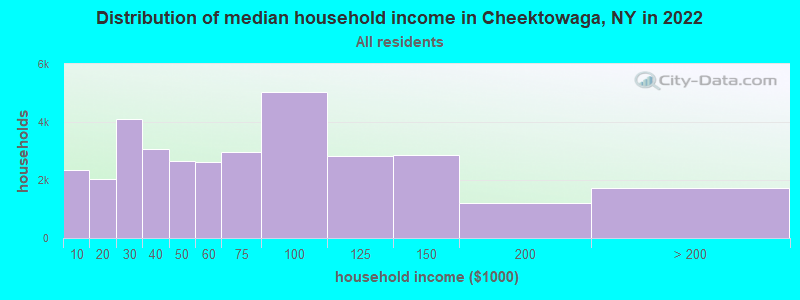
Cheektowaga, NY household income distribution

- 2,338Less than $10,000
- 2,024$10,000 to $19,999
- 4,109$20,000 to $29,999
- 3,084$30,000 to $39,999
- 2,661$40,000 to $49,999
- 2,604$50,000 to $59,999
- 2,968$60,000 to $74,999
- 5,041$75,000 to $99,999
- 2,812$100,000 to $124,999
- 2,859$125,000 to $149,999
- 1,200$150,000 to $199,999
- 1,732$200,000 or more
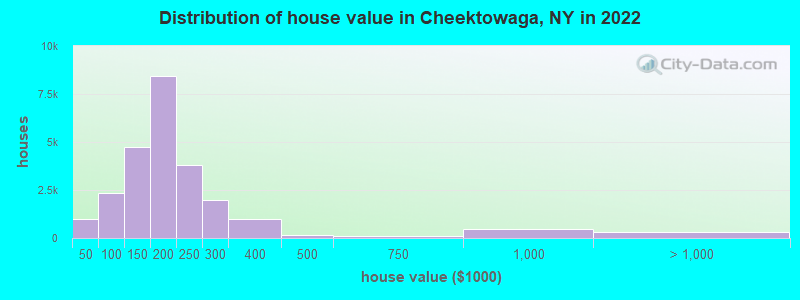
Home value of owner - occupied houses in 2022 in Cheektowaga, NY
-
- 178Less than $10,000
- 113$10,000 to $14,999
- 93$15,000 to $19,999
- 82$20,000 to $24,999
- 182$30,000 to $34,999
- 165$35,000 to $39,999
- 170$40,000 to $49,999
- 187$50,000 to $59,999
- 117$60,000 to $69,999
- 585$70,000 to $79,999
- 637$80,000 to $89,999
- 630$90,000 to $99,999
- 2,116$100,000 to $124,999
- 2,611$125,000 to $149,999
- 4,340$150,000 to $174,999
- 4,121$175,000 to $199,999
- 3,817$200,000 to $249,999
- 1,966$250,000 to $299,999
- 981$300,000 to $399,999
- 147$400,000 to $499,999
- 112$500,000 to $749,999
- 444$750,000 to $999,999
- 78$1,000,000 to $1,499,999
- 227$1,500,000 to $1,999,999
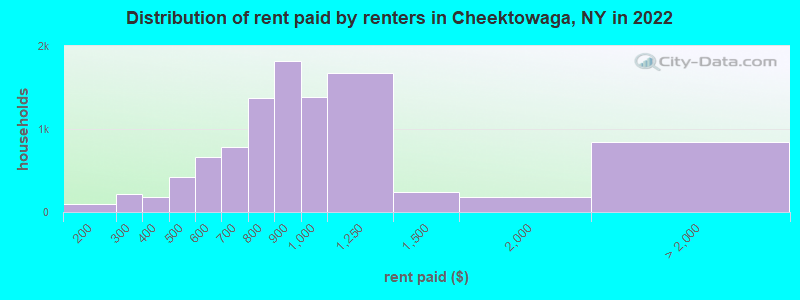
Rent paid by renters in 2022 in Cheektowaga, NY
-
- 51$100 to $149
- 40$150 to $199
- 125$200 to $249
- 86$250 to $299
- 93$300 to $349
- 90$350 to $399
- 256$400 to $449
- 162$450 to $499
- 284$500 to $549
- 379$550 to $599
- 378$600 to $649
- 400$650 to $699
- 865$700 to $749
- 507$750 to $799
- 1,824$800 to $899
- 1,383$900 to $999
- 1,674$1,000 to $1,249
- 245$1,250 to $1,499
- 174$1,500 to $1,999
- 107$2,000 to $2,499
- 9$3,000 to $3,499
- 118$3,500 or more
- 613No cash rent
Percentage of workers working in this county: 95.0%
Number of people working at home: 4,531 (11.4% of all workers)
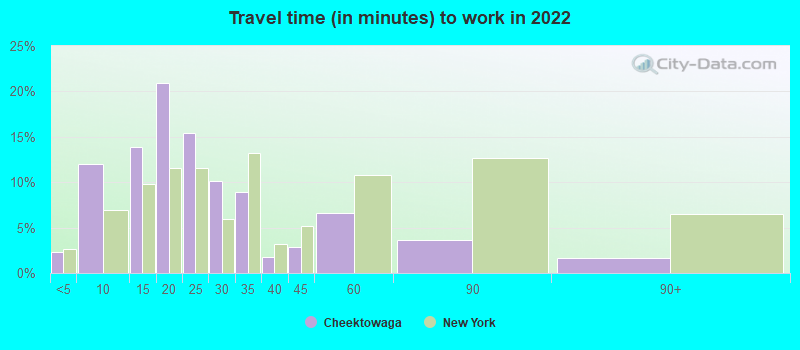
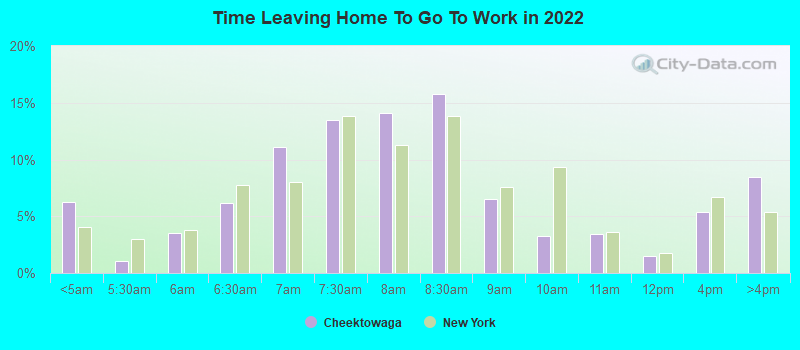
Travel time to work (commute)
- Less than 5 minutes: 727
- 5 to 9 minutes: 4,018
- 10 to 14 minutes: 5,757
- 15 to 19 minutes: 8,914
- 20 to 24 minutes: 7,186
- 25 to 29 minutes: 2,385
- 30 to 34 minutes: 2,212
- 35 to 39 minutes: 70
- 40 to 44 minutes: 444
- 45 to 59 minutes: 244
- 60 to 89 minutes: 527
- 90 or more minutes: 567
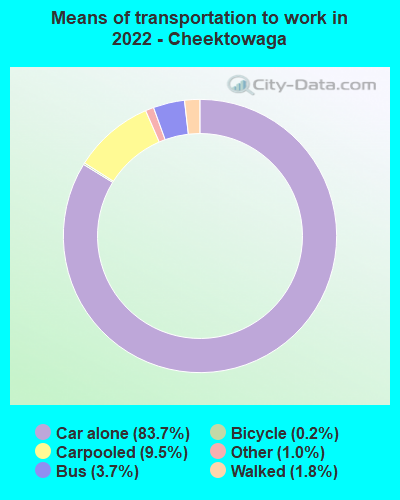
Means of transportation to work:
- Drove a car alone: 31,139 (72.6%)
- Carpooled: 4,235 (9.9%)
- Bus: 1,549 (3.6%)
- Subway or elevated rail: 21 (0.0%)
- Ferryboat: 11 (0.0%)
- Taxi: 500 (1.2%)
- Bicycle: 41 (0.1%)
- Walked: 717 (1.7%)
- Worked at home: 4,531 (10.6%)
- Unemployment by race in 2022
- Unemployment rate for White non-Hispanic residents
- 2.5%Males
- 2.8%Females
- Unemployment rate for Black residents
- 4.1%Males
- 1.2%Females
- Unemployment rate for Asian residents
- 0.8%Males
- 4.6%Females
- Unemployment rate for other race residents
- 3.3%Males
- Unemployment rate for two or more race residents
- 9.6%Males
- 0.5%Females
- Unemployment rate for Hispanic or Latino residents
- 7.6%Males
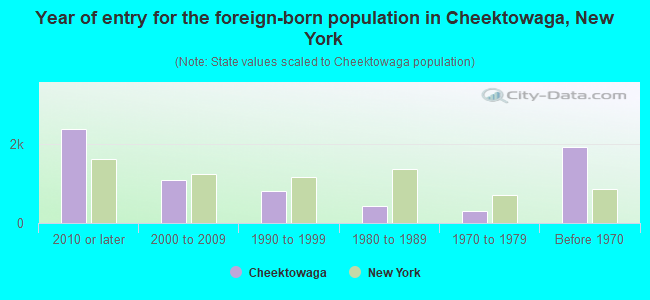
- Year of entry for the foreign-born population in Cheektowaga, New York
- 2,3802010 or later
- 1,0852000 to 2009
- 8131990 to 1999
- 4271980 to 1989
- 2981970 to 1979
- 1,916Before 1970
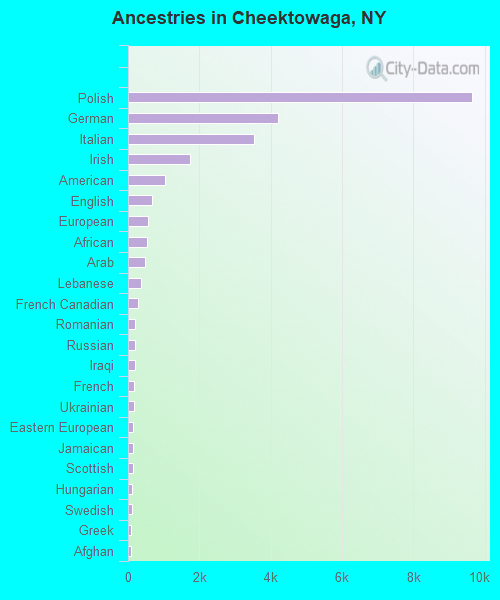
First ancestries reported:
- Polish: 9,644 (25.6%)
- German: 4,215 (11.2%)
- Italian: 3,533 (9.4%)
- Irish: 1,746 (4.6%)
- American: 1,043 (2.8%)
- English: 673 (1.8%)
- European: 569 (1.5%)
- African: 522 (1.4%)
- Arab: 465 (1.2%)
- Lebanese: 368 (1.0%)
- French Canadian: 281 (0.7%)
- Romanian: 198 (0.5%)
- Russian: 191 (0.5%)
- Iraqi: 185 (0.5%)
- French: 170 (0.5%)
- Ukrainian: 159 (0.4%)
- Eastern European: 150 (0.4%)
- Jamaican: 138 (0.4%)
- Scottish: 137 (0.4%)
- Hungarian: 121 (0.3%)
- Swedish: 102 (0.3%)
- Greek: 97 (0.3%)
- Afghan: 96 (0.3%)
- Scotch-Irish: 85 (0.2%)
- Czechoslovakian: 85 (0.2%)
- West Indian: 62 (0.2%)
- Haitian: 58 (0.2%)
- Bulgarian: 57 (0.2%)
- British: 55 (0.1%)
- German Russian: 55 (0.1%)
- Turkish: 49 (0.1%)
- Dutch: 47 (0.1%)
- Armenian: 46 (0.1%)
- Ethiopian: 42 (0.1%)
- Norwegian: 41 (0.1%)
- South African: 35 (0.09%)
- Czech: 34 (0.09%)
- Jordanian: 30 (0.08%)
- Scandinavian: 30 (0.08%)
- Serbian: 27 (0.07%)
- Welsh: 27 (0.07%)
- Canadian: 20 (0.05%)
- Nigerian: 16 (0.04%)
- Lithuanian: 14 (0.04%)
- Swiss: 13 (0.03%)
- Finnish: 13 (0.03%)
- Slavic: 12 (0.03%)
- Brazilian: 12 (0.03%)
- Pennsylvania German: 11 (0.03%)
- Slovak: 11 (0.03%)
- Croatian: 10 (0.03%)
- Barbadian: 9 (0.02%)
- British West Indian: 9 (0.02%)
- Portuguese: 7 (0.02%)
- Syrian: 6 (0.02%)
- Ghanaian: 6 (0.02%)
- Estonian: 4 (0.01%)
- Northern European: 4 (0.01%)
- Iranian: 4 (0.01%)
Most common places of birth for foreign-born residents (%):
| Cheektowaga: | 8.5% (453) |
| New York: | 2.6% (117,288) |
| Cheektowaga: | 7.4% (396) |
| New York: | 3.5% (158,432) |
| Cheektowaga: | 6.9% (370) |
| New York: | 1.3% (59,107) |
| Cheektowaga: | 5.1% (272) |
| New York: | 0.2% (8,745) |
| Cheektowaga: | 3.8% (202) |
| New York: | 0.9% (38,713) |
| Cheektowaga: | 3.7% (200) |
| New York: | 0.3% (14,772) |
| Cheektowaga: | 3.6% (194) |
| New York: | 1.4% (65,102) |
| Cheektowaga: | 3.4% (183) |
| New York: | 0.1% (5,468) |
| Cheektowaga: | 3.4% (179) |
| New York: | 0.2% (8,026) |
| Cheektowaga: | 3.1% (168) |
| New York: | 0.4% (19,252) |
| Cheektowaga: | 3.1% (163) |
| New York: | 0.1% (6,152) |
| Cheektowaga: | 2.6% (139) |
| New York: | 0.9% (39,058) |
| Cheektowaga: | 2.3% (123) |
| New York: | 0.6% (25,517) |
| Cheektowaga: | 2.3% (123) |
| New York: | 9.1% (410,910) |
| Cheektowaga: | 2.3% (123) |
| New York: | 0.4% (16,179) |
| Cheektowaga: | 2.2% (117) |
| New York: | 0.2% (6,810) |
| Cheektowaga: | 2.1% (113) |
| New York: | 1.8% (81,374) |
| Cheektowaga: | 1.8% (96) |
| New York: | 0.1% (2,563) |
| Cheektowaga: | 1.7% (92) |
| New York: | 0.1% (4,732) |
| Cheektowaga: | 1.7% (90) |
| New York: | 1.4% (62,442) |
| Cheektowaga: | 1.5% (82) |
| New York: | 11.1% (501,040) |
Place of birth for U.S.-born residents:
- This state: 60,396
- Other state: 6,774
- Northeast: 1,931
- Midwest: 949
- South: 2,412
- West: 1,482
92.6% of Cheektowaga residents lived in the same house 1 years ago.
Out of people who lived in different houses, 41.4% lived in this county.
Out of people who lived in different counties, 63.0% lived in New York.
| Cheektowaga: | 92.6% |
| State average: | 89.6% |
Education attainment for males 25 years and older:
- No schooling: 630
- Nursery to 4th grade: 23
- 5th and 6th grade: 43
- 7th and 8th grade: 57
- 9th grade: 91
- 10th grade: 274
- 11th grade: 500
- 12th grade, no diploma: 402
- High school graduate (or equivalency): 7,684
- Less than 1 year of college: 1,221
- Some college more than 1 year, no degree: 2,905
- Associate degree: 3,126
- Bachelor's degree: 4,302
- Master's degree: 2,102
- Professional school degree: 135
- Doctorate degree: 569

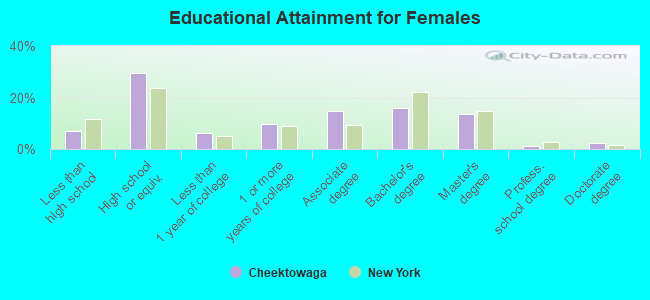
Education attainment for females 25 years and older:
- No schooling: 647
- Nursery to 4th grade: 185
- 5th and 6th grade: 0
- 7th and 8th grade: 233
- 9th grade: 48
- 10th grade: 103
- 11th grade: 70
- 12th grade, no diploma: 631
- High school graduate (or equivalency): 8,304
- Less than 1 year of college: 1,699
- Some college more than 1 year, no degree: 2,731
- Associate degree: 4,185
- Bachelor's degree: 4,515
- Master's degree: 3,833
- Professional school degree: 283
- Doctorate degree: 627
Housing units in structures:
- One, detached: 22,601
- One, attached: 603
- Two: 4,742
- 3 or 4: 2,431
- 5 to 9: 1,401
- 10 to 19: 1,028
- 20 to 49: 210
- 50 or more: 725
- Mobile homes: 1,203
Median worth of mobile homes: $63,400
Housing units lacking complete kitchen facilities in 2022: 0.3%
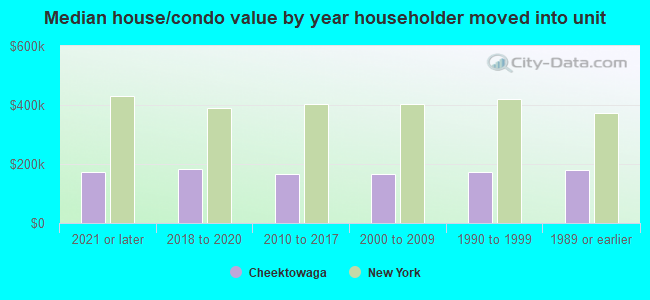
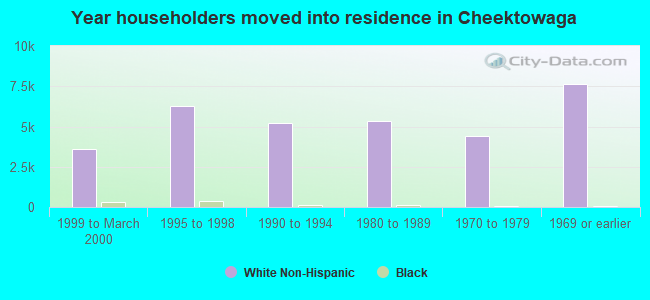
House/condo owner moved in on average 15 years ago
Renter moved in on average 3 years ago
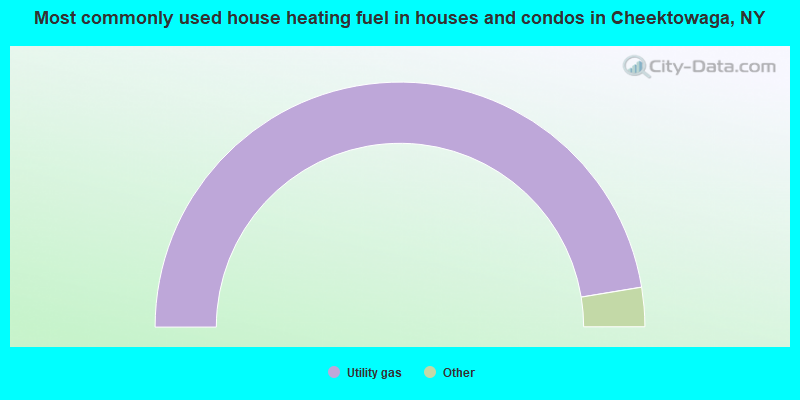
- 94.9%Utility gas
- 2.5%Electricity
- 1.3%Bottled, tank, or LP gas
- 0.6%Fuel oil, kerosene, etc.
- 0.4%Other fuel
- 0.2%Wood
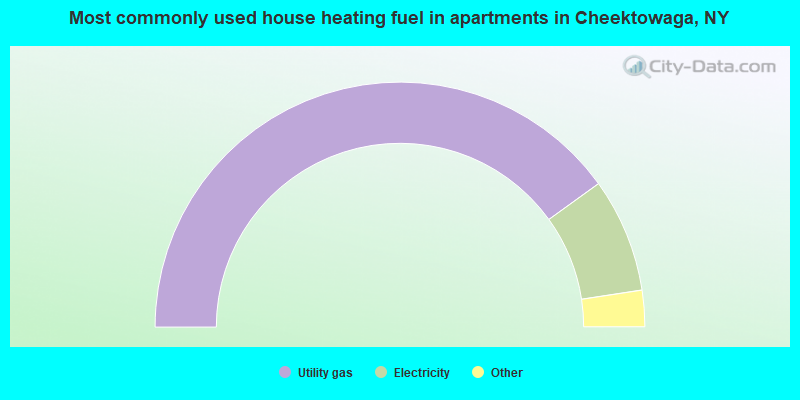
- 80.1%Utility gas
- 15.1%Electricity
- 3.1%Bottled, tank, or LP gas
- 0.8%Other fuel
- 0.4%Fuel oil, kerosene, etc.
- 0.3%Wood
- 0.2%No fuel used
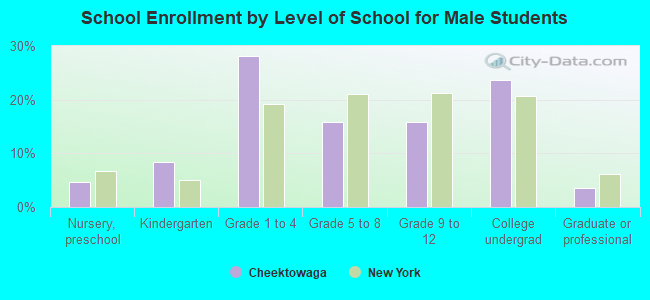
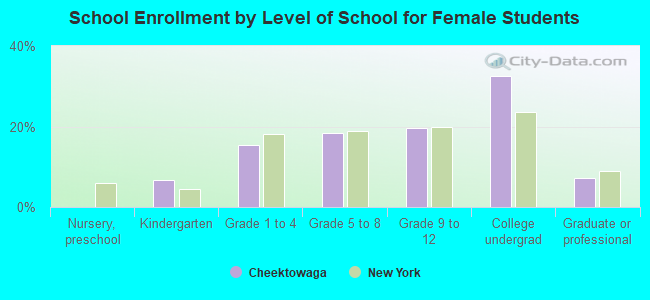
Private vs. public school enrollment:
| Here: | 9.3% |
| New York: | 15.6% |
| Here: | 23.2% |
| New York: | 15.0% |
| Here: | 34.0% |
| New York: | 39.2% |