Cherrywood Village, KY (Kentucky) Houses and Residents
| Cherrywood Village: | $363,627 |
| Kentucky: | $196,300 |
Total population: 335 (All urban)
Houses: 155 (148 occupied: 129 owner occupied, 19 renter occupied)
| % of renters here: | 13% |
| State: | 31% |
Housing density: 2,271 houses/condos per square mile
Median price asked for vacant for-sale houses and condos in 2022 in this county: $108,908.
Median contract rent in 2022: $1,624 (lower quartile is $1,077, upper quartile is over $2,000)
Median gross rent in Cherrywood Village, KY in 2022: $1,900
Housing units in Cherrywood Village with a mortgage: 66 (7 second mortgage, 11 home equity loan, 5 both second mortgage and home equity loan)
Houses without a mortgage: 63


Household type by relationship:
Households: 726,943- In family households: 580,435 (118,887 male householders, 70,095 female householders)
126,329 spouses, 205,111 children (190,669 natural, 5,126 adopted, 9,316 stepchildren), 18,004 grandchildren, 7,360 brothers or sisters, 5,615 parents, foster children, 8,500 other relatives, 17,409 non-relatives
- In nonfamily households: 146,508 (55,241 male householders (43,300 living alone)), 64,952 female householders (55,543 living alone)), 26,315 nonrelatives
- In group quarters: 14,153 (8,529 institutionalized population)
98,371 married couples with children.
51,135 single-parent households (8,275 men, 42,860 women).
95.0% of residents of Cherrywood Village speak English at home.
3.1% of residents speak Spanish at home (100% speak English very well).
1.9% of residents speak other Indo-European language at home (100% speak English very well).
Foreign born population: 18 (4.7%)
(100.0% of them are naturalized citizens)
| Here: | 7.6 |
| State: | 6.4 |
| Here: | 5.2 |
| State: | 4.4 |

- Bedrooms in owner-occupied houses and condos in Cherrywood Village, Kentucky
- 0no bedroom
- 11 bedroom
- 132 bedrooms
- 773 bedrooms
- 384 bedrooms
- 05+ bedrooms

- Bedrooms in renter-occupied apartments in Cherrywood Village, Kentucky
- 0no bedroom
- 01 bedroom
- 122 bedrooms
- 73 bedrooms
- 04 bedrooms
- 05+ bedrooms

- Cars and other vehicles available in Cherrywood Village in owner-occupied houses/condos
- 2no vehicle
- 301 vehicle
- 812 vehicles
- 153 vehicles
- 14 vehicles
- 05+ vehicles

- Cars and other vehicles available in Cherrywood Village in renter-occupied apartments
- 0no vehicle
- 81 vehicle
- 102 vehicles
- 13 vehicles
- 04 vehicles
- 05+ vehicles

- Rooms in owner-occupied houses in Cherrywood Village, Kentucky
- 01 room
- 02 rooms
- 03 rooms
- 04 rooms
- 95 rooms
- 286 rooms
- 517 rooms
- 258 rooms
- 169+ rooms

- Rooms in renter-occupied apartments in Cherrywood Village, Kentucky
- 01 room
- 02 rooms
- 33 rooms
- 04 rooms
- 65 rooms
- 86 rooms
- 27 rooms
- 08 rooms
- 09+ rooms


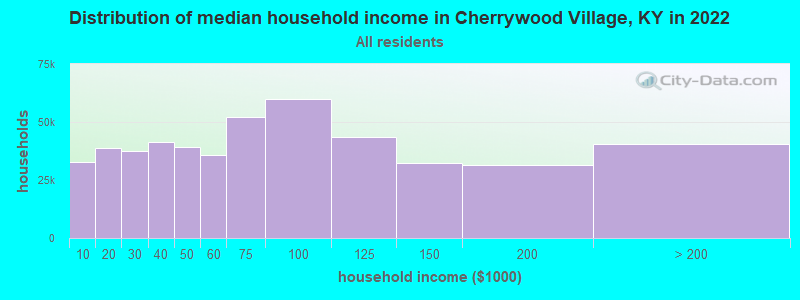
Cherrywood Village, KY household income distribution

- 32,716Less than $10,000
- 39,002$10,000 to $19,999
- 37,518$20,000 to $29,999
- 41,379$30,000 to $39,999
- 39,196$40,000 to $49,999
- 35,597$50,000 to $59,999
- 51,972$60,000 to $74,999
- 59,761$75,000 to $99,999
- 43,380$100,000 to $124,999
- 32,153$125,000 to $149,999
- 31,576$150,000 to $199,999
- 40,635$200,000 or more
Percentage of workers working in this county: 86.2%
Number of people working at home: 26 (14.4% of all workers)
Travel time to work (commute)
- Less than 5 minutes: 4
- 5 to 9 minutes: 17
- 10 to 14 minutes: 15
- 15 to 19 minutes: 31
- 20 to 24 minutes: 42
- 25 to 29 minutes: 10
- 30 to 34 minutes: 8
- 35 to 39 minutes: 5
- 40 to 44 minutes: 0
- 45 to 59 minutes: 2
- 60 to 89 minutes: 3
- 90 or more minutes: 7
Means of transportation to work:
- Drove a car alone: 130 (84.4%)
- Carpooled: 8 (5.2%)
- Walked: 4 (2.6%)
- Other means: 2 (1.3%)
- Worked at home: 10 (6.5%)


- Year of entry for the foreign-born population in Cherrywood Village, Kentucky
- 21995 to March 2000
- 01990 to 1994
- 01985 to 1989
- 01980 to 1984
- 01975 to 1979
- 01970 to 1974
- 01965 to 1969
- 5Before 1965

First ancestries reported:
- German: 121 (30.7%)
- English: 63 (16.0%)
- Irish: 62 (15.7%)
- Other: 39 (9.9%)
- United States: 22 (5.6%)
- Welsh: 21 (5.3%)
- Scotch-Irish: 17 (4.3%)
- Scottish: 16 (4.1%)
- Italian: 8 (2.0%)
- French: 6 (1.5%)
- Dutch: 4 (1.0%)
- Norwegian: 4 (1.0%)
- Polish: 4 (1.0%)
- Czech: 3 (0.8%)
- Swedish: 2 (0.5%)
- Swiss: 2 (0.5%)
Most common places of birth for foreign-born residents (%):
| Cherrywood Village: | 71.4% (5) |
| Kentucky: | 4.3% (3,464) |
| Cherrywood Village: | 28.6% (2) |
| Kentucky: | 4.0% (3,217) |
Place of birth for U.S.-born residents:
- This state: 233
- Other state: 103
- Northeast: 15
- Midwest: 49
- South: 25
- West: 14
63% of Cherrywood Village residents lived in the same house 5 years ago.
Out of people who lived in different houses, 74% lived in this county.
Out of people who lived in different counties, 6% lived in Kentucky.
Education attainment for males 25 years and older:
- No schooling: 0
- Nursery to 4th grade: 3
- 5th and 6th grade: 0
- 7th and 8th grade: 0
- 9th grade: 0
- 10th grade: 3
- 11th grade: 0
- 12th grade, no diploma: 3
- High school graduate (or equivalency): 15
- Less than 1 year of college: 2
- Some college more than 1 year, no degree: 9
- Associate degree: 8
- Bachelor's degree: 39
- Master's degree: 19
- Professional school degree: 4
- Doctorate degree: 1

Education attainment for females 25 years and older:
- No schooling: 0
- Nursery to 4th grade: 0
- 5th and 6th grade: 0
- 7th and 8th grade: 0
- 9th grade: 2
- 10th grade: 2
- 11th grade: 2
- 12th grade, no diploma: 0
- High school graduate (or equivalency): 21
- Less than 1 year of college: 20
- Some college more than 1 year, no degree: 17
- Associate degree: 1
- Bachelor's degree: 46
- Master's degree: 21
- Professional school degree: 8
- Doctorate degree: 4


Housing units in structures:
- One, detached: 151
- One, attached: 4

Private vs. public school enrollment:
| Here: | 84.2% |
| Kentucky: | 11.9% |
| Here: | 53.8% |
| Kentucky: | 10.6% |
| Here: | 0.0% |
| Kentucky: | 18.1% |


