Chittenden, VT (Vermont) Houses and Residents
| Chittenden: | $301,868 |
| Vermont: | $304,700 |
Total population: 1,258 (Urban population: 0, Rural population: 1,179 (11 farm, 1,168 nonfarm))
Houses: 579 (446 occupied: 352 owner occupied, 94 renter occupied)
| % of renters here: | 21% |
| State: | 26% |
Housing density: 8 houses/condos per square mile
Median price asked for vacant for-sale houses and condos in 2022 in this county: $156,718.
Median contract rent in 2022: $926 (lower quartile is $704, upper quartile is $1,308)
Median rent asked for vacant for-rent units in 2022: $1,199
Median gross rent in Chittenden, VT in 2022: $1,049
Housing units in Chittenden with a mortgage: 162 (10 second mortgage, 20 home equity loan, 2 both second mortgage and home equity loan)
Houses without a mortgage: 54


Latest news about housing in Chittenden, VT collected exclusively by city-data.com from local newspapers, TV, and radio stations

 | Dated and out of style homes (34 replies) |
| NPR Brave Little State Why Do People Leave Vermont (83 replies) |
| Crazy and/or artificial Vermont real estate market? (25 replies) |
| Southern Vermont Retirement Advice! Thank you! (22 replies) |
| Mountain Family considering moving from CO to VT (52 replies) |
| Mobile Home Parks in Chittenden County - Reviews? (1 reply) |

Household type by relationship:
Households: 59,324- In family households: 46,689 (10,990 male householders, 5,028 female householders)
12,287 spouses, 14,538 children (13,423 natural, 423 adopted, 692 stepchildren), 830 grandchildren, 337 brothers or sisters, 356 parents, foster children, 341 other relatives, 1,706 non-relatives
- In nonfamily households: 12,635 (4,693 male householders (3,474 living alone)), 5,273 female householders (4,364 living alone)), 2,669 nonrelatives
- In group quarters: 2,318 (551 institutionalized population)
10,211 married couples with children.
3,525 single-parent households (877 men, 2,648 women).
95.6% of residents of Chittenden speak English at home.
0.4% of residents speak Spanish at home (50% speak English very well, 50% speak English well).
3.7% of residents speak other Indo-European language at home (68% speak English very well, 22% speak English well, 10% speak English not well).
0.4% of residents speak Asian or Pacific Island language at home (50% speak English very well, 50% speak English not well).
Foreign born population: 31 (2.4%)
(35.5% of them are naturalized citizens)
| Here: | 6.4 |
| State: | 6.4 |
| Here: | 5.4 |
| State: | 3.9 |

- Bedrooms in owner-occupied houses and condos in Chittenden, Vermont
- 0no bedroom
- 61 bedroom
- 762 bedrooms
- 1803 bedrooms
- 674 bedrooms
- 235+ bedrooms

- Bedrooms in renter-occupied apartments in Chittenden, Vermont
- 3no bedroom
- 191 bedroom
- 182 bedrooms
- 363 bedrooms
- 164 bedrooms
- 25+ bedrooms

- Cars and other vehicles available in Chittenden in owner-occupied houses/condos
- 8no vehicle
- 691 vehicle
- 1832 vehicles
- 743 vehicles
- 164 vehicles
- 25+ vehicles

- Cars and other vehicles available in Chittenden in renter-occupied apartments
- 10no vehicle
- 251 vehicle
- 402 vehicles
- 133 vehicles
- 44 vehicles
- 25+ vehicles

- Rooms in owner-occupied houses in Chittenden, Vermont
- 01 room
- 22 rooms
- 23 rooms
- 314 rooms
- 525 rooms
- 886 rooms
- 687 rooms
- 558 rooms
- 549+ rooms

- Rooms in renter-occupied apartments in Chittenden, Vermont
- 31 room
- 82 rooms
- 73 rooms
- 164 rooms
- 265 rooms
- 126 rooms
- 107 rooms
- 78 rooms
- 59+ rooms


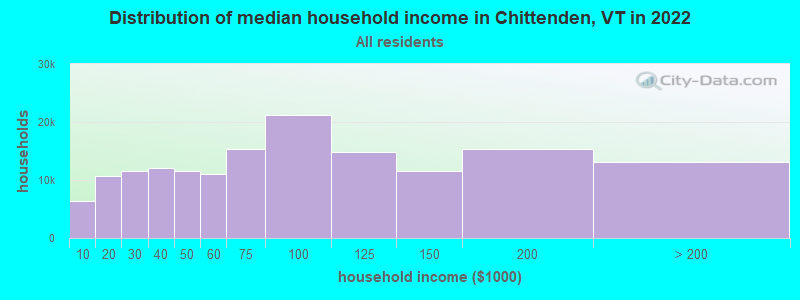
Chittenden, VT household income distribution

- 5,584Less than $10,000
- 11,400$10,000 to $19,999
- 13,089$20,000 to $29,999
- 15,234$30,000 to $39,999
- 14,129$40,000 to $49,999
- 13,768$50,000 to $59,999
- 18,325$60,000 to $74,999
- 27,737$75,000 to $99,999
- 18,367$100,000 to $124,999
- 14,664$125,000 to $149,999
- 18,621$150,000 to $199,999
- 16,820$200,000 or more
Percentage of workers working in this county: 92.3%
Number of people working at home: 121 (17.3% of all workers)
Travel time to work (commute)
- Less than 5 minutes: 20
- 5 to 9 minutes: 39
- 10 to 14 minutes: 58
- 15 to 19 minutes: 129
- 20 to 24 minutes: 173
- 25 to 29 minutes: 32
- 30 to 34 minutes: 91
- 35 to 39 minutes: 10
- 40 to 44 minutes: 5
- 45 to 59 minutes: 15
- 60 to 89 minutes: 23
- 90 or more minutes: 11
Means of transportation to work:
- Drove a car alone: 516 (80.4%)
- Carpooled: 56 (8.7%)
- Taxi: 2 (0.3%)
- Motorcycle: 3 (0.5%)
- Walked: 24 (3.7%)
- Other means: 5 (0.8%)
- Worked at home: 36 (5.6%)


- Year of entry for the foreign-born population in Chittenden, Vermont
- 21995 to March 2000
- 61990 to 1994
- 51985 to 1989
- 01980 to 1984
- 71975 to 1979
- 21970 to 1974
- 01965 to 1969
- 7Before 1965
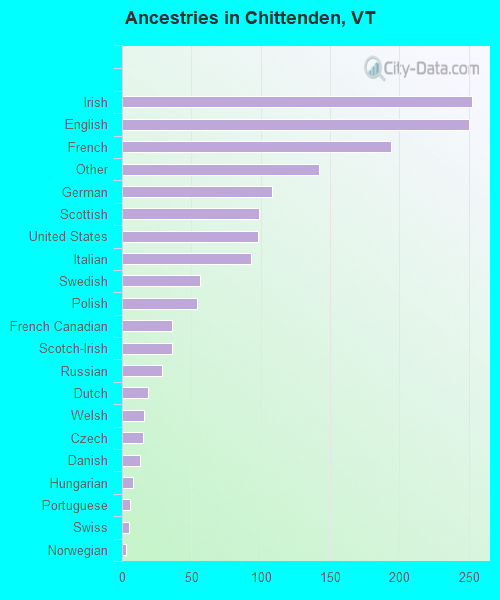
First ancestries reported:
- Irish: 252 (16.4%)
- English: 250 (16.3%)
- French: 194 (12.6%)
- Other: 142 (9.3%)
- German: 108 (7.0%)
- Scottish: 99 (6.5%)
- United States: 98 (6.4%)
- Italian: 93 (6.1%)
- Swedish: 56 (3.7%)
- Polish: 54 (3.5%)
- French Canadian: 36 (2.3%)
- Scotch-Irish: 36 (2.3%)
- Russian: 29 (1.9%)
- Dutch: 19 (1.2%)
- Welsh: 16 (1.0%)
- Czech: 15 (1.0%)
- Danish: 13 (0.8%)
- Hungarian: 8 (0.5%)
- Portuguese: 6 (0.4%)
- Swiss: 5 (0.3%)
- Norwegian: 3 (0.2%)
- Slovak: 2 (0.1%)
Most common places of birth for foreign-born residents (%):
| Chittenden: | 31.0% (9) |
| Vermont: | 1.7% (400) |
| Chittenden: | 17.2% (5) |
| Vermont: | 7.5% (1,744) |
| Chittenden: | 13.8% (4) |
| Vermont: | 7.2% (1,669) |
| Chittenden: | 10.3% (3) |
| Vermont: | 1.0% (226) |
| Chittenden: | 6.9% (2) |
| Vermont: | 0.7% (152) |
| Chittenden: | 6.9% (2) |
| Vermont: | 1.2% (268) |
| Chittenden: | 6.9% (2) |
| Vermont: | 0.3% (60) |
| Chittenden: | 6.9% (2) |
| Vermont: | 34.0% (7,912) |
Place of birth for U.S.-born residents:
- This state: 592
- Other state: 550
- Northeast: 435
- Midwest: 44
- South: 40
- West: 31
71% of Chittenden residents lived in the same house 5 years ago.
Out of people who lived in different houses, 56% lived in this county.
Out of people who lived in different counties, 9% lived in Vermont.
Education attainment for males 25 years and older:
- No schooling: 0
- Nursery to 4th grade: 0
- 5th and 6th grade: 0
- 7th and 8th grade: 15
- 9th grade: 10
- 10th grade: 9
- 11th grade: 2
- 12th grade, no diploma: 20
- High school graduate (or equivalency): 118
- Less than 1 year of college: 13
- Some college more than 1 year, no degree: 36
- Associate degree: 53
- Bachelor's degree: 83
- Master's degree: 31
- Professional school degree: 21
- Doctorate degree: 3

Education attainment for females 25 years and older:
- No schooling: 0
- Nursery to 4th grade: 0
- 5th and 6th grade: 0
- 7th and 8th grade: 14
- 9th grade: 3
- 10th grade: 4
- 11th grade: 3
- 12th grade, no diploma: 9
- High school graduate (or equivalency): 109
- Less than 1 year of college: 9
- Some college more than 1 year, no degree: 34
- Associate degree: 41
- Bachelor's degree: 99
- Master's degree: 60
- Professional school degree: 6
- Doctorate degree: 2


Housing units in structures:
- One, detached: 536
- Two: 10
- 3 or 4: 7
- Mobile homes: 26
Median worth of mobile homes: $82,147
Housing units lacking complete kitchen facilities: 1.9%

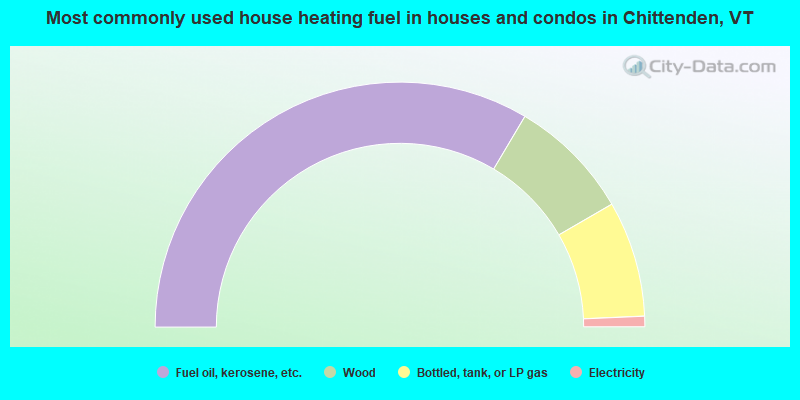
- 67.0%Fuel oil, kerosene, etc.
- 16.2%Wood
- 15.3%Bottled, tank, or LP gas
- 1.4%Electricity
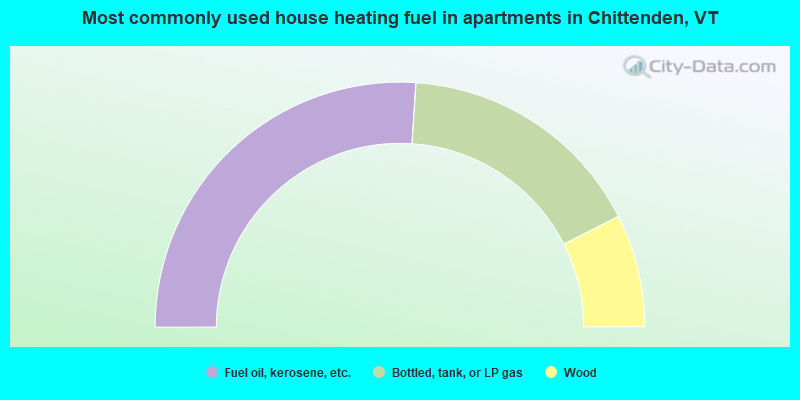
- 52.1%Fuel oil, kerosene, etc.
- 33.0%Bottled, tank, or LP gas
- 14.9%Wood
Private vs. public school enrollment:
| Here: | 4.1% |
| Vermont: | 7.2% |
| Here: | 8.7% |
| Vermont: | 10.4% |
| Here: | 13.3% |
| Vermont: | 37.7% |


