Housing density: 228 houses/condos per square mile
Median price asked for vacant for-sale houses and condos in 2022 in this county: $60,373.
Median contract rent in 2022: $905 (lower quartile is $619, upper quartile is $1,263)
Median rent asked for vacant for-rent units in 2022: $754
Median gross rent in Cicero, NY in 2022: $1,067
Housing units in Cicero with a mortgage: 6,103 (484 second mortgage, 805 home equity loan, 14 both second mortgage and home equity loan) Houses without a mortgage: 1,883
In family households: 358,168 (74,643 male householders, 40,640 female householders)
81,289 spouses, 131,650 children (123,979 natural, 3,067 adopted, 4,604 stepchildren), 7,646 grandchildren, 3,233 brothers or sisters, 3,161 parents, foster children, 3,596 other relatives, 10,424 non-relatives
In nonfamily households: 91,789 (33,178 male householders (25,133 living alone)), 39,225 female householders (32,473 living alone)), 19,386 nonrelatives
In group quarters: 17,069 (4,484 institutionalized population)
75,395 married couples with children.
33,683 single-parent households (6,194 men, 27,489 women).
95.2% of residents of Cicero speak English at home.
1.1% of residents speak Spanish at home (82% speak English very well, 7% speak English well, 11% speak English not well).
3.0% of residents speak other Indo-European language at home (79% speak English very well, 13% speak English well, 7% speak English not well).
0.5% of residents speak Asian or Pacific Island language at home (34% speak English very well, 32% speak English well, 34% speak English not well).
0.1% of residents speak other language at home (79% speak English very well, 21% speak English well).
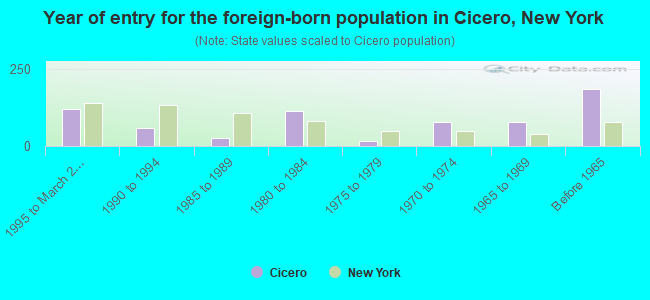
Foreign born population: 825 (2.9%)
(81.6% of them are naturalized citizens)
Year of entry for the foreign-born population in Cicero, New York
1201995 to March 2000
601990 to 1994
261985 to 1989
1151980 to 1984
151975 to 1979
771970 to 1974
791965 to 1969
184Before 1965
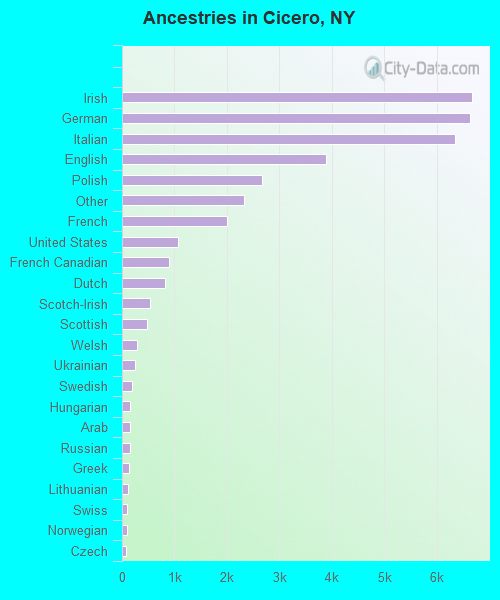
First ancestries reported:
Irish: 6,663 (18.4%)
German: 6,626 (18.3%)
Italian: 6,351 (17.6%)
English: 3,882 (10.7%)
Polish: 2,677 (7.4%)
Other: 2,319 (6.4%)
French: 2,009 (5.6%)
United States: 1,062 (2.9%)
French Canadian: 903 (2.5%)
Dutch: 816 (2.3%)
Scotch-Irish: 528 (1.5%)
Scottish: 470 (1.3%)
Welsh: 293 (0.8%)
Ukrainian: 249 (0.7%)
Swedish: 198 (0.5%)
Hungarian: 157 (0.4%)
Arab: 143 (0.4%)
Russian: 143 (0.4%)
Greek: 140 (0.4%)
Lithuanian: 107 (0.3%)
Swiss: 97 (0.3%)
Norwegian: 89 (0.2%)
Czech: 74 (0.2%)
Portuguese: 50 (0.1%)
Slovak: 48 (0.1%)
Danish: 35 (0.10%)
Subsaharan African: 15 (0.04%)
West Indian: 8 (0.02%)
Most common places of birth for foreign-born residents (%):
Italy
Cicero:
14.6% (99)
New York:
3.8% (147,729)
Germany
Cicero:
9.9% (67)
New York:
1.8% (69,327)
Pakistan
Cicero:
7.8% (53)
New York:
1.3% (51,055)
United Kingdom
Cicero:
7.0% (47)
New York:
1.6% (62,237)
Canada
Cicero:
6.1% (41)
New York:
1.4% (54,876)
Korea
Cicero:
4.6% (31)
New York:
2.5% (97,933)
Vietnam
Cicero:
4.4% (30)
New York:
0.6% (25,141)
Philippines
Cicero:
3.8% (26)
New York:
1.9% (72,408)
Taiwan
Cicero:
3.3% (22)
New York:
0.8% (30,473)
Jordan
Cicero:
3.0% (20)
New York:
0.1% (4,084)
Cuba
Cicero:
2.5% (17)
New York:
0.9% (36,642)
Venezuela
Cicero:
2.4% (16)
New York:
0.3% (10,645)
Ukraine
Cicero:
2.2% (15)
New York:
2.1% (82,238)
China, excluding Hong Kong and Taiwan
Cicero:
2.2% (15)
New York:
6.0% (233,766)
Colombia
Cicero:
2.2% (15)
New York:
2.9% (111,727)
Poland
Cicero:
2.1% (14)
New York:
2.4% (93,187)
France
Cicero:
1.9% (13)
New York:
0.5% (20,310)
Israel
Cicero:
1.9% (13)
New York:
0.8% (29,390)
India
Cicero:
1.8% (12)
New York:
3.0% (117,238)
Portugal
Cicero:
1.6% (11)
New York:
0.3% (13,508)
Place of birth for U.S.-born residents:
This state: 24,049
Other state: 3,147
Northeast: 1,463
Midwest: 758
South: 693
West: 233
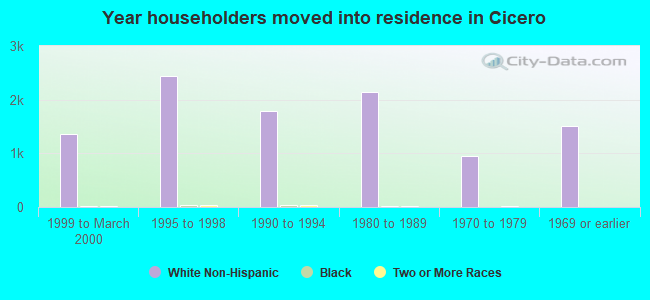
64% of Cicero residents lived in the same house 5 years ago. Out of people who lived in different houses, 67% lived in this county. Out of people who lived in different counties, 69% lived in New York.
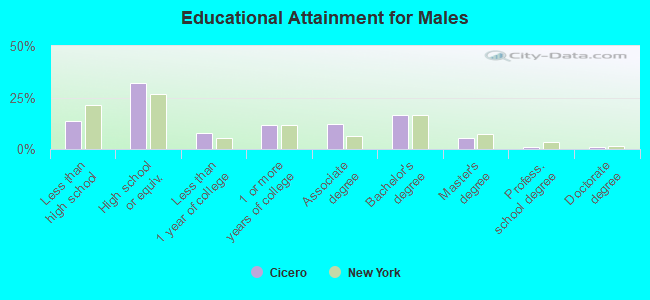
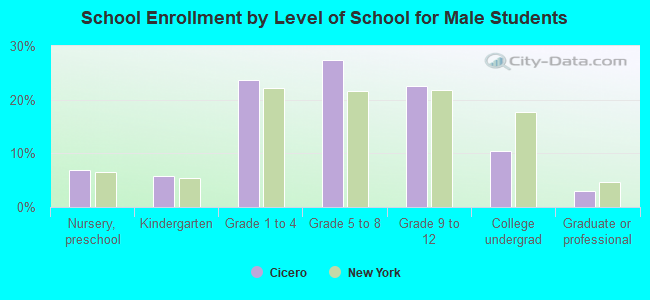
Education attainment for males 25 years and older:
No schooling: 9
Nursery to 4th grade: 21
5th and 6th grade: 40
7th and 8th grade: 217
9th grade: 112
10th grade: 297
11th grade: 204
12th grade, no diploma: 288
High school graduate (or equivalency): 2,855
Less than 1 year of college: 675
Some college more than 1 year, no degree: 1,036
Associate degree: 1,067
Bachelor's degree: 1,452
Master's degree: 457
Professional school degree: 65
Doctorate degree: 80
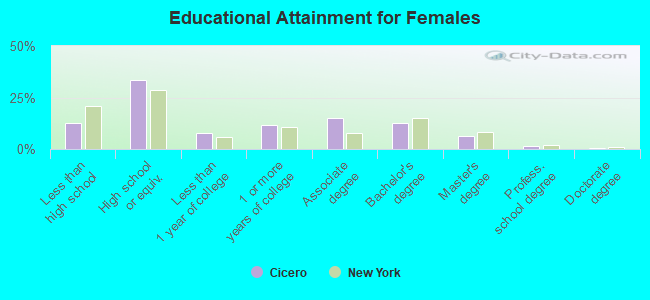
Education attainment for females 25 years and older:
No schooling: 7
Nursery to 4th grade: 4
5th and 6th grade: 32
7th and 8th grade: 163
9th grade: 172
10th grade: 324
11th grade: 184
12th grade, no diploma: 310
High school graduate (or equivalency): 3,209
Less than 1 year of college: 729
Some college more than 1 year, no degree: 1,098
Associate degree: 1,431
Bachelor's degree: 1,213
Master's degree: 584
Professional school degree: 119
Doctorate degree: 37
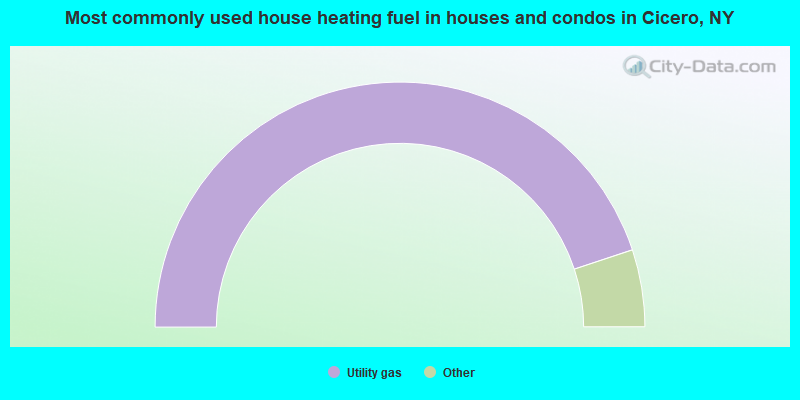
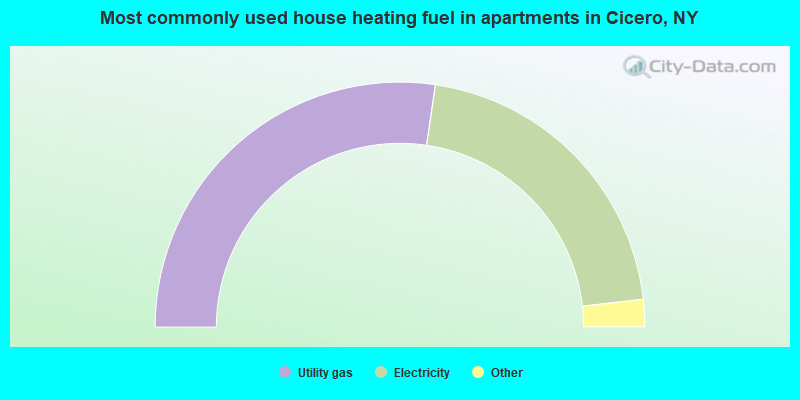
Housing units in structures:
One, detached: 9,025
One, attached: 343
Two: 320
3 or 4: 311
5 to 9: 363
10 to 19: 381
20 to 49: 165
50 or more: 42
Mobile homes: 83
Median worth of mobile homes: $201,135
Housing units lacking complete plumbing facilities: 0.2%
Housing units lacking complete kitchen facilities: 0.2%