Cincinnati, OH (Ohio) Houses and Residents
| Cincinnati: | $227,800 |
| Ohio: | $204,100 |
Mean price in 2022:
Detached houses: $340,197
Here: $340,197 State: $254,366 Townhouses or other attached units: $305,276
Here: $305,276 State: $225,733 In 2-unit structures: $156,045
Here: $156,045 State: $144,384 In 3-to-4-unit structures: $272,318
Here: $272,318 State: $203,002 In 5-or-more-unit structures: $306,048
Here: $306,048 State: $211,593
Total population: 298,165 (All urban)
Houses: 161,545 (145,749 occupied: 58,387 owner occupied, 87,362 renter occupied)
| % of renters here: | 60% |
| State: | 33% |
Housing density: 2,072 houses/condos per square mile
Median price asked for vacant for-sale houses and condos in 2022: $233,096.
Median contract rent in 2022: $777 (lower quartile is $577, upper quartile is $1,029)
Median rent asked for vacant for-rent units in 2022: $689
Median gross rent in Cincinnati, OH in 2022: $929
Housing units in Cincinnati with a mortgage: 39,601 (4,172 second mortgage, 248 home equity loan, 3,392 both second mortgage and home equity loan)
Houses without a mortgage: 1,163
Median household income for houses/condos with a mortgage: $107,176
Median household income for apartments without a mortgage: $63,977
Median monthly housing costs: $990
Compare current foreclosures in Cincinnati, OH:
| Photo | Address | Area | Beds / Baths | Price | Details |
|---|---|---|---|---|---|

|
#1
Werner Ave
Cincinnati, OH 45231
|
1,032 sq. feet
|
1 baths 2 beds |
$124,900
|
show details |

|
#2
Ramble Vw Unit 102
Cincinnati, OH 45231
|
1,129 sq. feet
|
2 baths 2 beds |
show details | |

|
#3
Terrydel Ln
Cincinnati, OH 45245
|
832 sq. feet
|
1 baths 2 beds |
show details | |

|
#4
Philloret Dr
Cincinnati, OH 45239
|
1,233 sq. feet
|
1 baths 3 beds |
show details | |

|
#5
Race Rd
Cincinnati, OH 45211
|
1,523 sq. feet
|
2 baths 3 beds |
show details | |

|
#6
Stormy Way
Cincinnati, OH 45230
|
2,448 sq. feet
|
2 baths 4 beds |
show details | |

|
#7
Cascade Rd
Cincinnati, OH 45240
|
1,423 sq. feet
|
1 baths 4 beds |
show details | |

|
#8
Perry St
Cincinnati, OH 45231
|
1,176 sq. feet
|
1 baths 2 beds |
show details | |

|
#9
Glade Ave
Cincinnati, OH 45230
|
1,138 sq. feet
|
1 baths 3 beds |
show details | |

|
#10
Bertus St
Cincinnati, OH 45217
|
1,488 sq. feet
|
2 baths 2 beds |
show details |
| Photo | Address | Area | Beds / Baths | Price | Details |
|---|---|---|---|---|---|

|
#11
Delhi Ave
Cincinnati, OH 45204
|
950 sq. feet
|
1 baths 3 beds |
show details | |

|
#12
Knollridge Ln
Cincinnati, OH 45231
|
1,307 sq. feet
|
2 baths 3 beds |
show details | |

|
#13
Richwood Ave
Cincinnati, OH 45208
|
2,336 sq. feet
|
2 baths 4 beds |
show details | |

|
#14
Andrew St
Cincinnati, OH 45217
|
1,172 sq. feet
|
1 baths 3 beds |
show details | |

|
#15
Creekhill Dr
Cincinnati, OH 45231
|
1,352 sq. feet
|
3 baths 3 beds |
show details | |

|
#16
Linda Dr
Cincinnati, OH 45238
|
1,131 sq. feet
|
2 baths 3 beds |
show details | |

|
#17
Regent Rd
Cincinnati, OH 45245
|
1,886 sq. feet
|
3 baths 3 beds |
show details | |

|
#18
Kirkup Ave
Cincinnati, OH 45213
|
2,142 sq. feet
|
2 baths 4 beds |
show details | |

|
#19
Williams St
Cincinnati, OH 45215
|
1,152 sq. feet
|
1 baths 2 beds |
show details | |

|
#20
Robb Ave
Cincinnati, OH 45211
|
1,248 sq. feet
|
1 baths 3 beds |
show details |
| Photo | Address | Area | Beds / Baths | Price | Details |
|---|---|---|---|---|---|

|
#21
Gertrude Ln
Cincinnati, OH 45231
|
1,300 sq. feet
|
1 baths 3 beds |
show details | |

|
#22
Coral Ave
Cincinnati, OH 45246
|
1,472 sq. feet
|
2 baths 3 beds |
show details | |

|
#23
Bent Creek Dr
Cincinnati, OH 45244
|
1,800 sq. feet
|
2 baths 4 beds |
show details | |

|
#24
Mayland Dr
Cincinnati, OH 45230
|
1,732 sq. feet
|
1 baths 2 beds |
show details | |

|
#25
Highland Ave
Cincinnati, OH 45202
|
876 sq. feet
|
1 baths 2 beds |
show details | |

|
#26
Verdale Dr
Cincinnati, OH 45230
|
1,359 sq. feet
|
1 baths 4 beds |
show details | |

|
#27
Desertgold Dr
Cincinnati, OH 45247
|
1,995 sq. feet
|
3 baths 4 beds |
show details | |

|
#28
Glenrose Ln
Cincinnati, OH 45244
|
925 sq. feet
|
1 baths 3 beds |
show details | |

|
#29
Donegal Dr
Cincinnati, OH 45236
|
1,568 sq. feet
|
2 baths 3 beds |
show details | |

|
#30
Shady Lawn Ter
Cincinnati, OH 45238
|
1,044 sq. feet
|
1 baths 3 beds |
show details |
| Photo | Address | Area | Beds / Baths | Price | Details |
|---|---|---|---|---|---|

|
#31
Claymore Ter
Cincinnati, OH 45238
|
1,232 sq. feet
|
1 baths 4 beds |
show details | |

|
#32
Hyannis Dr
Cincinnati, OH 45251
|
960 sq. feet
|
1 baths 3 beds |
show details | |

|
#33
Glenwood Ave
Cincinnati, OH 45217
|
1,296 sq. feet
|
1 baths 2 beds |
show details | |

|
#34
Deershadow Ln
Cincinnati, OH 45242
|
7,472 sq. feet
|
7 baths 7 beds |
show details | |

|
#35
Snowflake Ln
Cincinnati, OH 45251
|
1,732 sq. feet
|
2 baths 4 beds |
show details | |

|
#36
Minot Ave # 2
Cincinnati, OH 45209
|
1,886 sq. feet
|
2 baths 4 beds |
show details | |

|
#37
Feltz Ave
Cincinnati, OH 45211
|
1,394 sq. feet
|
1 baths 3 beds |
show details | |

|
#38
Beechmont Dr
Cincinnati, OH 45244
|
864 sq. feet
|
1 baths 2 beds |
show details | |

|
#39
Timber Trl
Cincinnati, OH 45224
|
2,310 sq. feet
|
2 baths 4 beds |
show details | |

|
#40
Knightsbridge Dr
Cincinnati, OH 45244
|
2,122 sq. feet
|
2 baths 4 beds |
show details |
| Photo | Address | Area | Beds / Baths | Price | Details |
|---|---|---|---|---|---|

|
#41
Stroschen Dr
Cincinnati, OH 45248
|
2,444 sq. feet
|
1 baths 4 beds |
show details | |

|
#42
Hopewell Rd
Cincinnati, OH 45242
|
1,572 sq. feet
|
3 baths 4 beds |
show details | |

|
#43
Chandler St
Cincinnati, OH 45227
|
816 sq. feet
|
1 baths 1 beds |
show details | |

|
#44
Fallshill Cir
Cincinnati, OH 45231
|
1,379 sq. feet
|
2 baths 3 beds |
show details | |

|
#45
Cannas Dr
Cincinnati, OH 45238
|
1,978 sq. feet
|
2 baths 4 beds |
show details | |

|
#46
Viscount Dr
Cincinnati, OH 45238
|
2,072 sq. feet
|
2 baths 4 beds |
show details | |

|
#47
Cornwall Dr
Cincinnati, OH 45231
|
986 sq. feet
|
2 baths 2 beds |
show details | |

|
#48
Ruddy Ct
Cincinnati, OH 45239
|
1,292 sq. feet
|
2 baths 3 beds |
show details | |

|
#49
Woodmere Ct
Cincinnati, OH 45238
|
832 sq. feet
|
1 baths 3 beds |
show details | |

|
Check over 1 million property listings on Foreclosure.com!
|
browse all offers | |||

Latest news about housing in Cincinnati, OH collected exclusively by city-data.com from local newspapers, TV, and radio stations

 | New to Cincinnati, with 3 kids, need rental home (15 replies) |
| Moving to Cincinnati, budget 300K (3 replies) |
| Moving from a rented condo to our own home. (16 replies) |
| New condos approved along streetcar line (30 replies) |
| Looking for non-apartment rental in Cincinnati area. Opinions, please? (11 replies) |
| Apartments in NKY Near/Inside I-275 (2 replies) |

Median year apartment built: 1966
Household type by relationship:
Households: 309,536- Male householders: 62,250 (29,741 living alone), Female householders: 83,499 (34,651 living alone)
33,771 spouses (33,007 opposite-sex spouses), 15,770 unmarried partners, (15,069 opposite-sex unmarried partners), 67,562 children (63,725 natural, 2,021 adopted, 1,816 stepchildren), 8,898 grandchildren, 2,085 brothers or sisters, 1,012 parents, 943 foster children, 3,860 other relatives, 15,928 non-relatives
- In group quarters: 13,958
Size of family households: 31,168 2-persons, 14,075 3-persons, 9,314 4-persons, 4,782 5-persons, 1,354 6-persons, 987 7-or-more-persons.
Size of nonfamily households: 64,392 1-person, 15,377 2-persons, 1,654 3-persons, 1,234 4-persons, 1,187 5-persons, 184 6-persons, 41 7-or-more-persons.
24,149 married couples with children.
27,042 single-parent households (3,097 men, 23,945 women).
90.9% of residents of Cincinnati speak English at home.
3.3% of residents speak Spanish at home (51% speak English very well, 14% speak English well, 24% speak English not well, 10% don't speak English at all).
2.8% of residents speak other Indo-European language at home (60% speak English very well, 28% speak English well, 12% speak English not well, 1% don't speak English at all).
1.4% of residents speak Asian or Pacific Island language at home (70% speak English very well, 20% speak English well, 8% speak English not well, 1% don't speak English at all).
1.5% of residents speak other language at home (60% speak English very well, 27% speak English well, 11% speak English not well, 2% don't speak English at all).
Foreign born population: 19,140 (6.2%)
(44.6% of them are naturalized citizens)
| Here: | 6.4 |
| State: | 6.7 |
| Here: | 3.8 |
| State: | 4.4 |

- Bedrooms in owner-occupied houses and condos in Cincinnati, Ohio
- 198no bedroom
- 2,6001 bedroom
- 16,2082 bedrooms
- 23,2683 bedrooms
- 10,7324 bedrooms
- 5,3815+ bedrooms

- Bedrooms in renter-occupied apartments in Cincinnati, Ohio
- 5,984no bedroom
- 38,7891 bedroom
- 27,0652 bedrooms
- 10,4213 bedrooms
- 3,4934 bedrooms
- 1,6105+ bedrooms

- Cars and other vehicles available in Cincinnati in owner-occupied houses/condos
- 2,424no vehicle
- 18,9291 vehicle
- 24,9692 vehicles
- 8,0483 vehicles
- 2,2854 vehicles
- 1,7325+ vehicles

- Cars and other vehicles available in Cincinnati in renter-occupied apartments
- 24,663no vehicle
- 44,1201 vehicle
- 13,9302 vehicles
- 2,8833 vehicles
- 6824 vehicles
- 1,0845+ vehicles

- Rooms in owner-occupied houses in Cincinnati, Ohio
- 1981 room
- 1012 rooms
- 1,8623 rooms
- 5,7724 rooms
- 10,0345 rooms
- 12,3726 rooms
- 9,4747 rooms
- 7,8788 rooms
- 10,6969+ rooms

- Rooms in renter-occupied apartments in Cincinnati, Ohio
- 4,1531 room
- 7,8782 rooms
- 24,7453 rooms
- 25,1784 rooms
- 11,6825 rooms
- 6,2206 rooms
- 3,4647 rooms
- 2,6718 rooms
- 1,3719+ rooms


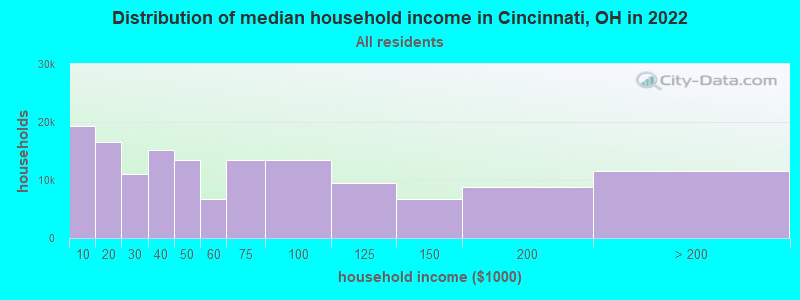
Cincinnati, OH household income distribution

- 19,328Less than $10,000
- 16,603$10,000 to $19,999
- 11,064$20,000 to $29,999
- 15,135$30,000 to $39,999
- 13,504$40,000 to $49,999
- 6,708$50,000 to $59,999
- 13,447$60,000 to $74,999
- 13,389$75,000 to $99,999
- 9,500$100,000 to $124,999
- 6,720$125,000 to $149,999
- 8,864$150,000 to $199,999
- 11,487$200,000 or more
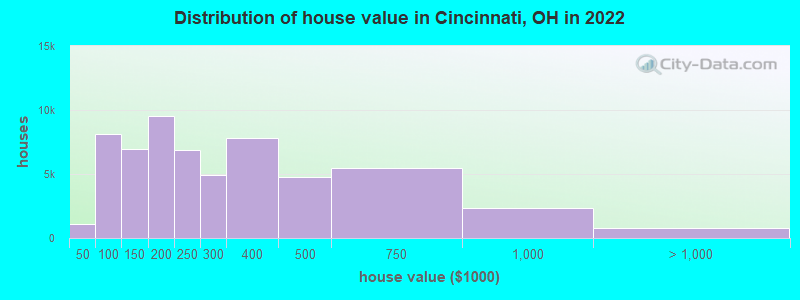
Home value of owner - occupied houses in 2022 in Cincinnati, OH
-
- 142Less than $10,000
- 65$10,000 to $14,999
- 117$15,000 to $19,999
- 204$20,000 to $24,999
- 172$30,000 to $34,999
- 36$35,000 to $39,999
- 340$40,000 to $49,999
- 1,028$50,000 to $59,999
- 1,075$60,000 to $69,999
- 2,527$70,000 to $79,999
- 1,234$80,000 to $89,999
- 1,887$90,000 to $99,999
- 2,914$100,000 to $124,999
- 4,056$125,000 to $149,999
- 5,510$150,000 to $174,999
- 4,052$175,000 to $199,999
- 6,897$200,000 to $249,999
- 4,883$250,000 to $299,999
- 7,851$300,000 to $399,999
- 4,745$400,000 to $499,999
- 5,507$500,000 to $749,999
- 2,369$750,000 to $999,999
- 745$1,000,000 to $1,499,999
- 31$2,000,000 or more
Rent paid by renters in 2022 in Cincinnati, OH
-
- 1,349Less than $100
- 455$100 to $149
- 1,466$150 to $199
- 2,963$200 to $249
- 1,166$250 to $299
- 1,499$300 to $349
- 963$350 to $399
- 1,241$400 to $449
- 2,579$450 to $499
- 5,252$500 to $549
- 4,334$550 to $599
- 3,551$600 to $649
- 5,164$650 to $699
- 6,942$700 to $749
- 6,748$750 to $799
- 9,711$800 to $899
- 7,437$900 to $999
- 8,091$1,000 to $1,249
- 4,972$1,250 to $1,499
- 6,008$1,500 to $1,999
- 1,612$2,000 to $2,499
- 720$2,500 to $2,999
- 516$3,000 to $3,499
- 275$3,500 or more
- 2,348No cash rent


Percentage of workers working in this county: 83.9%
Number of people working at home: 24,152 (15.2% of all workers)
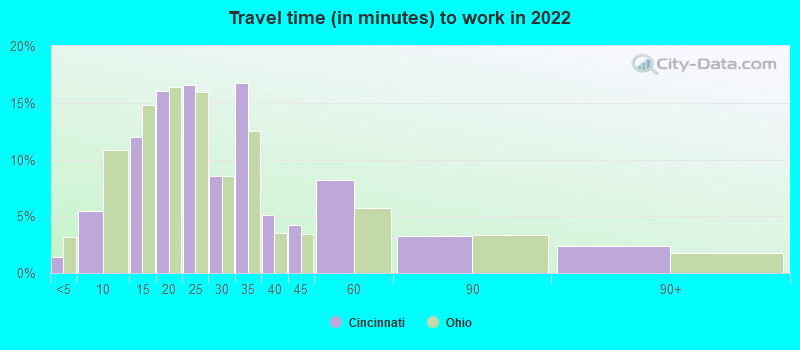
Travel time to work (commute)
- Less than 5 minutes: 2,637
- 5 to 9 minutes: 10,079
- 10 to 14 minutes: 21,784
- 15 to 19 minutes: 29,273
- 20 to 24 minutes: 23,299
- 25 to 29 minutes: 12,114
- 30 to 34 minutes: 18,446
- 35 to 39 minutes: 5,265
- 40 to 44 minutes: 1,963
- 45 to 59 minutes: 3,418
- 60 to 89 minutes: 3,506
- 90 or more minutes: 3,125
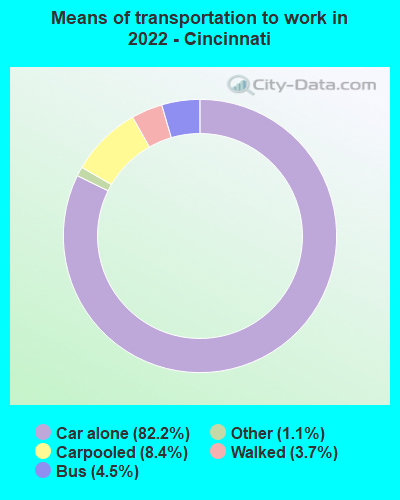
Means of transportation to work:
- Drove a car alone: 180,382 (74.0%)
- Carpooled: 18,357 (7.5%)
- Bus: 9,984 (4.1%)
- Taxi: 2,338 (1.0%)
- Bicycle: 157 (0.1%)
- Walked: 8,225 (3.4%)
- Worked at home: 24,152 (9.9%)

- Unemployment by race in 2022
- Unemployment rate for White non-Hispanic residents
- 3.4%Males
- 1.7%Females
- Unemployment rate for Black residents
- 6.8%Males
- 9.7%Females
- Unemployment rate for American Indian and Alaska Native residents
- 1.9%Males
- 34.6%Females
- Unemployment rate for Asian residents
- 3.6%Males
- 9.6%Females
- Unemployment rate for other race residents
- 1.9%Males
- 6.2%Females
- Unemployment rate for two or more race residents
- 5.5%Males
- 14.5%Females
- Unemployment rate for Hispanic or Latino residents
- 2.8%Males
- 18.3%Females

- Year of entry for the foreign-born population in Cincinnati, Ohio
- 12,0962010 or later
- 4,5192000 to 2009
- 2,5541990 to 1999
- 1,9101980 to 1989
- 1,1201970 to 1979
- 1,894Before 1970
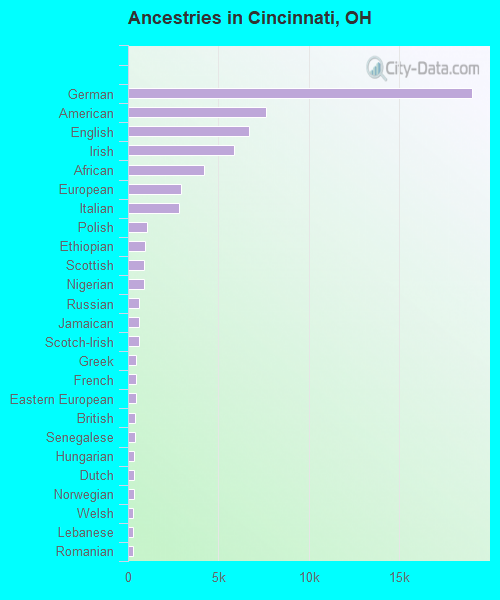
First ancestries reported:
- German: 19,018 (11.4%)
- American: 7,629 (4.6%)
- English: 6,675 (4.0%)
- Irish: 5,878 (3.5%)
- African: 4,217 (2.5%)
- European: 2,937 (1.8%)
- Italian: 2,798 (1.7%)
- Polish: 1,065 (0.6%)
- Ethiopian: 966 (0.6%)
- Scottish: 884 (0.5%)
- Nigerian: 878 (0.5%)
- Russian: 628 (0.4%)
- Jamaican: 609 (0.4%)
- Scotch-Irish: 594 (0.4%)
- Greek: 467 (0.3%)
- French: 465 (0.3%)
- Eastern European: 463 (0.3%)
- British: 401 (0.2%)
- Senegalese: 383 (0.2%)
- Hungarian: 343 (0.2%)
- Dutch: 319 (0.2%)
- Norwegian: 308 (0.2%)
- Welsh: 270 (0.2%)
- Lebanese: 255 (0.2%)
- Romanian: 252 (0.2%)
- Ukrainian: 251 (0.2%)
- Egyptian: 203 (0.1%)
- Haitian: 202 (0.1%)
- Ghanaian: 200 (0.1%)
- French Canadian: 193 (0.1%)
- Ugandan: 192 (0.1%)
- Iranian: 186 (0.1%)
- Slovak: 185 (0.1%)
- Northern European: 169 (0.1%)
- Turkish: 151 (0.09%)
- Canadian: 142 (0.09%)
- Lithuanian: 141 (0.08%)
- Kenyan: 140 (0.08%)
- Afghan: 133 (0.08%)
- Brazilian: 121 (0.07%)
- Slovene: 118 (0.07%)
- Croatian: 117 (0.07%)
- Swedish: 116 (0.07%)
- Finnish: 99 (0.06%)
- Portuguese: 93 (0.06%)
- Bulgarian: 88 (0.05%)
- Scandinavian: 87 (0.05%)
- Sudanese: 81 (0.05%)
- Albanian: 73 (0.04%)
- Moroccan: 71 (0.04%)
- Danish: 69 (0.04%)
- Armenian: 65 (0.04%)
- Slavic: 56 (0.03%)
- Arab: 55 (0.03%)
- Czech: 47 (0.03%)
- South African: 44 (0.03%)
- Zimbabwean: 40 (0.02%)
- Belgian: 39 (0.02%)
- Serbian: 36 (0.02%)
- Macedonian: 35 (0.02%)
- Jordanian: 35 (0.02%)
- Sierra Leonean: 34 (0.02%)
- Swiss: 33 (0.02%)
- Palestinian: 29 (0.02%)
- Czechoslovakian: 27 (0.02%)
- Austrian: 26 (0.02%)
- Yugoslavian: 23 (0.01%)
- Celtic: 21 (0.01%)
- Cajun: 20 (0.01%)
- Barbadian: 19 (0.01%)
- Australian: 17 (0.01%)
- Guyanese: 16 (0.01%)
- Icelander: 16 (0.01%)
- Israeli: 14 (0.01%)
- Alsatian: 12 (0.01%)
- Luxembourger: 9 (0.01%)
Most common places of birth for foreign-born residents (%):
| Cincinnati: | 8.7% (1,860) |
| Ohio: | 1.6% (9,312) |
| Cincinnati: | 6.2% (1,336) |
| Ohio: | 11.6% (66,525) |
| Cincinnati: | 6.2% (1,327) |
| Ohio: | 0.3% (1,682) |
| Cincinnati: | 5.2% (1,110) |
| Ohio: | 6.2% (35,703) |
| Cincinnati: | 4.7% (998) |
| Ohio: | 7.8% (44,796) |
| Cincinnati: | 4.3% (918) |
| Ohio: | 1.5% (8,380) |
| Cincinnati: | 4.0% (860) |
| Ohio: | 0.7% (4,187) |
| Cincinnati: | 3.0% (638) |
| Ohio: | 1.2% (7,029) |
| Cincinnati: | 2.9% (617) |
| Ohio: | 0.9% (5,331) |
| Cincinnati: | 2.7% (584) |
| Ohio: | 1.1% (6,096) |
| Cincinnati: | 2.6% (557) |
| Ohio: | 2.0% (11,398) |
| Cincinnati: | 2.5% (537) |
| Ohio: | 1.0% (5,553) |
| Cincinnati: | 2.1% (447) |
| Ohio: | 0.5% (3,061) |
| Cincinnati: | 1.9% (416) |
| Ohio: | 0.5% (3,042) |
| Cincinnati: | 1.9% (406) |
| Ohio: | 1.9% (10,960) |
| Cincinnati: | 1.9% (398) |
| Ohio: | 2.6% (14,988) |
| Cincinnati: | 1.7% (372) |
| Ohio: | 0.4% (2,052) |
| Cincinnati: | 1.6% (337) |
| Ohio: | 3.1% (17,818) |
Place of birth for U.S.-born residents:
- This state: 214,517
- Other state: 72,818
- Northeast: 13,897
- Midwest: 17,833
- South: 34,851
- West: 6,237
81.8% of Cincinnati residents lived in the same house 1 years ago.
Out of people who lived in different houses, 36.4% lived in this county.
Out of people who lived in different counties, 49.1% lived in Ohio.
| Cincinnati: | 81.8% |
| State average: | 87.8% |
Education attainment for males 25 years and older:
- No schooling: 1,444
- Nursery to 4th grade: 258
- 5th and 6th grade: 377
- 7th and 8th grade: 961
- 9th grade: 994
- 10th grade: 2,014
- 11th grade: 1,496
- 12th grade, no diploma: 1,911
- High school graduate (or equivalency): 22,047
- Less than 1 year of college: 4,620
- Some college more than 1 year, no degree: 11,025
- Associate degree: 6,325
- Bachelor's degree: 22,745
- Master's degree: 10,462
- Professional school degree: 4,198
- Doctorate degree: 2,629

Education attainment for females 25 years and older:
- No schooling: 1,219
- Nursery to 4th grade: 183
- 5th and 6th grade: 154
- 7th and 8th grade: 1,153
- 9th grade: 686
- 10th grade: 1,932
- 11th grade: 3,719
- 12th grade, no diploma: 2,166
- High school graduate (or equivalency): 29,368
- Less than 1 year of college: 5,950
- Some college more than 1 year, no degree: 12,093
- Associate degree: 7,981
- Bachelor's degree: 23,090
- Master's degree: 12,443
- Professional school degree: 5,090
- Doctorate degree: 2,170


Housing units in structures:
- One, detached: 63,277
- One, attached: 8,874
- Two: 12,721
- 3 or 4: 17,125
- 5 to 9: 10,064
- 10 to 19: 18,537
- 20 to 49: 11,495
- 50 or more: 19,103
- Mobile homes: 349
Housing units lacking complete kitchen facilities in 2022: 2.5%
House/condo owner moved in on average 11 years ago
Renter moved in on average 2 years ago

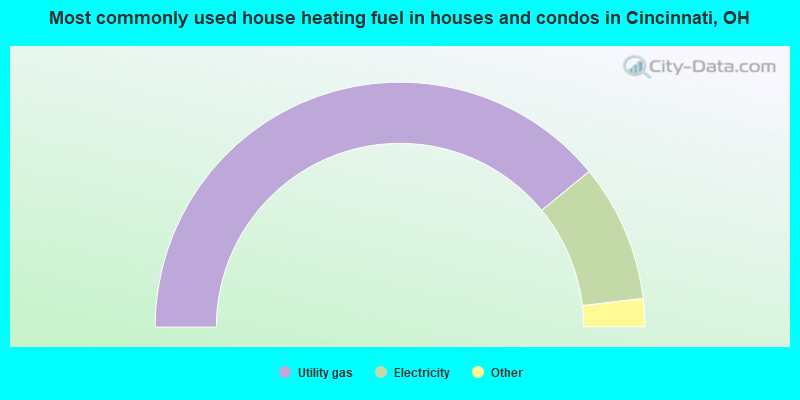
- 78.1%Utility gas
- 18.2%Electricity
- 2.3%Bottled, tank, or LP gas
- 0.5%Other fuel
- 0.4%No fuel used
- 0.2%Fuel oil, kerosene, etc.
- 0.2%Wood
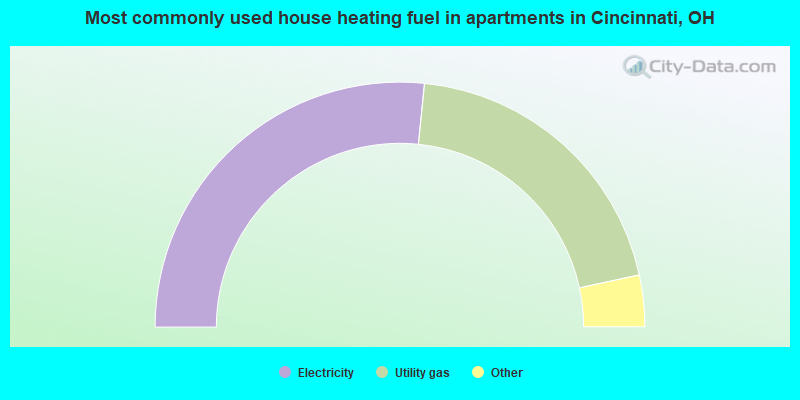
- 53.2%Electricity
- 40.0%Utility gas
- 2.5%Bottled, tank, or LP gas
- 2.3%No fuel used
- 1.5%Other fuel
- 0.3%Solar energy
- 0.2%Fuel oil, kerosene, etc.
Private vs. public school enrollment:
| Here: | 25.7% |
| Ohio: | 16.0% |
| Here: | 25.1% |
| Ohio: | 13.1% |
| Here: | 14.8% |
| Ohio: | 22.3% |


