Clancy, MT (Montana) Houses and Residents
| Clancy: | $451,258 |
| Montana: | $366,400 |
Mean price in 2022:
Detached houses: $489,294
Here: $489,294 State: $518,333 Mobile homes: $198,645
Here: $198,645 State: $139,111
Total population: 1,661 (Urban population: 0, Rural population: 1,467 (4 farm, 1,463 nonfarm))
Houses: 729 (666 occupied: 583 owner occupied, 98 renter occupied)
| % of renters here: | 14% |
| State: | 31% |
Housing density: 20 houses/condos per square mile
Median price asked for vacant for-sale houses and condos in 2022 in this county: $237,247.
Median contract rent in 2022: $770
Median rent asked for vacant for-rent units in 2022: $194
Median gross rent in Clancy, MT in 2022: $-687,885,009
Housing units in Clancy with a mortgage: 355 (71 second mortgage, 6 home equity loan, 19 both second mortgage and home equity loan)
Houses without a mortgage: 43
Median household income for houses/condos with a mortgage: $119,213
Median household income for apartments without a mortgage: $63,451
Median monthly housing costs: $1,369
Compare current foreclosures near Clancy, MT:
| Photo | Address | Area | Beds / Baths | Price | Details |
|---|---|---|---|---|---|

|
#1
Wilder Ave
Helena, MT 59602
|
2,814 sq. feet
|
4 baths 6 beds |
show details | |

|
#2
Buckskin Dr
Helena, MT 59602
|
2,128 sq. feet
|
2 baths 4 beds |
show details | |

|
#3
Stacia Ave
Helena, MT 59601
|
1,057 sq. feet
|
1 baths 2 beds |
show details | |

|
#4
Griffin Rd
Helena, MT 59602
|
1,716 sq. feet
|
3 baths 5 beds |
show details | |

|
#5
Kt Ln
Helena, MT 59602
|
2,816 sq. feet
|
2 baths 2 beds |
show details | |

|
#6
Dutchman Ct
Helena, MT 59602
|
1,170 sq. feet
|
2 baths 3 beds |
show details | |

|
#7
Saint John Road
East Helena, MT 59635
|
2,096 sq. feet
|
2 baths 3 beds |
show details | |

|
#8
Lariat Rd
Helena, MT 59602
|
3,436 sq. feet
|
3 baths 5 beds |
show details | |

|
#9
Last Straw Dr
Helena, MT 59602
|
2,281 sq. feet
|
2 baths 3 beds |
show details | |

|
#10
Kelly Rd
Helena, MT 59602
|
1,008 sq. feet
|
1 baths 3 beds |
show details |
| Photo | Address | Area | Beds / Baths | Price | Details |
|---|---|---|---|---|---|

|
#11
Concord Rd
Helena, MT 59602
|
1,839 sq. feet
|
2 baths 3 beds |
show details | |

|
#12
Western Dr
Helena, MT 59602
|
1,216 sq. feet
|
2 baths 3 beds |
show details | |

|
#13
Riviera Dr
Helena, MT 59602
|
924 sq. feet
|
1 baths 2 beds |
show details | |

|
#14
Joslyn St, Trlr 110
Helena, MT 59601
|
576 sq. feet
|
1 baths 2 beds |
show details | |

|
#15
E 13th St
Helena, MT 59601
|
908 sq. feet
|
1 baths 1 beds |
show details | |

|
#16
Elkview Rd
East Helena, MT 59635
|
924 sq. feet
|
1 baths 3 beds |
show details | |

|
#17
Waukesha Ave
Helena, MT 59601
|
- sq. feet
|
- baths - beds |
show details | |

|
#18
Tizer Lake Rd
Jefferson City, MT 59638
|
- sq. feet
|
- baths - beds |
show details | |

|
#19
E Broadway St Apt 11d
Helena, MT 59601
|
- sq. feet
|
- baths - beds |
show details | |

|
#20
Wickes Rd
Jefferson City, MT 59638
|
- sq. feet
|
- baths - beds |
show details |
| Photo | Address | Area | Beds / Baths | Price | Details |
|---|---|---|---|---|---|

|
#21
1/2 South Rodney Street
Helena, MT 59601
|
- sq. feet
|
- baths - beds |
show details | |

|
#22
E Clark St
East Helena, MT 59635
|
- sq. feet
|
- baths - beds |
show details | |

|
#23
N Benton Ave
Helena, MT 59601
|
- sq. feet
|
- baths - beds |
show details | |

|
#24
Poplar St
Helena, MT 59601
|
- sq. feet
|
- baths - beds |
show details | |

|
#25
Aspen St # 520
Helena, MT 59601
|
- sq. feet
|
- baths - beds |
show details | |

|
#26
Encore Way
Helena, MT 59602
|
- sq. feet
|
- baths - beds |
show details | |

|
#27
Claim Jumper Dr
Helena, MT 59602
|
- sq. feet
|
- baths - beds |
show details | |

|
#28
Colter Loop Dr
Helena, MT 59602
|
- sq. feet
|
- baths - beds |
show details | |

|
#29
Legend Loop, Apt 301
Helena, MT 59602
|
- sq. feet
|
- baths - beds |
show details | |

|
#30
Scott Dr
Helena, MT 59601
|
- sq. feet
|
- baths - beds |
show details |
| Photo | Address | Area | Beds / Baths | Price | Details |
|---|---|---|---|---|---|

|
#31
Cole Ave Apt 3
Helena, MT 59601
|
- sq. feet
|
- baths - beds |
show details | |

|
#32
Highway 282
Jefferson City, MT 59638
|
- sq. feet
|
- baths - beds |
show details | |

|
#33
Saint John Rd E
Helena, MT 59601
|
- sq. feet
|
- baths - beds |
show details | |

|
#34
N Washington St Apt 103
Helena, MT 59601
|
- sq. feet
|
- baths - beds |
show details | |

|
Check over 1 million property listings on Foreclosure.com!
|
browse all offers | |||

Latest news about housing in Clancy, MT collected exclusively by city-data.com from local newspapers, TV, and radio stations

 | Advice on a good apt., condo, townhouse for rent in Helena? (8 replies) |
| From Chicago to Montana (26 replies) |
| Describe the Major Montana Cities (11 replies) |
| Nice small towns and schools (23 replies) |
| Interesting article about Californians and moving (24 replies) |
| Montanans Relocating Elseware in Montana (45 replies) |

Median year apartment built: 1999
Household type by relationship:
Households: 2,025- Male householders: 307 (25 living alone), Female householders: 363 (105 living alone)
505 spouses (505 opposite-sex spouses), 15 unmarried partners, (15 opposite-sex unmarried partners), 720 children (666 natural, 16 adopted, 38 stepchildren), 27 grandchildren, 0 brothers or sisters, 9 parents, 0 foster children, 11 other relatives, 0 non-relatives
- In group quarters: 64
Size of family households: 250 2-persons, 79 3-persons, 108 4-persons, 72 5-persons, 18 6-persons, 11 7-or-more-persons.
Size of nonfamily households: 131 1-person, 8 2-persons.
495 married couples with children.
0 single-parent households (0 men, 0 women).
98.2% of residents of Clancy speak English at home.
0.6% of residents speak other Indo-European language at home (42% speak English very well, 58% speak English well).
0.3% of residents speak Asian or Pacific Island language at home (100% speak English not well).
0.7% of residents speak other language at home (100% speak English very well).
Foreign born population: 13 (0.6%)
(92.3% of them are naturalized citizens)
| Here: | 7.8 |
| State: | 6.4 |
| Here: | 5.2 |
| State: | 4.2 |

- Bedrooms in owner-occupied houses and condos in Clancy, Montana
- 4no bedroom
- 61 bedroom
- 512 bedrooms
- 2113 bedrooms
- 1904 bedrooms
- 1205+ bedrooms

- Bedrooms in renter-occupied apartments in Clancy, Montana
- 16no bedroom
- 01 bedroom
- 422 bedrooms
- 73 bedrooms
- 174 bedrooms
- 175+ bedrooms

- Cars and other vehicles available in Clancy in owner-occupied houses/condos
- 11no vehicle
- 241 vehicle
- 1902 vehicles
- 2603 vehicles
- 764 vehicles
- 215+ vehicles

- Cars and other vehicles available in Clancy in renter-occupied apartments
- 0no vehicle
- 331 vehicle
- 342 vehicles
- 223 vehicles
- 84 vehicles
- 05+ vehicles

- Rooms in owner-occupied houses in Clancy, Montana
- 41 room
- 02 rooms
- 03 rooms
- 474 rooms
- 325 rooms
- 636 rooms
- 997 rooms
- 1288 rooms
- 2109+ rooms

- Rooms in renter-occupied apartments in Clancy, Montana
- 101 room
- 52 rooms
- 03 rooms
- 84 rooms
- 335 rooms
- 06 rooms
- 07 rooms
- 08 rooms
- 419+ rooms


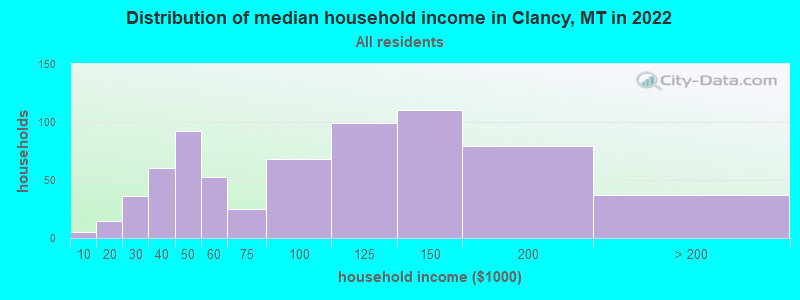
Clancy, MT household income distribution

- 5Less than $10,000
- 15$10,000 to $19,999
- 36$20,000 to $29,999
- 60$30,000 to $39,999
- 92$40,000 to $49,999
- 53$50,000 to $59,999
- 25$60,000 to $74,999
- 68$75,000 to $99,999
- 99$100,000 to $124,999
- 110$125,000 to $149,999
- 79$150,000 to $199,999
- 37$200,000 or more
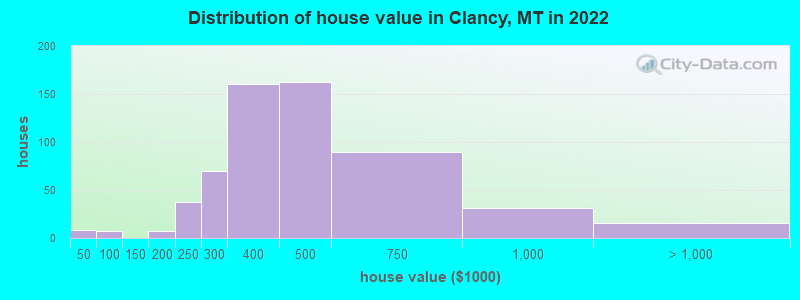
Home value of owner - occupied houses in 2022 in Clancy, MT
-
- 3Less than $10,000
- 3$25,000 to $29,999
- 6$70,000 to $79,999
- 7$175,000 to $199,999
- 36$200,000 to $249,999
- 70$250,000 to $299,999
- 159$300,000 to $399,999
- 163$400,000 to $499,999
- 90$500,000 to $749,999
- 30$750,000 to $999,999
- 16$1,500,000 to $1,999,999
Rent paid by renters in 2022 in Clancy, MT
-
- 6$150 to $199
- 6$450 to $499
- 14$700 to $749
- 7$750 to $799
- 7$1,000 to $1,249
- 33$3,000 to $3,499
- 33No cash rent


Percentage of workers working in this county: 35.9%
Number of people working at home: 136 (15.4% of all workers)
Travel time to work (commute)
- Less than 5 minutes: 30
- 5 to 9 minutes: 49
- 10 to 14 minutes: 49
- 15 to 19 minutes: 263
- 20 to 24 minutes: 219
- 25 to 29 minutes: 12
- 30 to 34 minutes: 80
- 35 to 39 minutes: 0
- 40 to 44 minutes: 11
- 45 to 59 minutes: 11
- 60 to 89 minutes: 12
- 90 or more minutes: 11
Means of transportation to work:
- Drove a car alone: 730 (87.0%)
- Carpooled: 62 (7.4%)
- Bicycle: 2 (0.2%)
- Walked: 8 (1.0%)
- Other means: 2 (0.2%)
- Worked at home: 35 (4.2%)

- Unemployment by race in 2022
- Unemployment rate for White non-Hispanic residents
- 0.9%Males
- 1.5%Females

- Year of entry for the foreign-born population in Clancy, Montana
- 02010 or later
- 02000 to 2009
- 01990 to 1999
- 61980 to 1989
- 01970 to 1979
- 2Before 1970
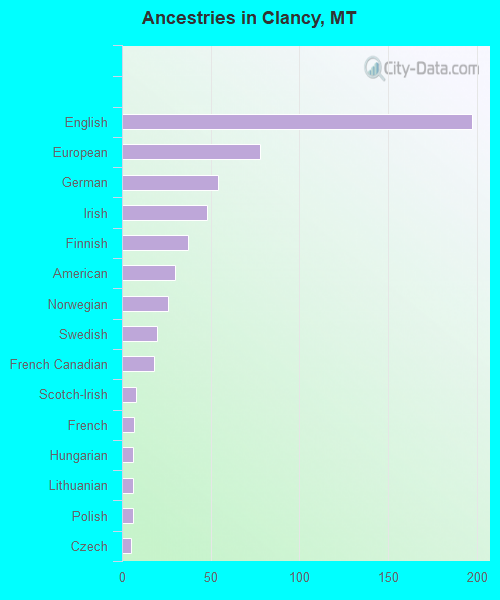
First ancestries reported:
- English: 197 (31.5%)
- European: 78 (12.5%)
- German: 54 (8.6%)
- Irish: 48 (7.7%)
- Finnish: 37 (5.9%)
- American: 30 (4.8%)
- Norwegian: 26 (4.2%)
- Swedish: 20 (3.2%)
- French Canadian: 18 (2.9%)
- Scotch-Irish: 8 (1.3%)
- French: 7 (1.1%)
- Hungarian: 6 (1.0%)
- Lithuanian: 6 (1.0%)
- Polish: 6 (1.0%)
- Czech: 5 (0.8%)
Most common places of birth for foreign-born residents (%):
| Clancy: | 92.3% (12) |
| Montana: | 14.2% (3,503) |
Place of birth for U.S.-born residents:
- This state: 1,017
- Other state: 997
- Northeast: 75
- Midwest: 301
- South: 122
- West: 497
92.1% of Clancy residents lived in the same house 1 years ago.
Out of people who lived in different houses, 7.1% lived in this county.
Out of people who lived in different counties, 78.7% lived in Montana.
| Clancy: | 92.1% |
| State average: | 86.7% |
Education attainment for males 25 years and older:
- No schooling: 0
- Nursery to 4th grade: 0
- 5th and 6th grade: 0
- 7th and 8th grade: 19
- 9th grade: 0
- 10th grade: 0
- 11th grade: 21
- 12th grade, no diploma: 0
- High school graduate (or equivalency): 184
- Less than 1 year of college: 42
- Some college more than 1 year, no degree: 57
- Associate degree: 69
- Bachelor's degree: 130
- Master's degree: 42
- Professional school degree: 15
- Doctorate degree: 25

Education attainment for females 25 years and older:
- No schooling: 0
- Nursery to 4th grade: 0
- 5th and 6th grade: 0
- 7th and 8th grade: 17
- 9th grade: 5
- 10th grade: 4
- 11th grade: 0
- 12th grade, no diploma: 0
- High school graduate (or equivalency): 223
- Less than 1 year of college: 23
- Some college more than 1 year, no degree: 121
- Associate degree: 74
- Bachelor's degree: 216
- Master's degree: 31
- Professional school degree: 15
- Doctorate degree: 7


Housing units in structures:
- One, detached: 686
- Mobile homes: 42
Median worth of mobile homes: $196,196
House/condo owner moved in on average 13 years ago
Renter moved in on average 3 years ago

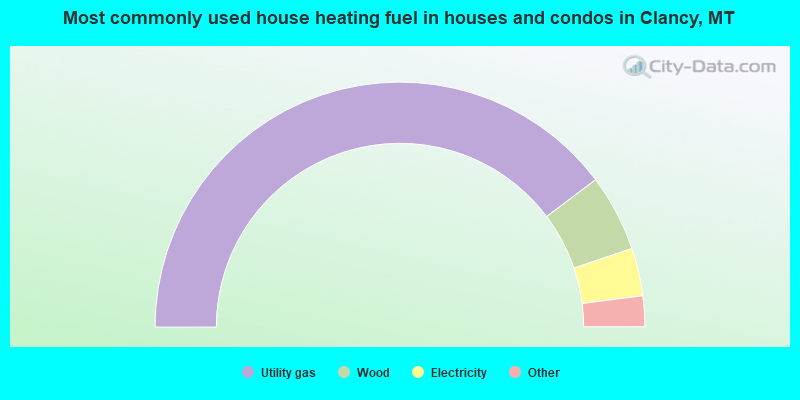
- 79.7%Utility gas
- 10.2%Wood
- 6.3%Electricity
- 2.3%Other fuel
- 1.4%Bottled, tank, or LP gas
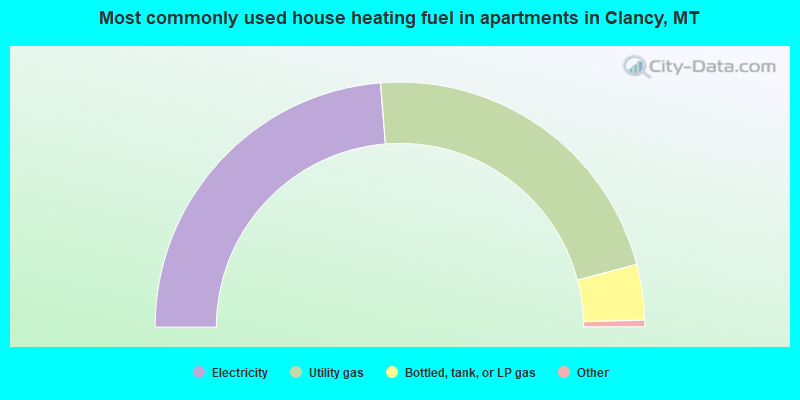
- 47.9%Electricity
- 44.7%Utility gas
- 7.4%Bottled, tank, or LP gas
Private vs. public school enrollment:
| Here: | 20.1% |
| Montana: | 15.3% |
| Here: | 0.0% |
| Montana: | 12.2% |
| Here: | 65.1% |
| Montana: | 15.0% |


