Clarkrange, TN (Tennessee) Houses and Residents
| Clarkrange: | $184,492 |
| Tennessee: | $284,800 |
Total population: 4,205 (Urban population: 0, Rural population: 4,020 (272 farm, 3,748 nonfarm))
Houses: 1,702 (1,529 occupied: 1,287 owner occupied, 242 renter occupied)
| % of renters here: | 16% |
| State: | 33% |
Housing density: 14 houses/condos per square mile
Median price asked for vacant for-sale houses and condos in 2022 in this county: $247,101.
Median contract rent in 2022: $609 (lower quartile is $344, upper quartile is $670)
Median rent asked for vacant for-rent units in 2022: $712
Median gross rent in Clarkrange, TN in 2022: $859
Housing units in Clarkrange with a mortgage: 309 (28 second mortgage, 0 home equity loan, 0 both second mortgage and home equity loan)
Houses without a mortgage: 267
Compare current foreclosures near Clarkrange, TN:
| Photo | Address | Area | Beds / Baths | Price | Details |
|---|---|---|---|---|---|

|
#1
Jonesville Rd
Clarkrange, TN 38553
|
1,400 sq. feet
|
1 baths - beds |
show details | |

|
#2
Page Rd
Clarkrange, TN 38553
|
1,184 sq. feet
|
1 baths - beds |
show details | |

|
#3
S Shady Lane Loop
Clarkrange, TN 38553
|
1,066 sq. feet
|
1 baths - beds |
show details | |

|
#4
Baldwin Gulf Rd
Clarkrange, TN 38553
|
840 sq. feet
|
- baths - beds |
show details | |

|
#5
Phillips Subdivision Rd
Clarkrange, TN 38553
|
- sq. feet
|
- baths - beds |
show details | |

|
#6
Jonesville Rd
Clarkrange, TN 38553
|
- sq. feet
|
- baths - beds |
show details | |

|
#7
Lynn Leigh Loop
Jamestown, TN 38556
|
1,334 sq. feet
|
2 baths - beds |
show details | |

|
#8
Shoemake Rd
Crossville, TN 38571
|
1,232 sq. feet
|
1 baths - beds |
show details | |

|
#9
Tom Welch Rd
Crossville, TN 38571
|
1,640 sq. feet
|
1 baths - beds |
show details | |

|
#10
Smallwood Rd
Jamestown, TN 38556
|
1,482 sq. feet
|
2 baths - beds |
show details |
| Photo | Address | Area | Beds / Baths | Price | Details |
|---|---|---|---|---|---|

|
#11
Clarkrange Hwy
Monterey, TN 38574
|
1,708 sq. feet
|
2 baths - beds |
show details | |

|
#12
Hall Rd
Crossville, TN 38571
|
950 sq. feet
|
1 baths - beds |
show details | |

|
#13
Miller Rdg
Crossville, TN 38571
|
1,233 sq. feet
|
1 baths - beds |
show details | |

|
#14
Lincoln Rd
Jamestown, TN 38556
|
1,096 sq. feet
|
1 baths - beds |
show details | |

|
#15
Whited Ave
Jamestown, TN 38556
|
480 sq. feet
|
1 baths - beds |
show details | |

|
#16
Lacy Ln
Alpine, TN 38543
|
768 sq. feet
|
1 baths - beds |
show details | |

|
#17
Old Walton Rd
Monterey, TN 38574
|
936 sq. feet
|
1 baths - beds |
show details | |

|
#18
Lindsey Knoll Cir
Crossville, TN 38558
|
2,143 sq. feet
|
2 baths - beds |
show details | |

|
#19
Mount Helen Rd
Allardt, TN 38504
|
1,598 sq. feet
|
1 baths - beds |
show details | |

|
#20
Franklin Rd
Jamestown, TN 38556
|
1,304 sq. feet
|
1 baths - beds |
show details |
| Photo | Address | Area | Beds / Baths | Price | Details |
|---|---|---|---|---|---|

|
#21
Brummel Ln
Crossville, TN 38558
|
1,588 sq. feet
|
2 baths - beds |
show details | |

|
#22
Drew Howard Rd
Crossville, TN 38558
|
1,080 sq. feet
|
2 baths - beds |
show details | |

|
#23
Woodlands Cir
Crossville, TN 38571
|
1,232 sq. feet
|
2 baths - beds |
show details | |

|
#24
Lakeshore Cir Unit 137
Crossville, TN 38558
|
1,252 sq. feet
|
1 baths - beds |
show details | |

|
#25
Windcrest Dr
Jamestown, TN 38556
|
1,296 sq. feet
|
1 baths - beds |
show details | |

|
#26
Longview Ln
Jamestown, TN 38556
|
1,248 sq. feet
|
1 baths - beds |
show details | |

|
#27
Kennedy Rd
Jamestown, TN 38556
|
972 sq. feet
|
1 baths - beds |
show details | |

|
#28
Wallace St
Jamestown, TN 38556
|
960 sq. feet
|
1 baths - beds |
show details | |

|
#29
Old Baldwin Rd
Crossville, TN 38571
|
960 sq. feet
|
1 baths - beds |
show details | |

|
#30
Claude Howard Rd
Deer Lodge, TN 37726
|
960 sq. feet
|
1 baths - beds |
show details |
| Photo | Address | Area | Beds / Baths | Price | Details |
|---|---|---|---|---|---|

|
#31
W Lawn Dr
Jamestown, TN 38556
|
1,218 sq. feet
|
1 baths - beds |
show details | |

|
#32
Laurens Ln
Grimsley, TN 38565
|
1,586 sq. feet
|
2 baths - beds |
show details | |

|
#33
Silver Trail Dr
Jamestown, TN 38556
|
864 sq. feet
|
1 baths - beds |
show details | |

|
#34
Grouse Ct
Crossville, TN 38558
|
768 sq. feet
|
- baths - beds |
show details | |

|
#35
Twinton Park Rd
Crawford, TN 38554
|
1,176 sq. feet
|
- baths - beds |
show details | |

|
#36
Winding Trails Rd
Monterey, TN 38574
|
- sq. feet
|
- baths - beds |
show details | |

|
#37
Laurel Creek Rd
Wilder, TN 38589
|
- sq. feet
|
- baths - beds |
show details | |

|
#38
Vine Ridge Rd
Crawford, TN 38554
|
784 sq. feet
|
- baths - beds |
show details | |

|
#39
Craig Rd
Monterey, TN 38574
|
- sq. feet
|
- baths - beds |
show details | |

|
#40
Ashburn Rd
Monterey, TN 38574
|
800 sq. feet
|
- baths - beds |
show details |
| Photo | Address | Area | Beds / Baths | Price | Details |
|---|---|---|---|---|---|

|
#41
Old Deer Lodge Pike
Deer Lodge, TN 37726
|
- sq. feet
|
- baths - beds |
show details | |

|
#42
Nichol Creek Dr
Jamestown, TN 38556
|
- sq. feet
|
- baths - beds |
show details | |

|
#43
Anderson Tinch Ave
Jamestown, TN 38556
|
- sq. feet
|
- baths - beds |
show details | |

|
#44
Payton Richards Rd
Jamestown, TN 38556
|
- sq. feet
|
- baths - beds |
show details | |

|
#45
Woodlands Cir
Crossville, TN 38571
|
- sq. feet
|
- baths - beds |
show details | |

|
#46
Canterbury Dr
Crossville, TN 38558
|
- sq. feet
|
- baths - beds |
show details | |

|
#47
Old Jamestown Hwy # 28
Crossville, TN 38555
|
- sq. feet
|
- baths - beds |
show details | |

|
#48
S Poplar St
Monterey, TN 38574
|
1,728 sq. feet
|
- baths - beds |
show details | |

|
#49
Barrett Ln
Grimsley, TN 38565
|
- sq. feet
|
- baths - beds |
show details | |

|
Check over 1 million property listings on Foreclosure.com!
|
browse all offers | |||


Household type by relationship:
Households: 17,827- In family households: 15,203 (3,567 male householders, 1,448 female householders)
3,820 spouses, 4,878 children (4,393 natural, 140 adopted, 345 stepchildren), 575 grandchildren, 130 brothers or sisters, 113 parents, foster children, 199 other relatives, 367 non-relatives
- In nonfamily households: 2,624 (1,041 male householders (847 living alone)), 1,194 female householders (1,080 living alone)), 389 nonrelatives
- In group quarters: 132 (131 institutionalized population)
2,912 married couples with children.
765 single-parent households (159 men, 606 women).
98.3% of residents of Clarkrange speak English at home.
1.2% of residents speak Spanish at home (59% speak English very well, 41% speak English not well).
0.6% of residents speak other Indo-European language at home (52% speak English very well, 48% speak English well).
Foreign born population: 36 (0.8%)
(125.0% of them are naturalized citizens)
| Here: | 6.3 |
| State: | 6.5 |
| Here: | 4.9 |
| State: | 4.4 |

- Bedrooms in owner-occupied houses and condos in Clarkrange, Tennessee
- 0no bedroom
- 431 bedroom
- 3672 bedrooms
- 6833 bedrooms
- 1714 bedrooms
- 235+ bedrooms

- Bedrooms in renter-occupied apartments in Clarkrange, Tennessee
- 7no bedroom
- 191 bedroom
- 1182 bedrooms
- 593 bedrooms
- 154 bedrooms
- 245+ bedrooms

- Cars and other vehicles available in Clarkrange in owner-occupied houses/condos
- 69no vehicle
- 3701 vehicle
- 5172 vehicles
- 1843 vehicles
- 1144 vehicles
- 335+ vehicles

- Cars and other vehicles available in Clarkrange in renter-occupied apartments
- 13no vehicle
- 1141 vehicle
- 1082 vehicles
- 03 vehicles
- 74 vehicles
- 05+ vehicles

- Rooms in owner-occupied houses in Clarkrange, Tennessee
- 01 room
- 62 rooms
- 193 rooms
- 2334 rooms
- 4145 rooms
- 3136 rooms
- 1537 rooms
- 918 rooms
- 589+ rooms

- Rooms in renter-occupied apartments in Clarkrange, Tennessee
- 71 room
- 02 rooms
- 153 rooms
- 1104 rooms
- 375 rooms
- 156 rooms
- 357 rooms
- 178 rooms
- 69+ rooms


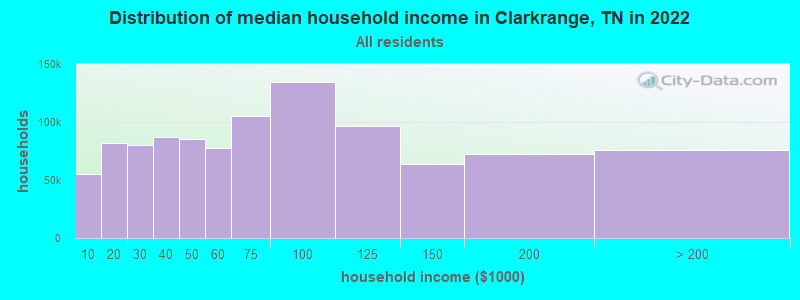
Clarkrange, TN household income distribution

- 36,548Less than $10,000
- 61,301$10,000 to $19,999
- 58,135$20,000 to $29,999
- 59,441$30,000 to $39,999
- 57,473$40,000 to $49,999
- 53,195$50,000 to $59,999
- 72,526$60,000 to $74,999
- 92,443$75,000 to $99,999
- 69,137$100,000 to $124,999
- 41,181$125,000 to $149,999
- 45,200$150,000 to $199,999
- 38,210$200,000 or more
Percentage of workers working in this county: 49.6%
Number of people working at home: 159 (9.8% of all workers)
Travel time to work (commute)
- Less than 5 minutes: 66
- 5 to 9 minutes: 90
- 10 to 14 minutes: 127
- 15 to 19 minutes: 119
- 20 to 24 minutes: 201
- 25 to 29 minutes: 146
- 30 to 34 minutes: 213
- 35 to 39 minutes: 54
- 40 to 44 minutes: 47
- 45 to 59 minutes: 150
- 60 to 89 minutes: 81
- 90 or more minutes: 105
Means of transportation to work:
- Drove a car alone: 1,117 (76.9%)
- Carpooled: 234 (16.1%)
- Bus or trolley bus: 6 (0.4%)
- Walked: 33 (2.3%)
- Other means: 9 (0.6%)
- Worked at home: 54 (3.7%)


- Year of entry for the foreign-born population in Clarkrange, Tennessee
- 01995 to March 2000
- 01990 to 1994
- 01985 to 1989
- 111980 to 1984
- 01975 to 1979
- 01970 to 1974
- 71965 to 1969
- 0Before 1965
Most common places of birth for foreign-born residents (%):
| Clarkrange: | 61.1% (11) |
| Tennessee: | 0.5% (733) |
| Clarkrange: | 38.9% (7) |
| Tennessee: | 5.2% (8,316) |
Place of birth for U.S.-born residents:
- This state: 3,066
- Other state: 936
- Northeast: 70
- Midwest: 426
- South: 396
- West: 44
61% of Clarkrange residents lived in the same house 5 years ago.
Out of people who lived in different houses, 59% lived in this county.
Out of people who lived in different counties, 58% lived in Tennessee.
Education attainment for males 25 years and older:
- No schooling: 29
- Nursery to 4th grade: 63
- 5th and 6th grade: 35
- 7th and 8th grade: 241
- 9th grade: 41
- 10th grade: 28
- 11th grade: 60
- 12th grade, no diploma: 45
- High school graduate (or equivalency): 513
- Less than 1 year of college: 36
- Some college more than 1 year, no degree: 100
- Associate degree: 47
- Bachelor's degree: 24
- Master's degree: 16
- Professional school degree: 6
- Doctorate degree: 5

Education attainment for females 25 years and older:
- No schooling: 31
- Nursery to 4th grade: 27
- 5th and 6th grade: 17
- 7th and 8th grade: 186
- 9th grade: 63
- 10th grade: 104
- 11th grade: 54
- 12th grade, no diploma: 33
- High school graduate (or equivalency): 572
- Less than 1 year of college: 49
- Some college more than 1 year, no degree: 56
- Associate degree: 34
- Bachelor's degree: 68
- Master's degree: 33
- Professional school degree: 0
- Doctorate degree: 0


Housing units in structures:
- One, detached: 1,166
- One, attached: 7
- Two: 14
- 3 or 4: 2
- Mobile homes: 513
Median worth of mobile homes: $52,624
Housing units lacking complete kitchen facilities: 2.1%

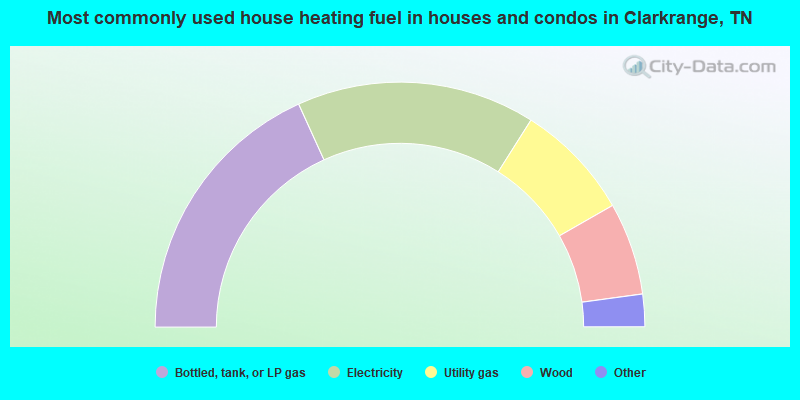
- 36.4%Bottled, tank, or LP gas
- 31.5%Electricity
- 15.5%Utility gas
- 12.2%Wood
- 3.3%Fuel oil, kerosene, etc.
- 1.0%Other fuel
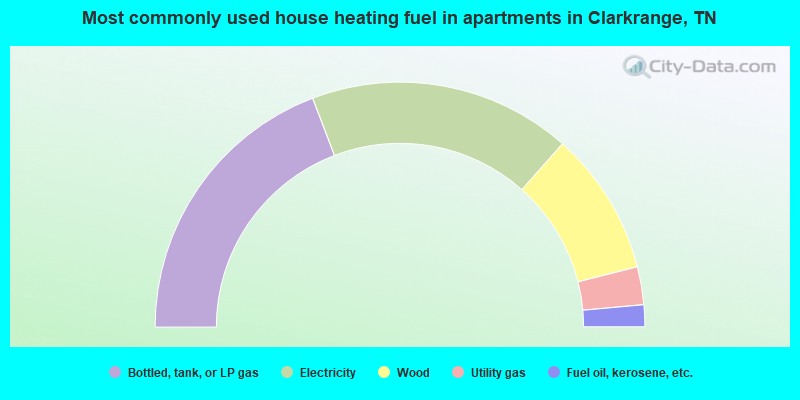
- 38.4%Bottled, tank, or LP gas
- 34.7%Electricity
- 19.0%Wood
- 5.0%Utility gas
- 2.9%Fuel oil, kerosene, etc.
Private vs. public school enrollment:
| Here: | 3.9% |
| Tennessee: | 9.5% |
| Here: | 2.4% |
| Tennessee: | 10.4% |
| Here: | 0.0% |
| Tennessee: | 22.8% |


