Clarksville, TN (Tennessee) Houses and Residents
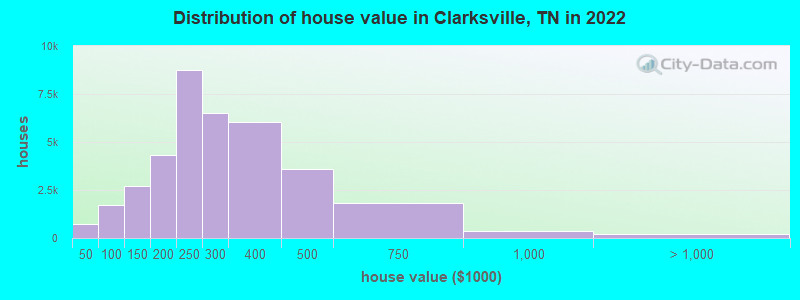
Estimated median house or condo value in 2022: $262,800 (it was $83,500 in 2000 )
Clarksville:
$262,800Tennessee:
$284,800
Lower value quartile - upper value quartile: $208,700 - $355,300Mean price in 2022: Detached houses: $247,912 Here:
$247,912State:
$374,382
Townhouses or other attached units: $335,544 Here:
$335,544State:
$354,101
In 2-unit structures: $246,809 Here:
$246,809State:
$247,693
In 3-to-4-unit structures: $231,811 Here:
$231,811State:
$239,060
In 5-or-more-unit structures: $222,759 Here:
$222,759State:
$317,434
Mobile homes: $62,309 Here:
$62,309State:
$101,421
Total population: 146,806 (Urban population: 97,331, Rural population: 6,435 (82 farm, 6,353 nonfarm ))
Houses: 72,431 (68,704 occupied: 40,718 owner occupied, 27,986 renter occupied )
% of renters here:
41%State:
33%
Housing density: 764 houses/condos per square mile
Median price asked for vacant for-sale houses and condos in 2022: $230,594.
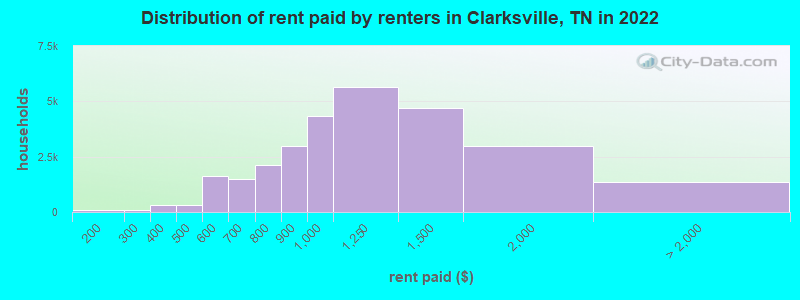
Median contract rent in 2022: $1,011 (lower quartile is $825, upper quartile is $1,324)
Median rent asked for vacant for-rent units in 2022: $1,456
Median gross rent in Clarksville, TN in 2022: $1,228
Housing units in Clarksville with a mortgage: 29,430 (2,201 second mortgage, 65 home equity loan, 1,614 both second mortgage and home equity loan )Houses without a mortgage: 621
Median household income for houses/condos with a mortgage: $79,605
Median household income for apartments without a mortgage: $61,336
Median monthly housing costs: $1,202
Data:
Median house or condo value ($)
Median house or condo value ($ change since 2000)
Median house or condo value ($) - White
Median house or condo value ($) - Black or African American
Median house or condo value ($) - Asian
Median house or condo value ($) - Hispanic or Latino
Median house or condo value ($) - American Indian and Alaska Native
Median house or condo value ($) - Multirace
Median house or condo value ($) - Other Race
Median price asked for mobile homes ($)
Household density (households per square mile)
Mean house or condo value by units in structure - 1, detached ($)
Mean house or condo value by units in structure - 1, attached ($)
Mean house or condo value by units in structure - 2 ($)
Mean house or condo value by units in structure by units in structure - 3 or 4 ($)
Mean house or condo value by units in structure - 5 or more ($)
Mean house or condo value by units in structure - Boat, RV, van, etc. ($)
Mean house or condo value by units in structure - Mobile home ($)
Median contract rent ($)
Median contract rent - Lower quartile ($)
Median contract rent - Upper quartile ($)
Median gross rent ($)
Urban houses (%)
Rural houses (%)
Houses occupied (%)
Houses occupied (% change since 2000)
Houses owner occupied (%)
Houses owner occupied (% change since 2000)
Houses renter occupied (%)
Houses renter occupied (% change since 2000)
Vacant housing units - For rent (%)
Vacant housing units - For rent (% change since 2000)
Vacant housing units - For sale only (%)
Vacant housing units - For sale only (% change since 2000)
Vacant housing units - Rented or sold, not occupied (%)
Vacant housing units - Rented or sold, not occupied (% change since 2000)
Vacant housing units - For seasonal, recreational, or occasional use (%)
Vacant housing units - For seasonal, recreational, or occasional use (% change since 2000)
Vacant housing units - For migrant workers (%)
Vacant housing units - For migrant workers (% change since 2000)
Vacant housing units - Other vacant (%)
Vacant housing units - Other vacant (% change since 2000)
Median monthly housing costs ($)
Median household income for houses/condos with a mortgage ($)
Median household income for houses/condos without a mortgage ($)
Median household income ($)
Median household income ($) - White
Median household income ($) - Black or African American
Median household income ($) - Asian
Median household income ($) - Hispanic or Latino
Median household income ($) - American Indian and Alaska Native
Median household income ($) - Multirace
Median household income ($) - Other Race
Mortgage status - with mortgage (%)
Mortgage status - with second mortgage (%)
Mortgage status - with home equity loan (%)
Mortgage status - with both second mortgage and home equity loan (%)
Mortgage status - without a mortgage (%)
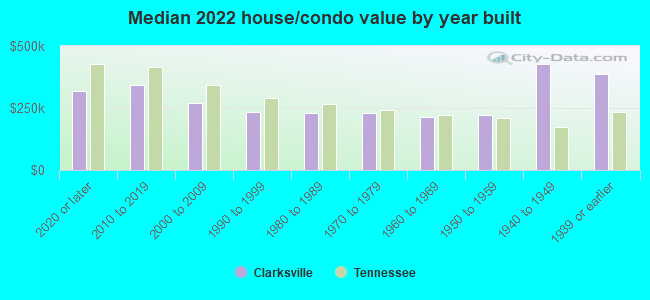
Median year house/condo built
Median year apartment built
Household type by relationship - Male householder living alone (%)
Household type by relationship - Male householder not living alone (%)
Household type by relationship - Female householder living alone (%)
Household type by relationship - Female householder not living alone (%)
Household type by relationship - Opposite-Sex spouse (%)
Household type by relationship - Same-Sex spouse (%)
Household type by relationship - Opposite-Sex unmarried partner (%)
Household type by relationship - Same-Sex unmarried partner (%)
Household type by relationship - In group quarters (%)
Size of family households - 2-person household (%)
Size of family households - 3-person household (%)
Size of family households - 4-person household (%)
Size of family households - 5-person household (%)
Size of family households - 6-person household (%)
Size of family households - 7-or-more-person household (%)
Size of nonfamily households - 1-person household (%)
Size of nonfamily households - 2-person household (%)
Size of nonfamily households - 3-person household (%)
Size of nonfamily households - 4-person household (%)
Size of nonfamily households - 5-person household (%)
Size of nonfamily households - 6-person household (%)
Size of nonfamily households - 7-or-moreperson household (%)
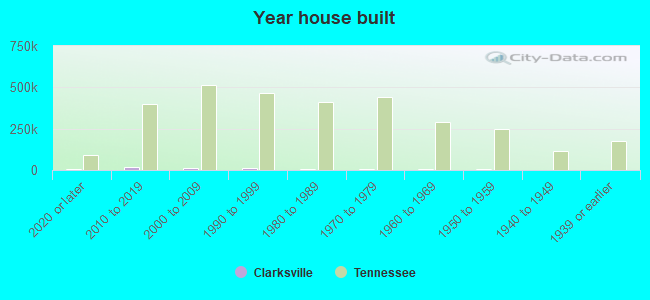
Year house built - Built 2010 or later (%)
Year house built - Built 2000 to 2009 (%)
Year house built - Built 1990 to 1999 (%)
Year house built - Built 1980 to 1989 (%)
Year house built - Built 1970 to 1979 (%)
Year house built - Built 1960 to 1969 (%)
Year house built - Built 1950 to 1959 (%)
Year house built - Built 1940 to 1949 (%)
Year house built - Built 1939 or earlier (%)
Median number of rooms in houses and condos
Median number of rooms in apartments
Median number of bedrooms in owner occupied houses
Mean number of bedrooms in owner occupied houses
Median number of bedrooms in renter occupied houses
Mean number of bedrooms in renter occupied houses
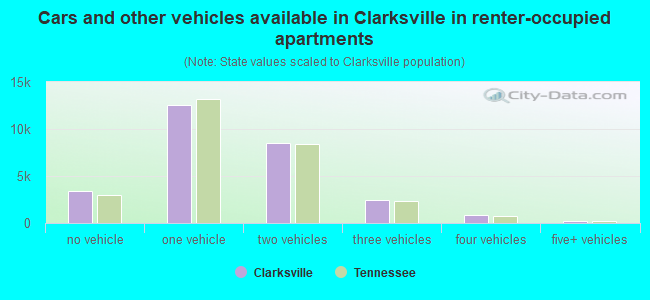
Median number of vehichles in owner occupied houses
Mean number of vehichles in owner occupied houses
Median number of vehichles in renter occupied houses
Mean number of vehichles in renter occupied houses
Rooms in owner-occupied houses - 1 room (%)
Rooms in owner-occupied houses - 2 rooms (%)
Rooms in owner-occupied houses - 3 rooms (%)
Rooms in owner-occupied houses - 4 rooms (%)
Rooms in owner-occupied houses - 5 rooms (%)
Rooms in owner-occupied houses - 6 rooms (%)
Rooms in owner-occupied houses - 7 rooms (%)
Rooms in owner-occupied houses - 8 rooms (%)
Rooms in owner-occupied houses - 9+ rooms (%)
Rooms in renter-occupied houses - 1 room (%)
Rooms in renter-occupied houses - 2 rooms (%)
Rooms in renter-occupied houses - 3 rooms (%)
Rooms in renter-occupied houses - 4 rooms (%)
Rooms in renter-occupied houses - 5 rooms (%)
Rooms in renter-occupied houses - 6 rooms (%)
Rooms in renter-occupied houses - 7 rooms (%)
Rooms in renter-occupied houses - 8 rooms (%)
Rooms in renter-occupied houses - 9+ rooms (%)
Bedrooms in owner-occupied houses - no bedrooms (%)
Bedrooms in owner-occupied houses - 1 bedroom (%)
Bedrooms in owner-occupied houses - 2 bedrooms (%)
Bedrooms in owner-occupied houses - 3 bedrooms (%)
Bedrooms in owner-occupied houses - 4 bedrooms (%)
Bedrooms in owner-occupied houses - 5+ bedrooms (%)
Bedrooms in renter-occupied houses - no bedrooms (%)
Bedrooms in renter-occupied houses - 1 bedroom (%)
Bedrooms in renter-occupied houses - 2 bedrooms (%)
Bedrooms in renter-occupied houses - 3 bedrooms (%)
Bedrooms in renter-occupied houses - 4 bedrooms (%)
Bedrooms in renter-occupied houses - 5+ bedrooms (%)
Vehicles available in owner-occupied houses - no vehicle available (%)
Vehicles available in owner-occupied houses - 1 vehicle available(%)
Vehicles available in owner-occupied houses - 2 Vehicles available (%)
Vehicles available in owner-occupied houses - 3 Vehicles available (%)
Vehicles available in owner-occupied houses - 4 Vehicles available (%)
Vehicles available in owner-occupied houses - 5+ Vehicles available (%)
Vehicles available in renter-occupied houses - no vehicle available (%)
Vehicles available in renter-occupied houses - 1 vehicle available (%)
Vehicles available in renter-occupied houses - 2 Vehicles available (%)
Vehicles available in renter-occupied houses - 3 Vehicles available (%)
Vehicles available in renter-occupied houses - 4 Vehicles available (%)
Vehicles available in renter-occupied houses - 5+ Vehicles available (%)
Housing units in structures - 1, detached (%)
Housing units in structures - 1, attached (%)
Housing units in structures - 2 (%)
Housing units in structures - 3 or 4 (%)
Housing units in structures - 5 to 9 (%)
Housing units in structures - 10 to 19 (%)
Housing units in structures - 20 to 49 (%)
Housing units in structures - 50 or more (%)
Housing units in structures - Mobile home (%)
Housing units in structures - Boat, RV, van, etc. (%)
Housing units in structures - Owners - 1, detached (%)
Housing units in structures - Owners - 1, attached (%)
Housing units in structures - Owners - 2 (%)
Housing units in structures - Owners - 3 or 4 (%)
Housing units in structures - Owners - 5 to 9 (%)
Housing units in structures - Owners - 10 to 19 (%)
Housing units in structures - Owners - 20 to 49 (%)
Housing units in structures - Owners - 50 or more (%)
Housing units in structures - Owners - Mobile home (%)
Housing units in structures - Owners - Boat, RV, van, etc. (%)
Housing units in structures - Renters - 1, detached (%)
Housing units in structures - Renters - 1, attached (%)
Housing units in structures - Renters - 2 (%)
Housing units in structures - Renters - 3 or 4 (%)
Housing units in structures - Renters - 5 to 9 (%)
Housing units in structures - Renters - 10 to 19 (%)
Housing units in structures - Renters - 20 to 49 (%)
Housing units in structures - Renters - 50 or more (%)
Housing units in structures - Renters - Mobile home (%)
Housing units in structures - Renters - Boat, RV, van, etc. (%)
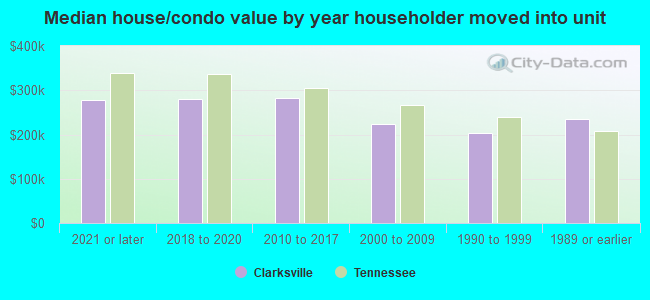
House/condo owner moved in on average (years ago)
Renter moved in on average (years ago)
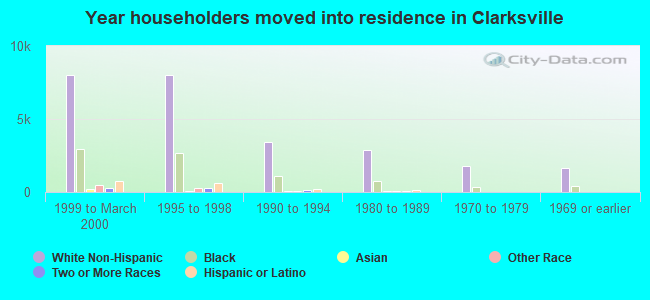
Year householder moved into unit - Moved in 1999 to March 2000 (%)
Year householder moved into unit - Moved in 1999 to March 2000 (%) - White
Year householder moved into unit - Moved in 1999 to March 2000 (%) - Black or African American
Year householder moved into unit - Moved in 1999 to March 2000 (%) - Asian
Year householder moved into unit - Moved in 1999 to March 2000 (%) - Hispanic or Latino
Year householder moved into unit - Moved in 1999 to March 2000 (%) - American Indian and Alaska Native
Year householder moved into unit - Moved in 1999 to March 2000 (%) - Multirace
Year householder moved into unit - Moved in 1999 to March 2000 (%) - Other Race
Year householder moved into unit - Moved in 1995 to 1998 (%)
Year householder moved into unit - Moved in 1995 to 1998 (%) - White
Year householder moved into unit - Moved in 1995 to 1998 (%) - Black or African American
Year householder moved into unit - Moved in 1995 to 1998 (%) - Asian
Year householder moved into unit - Moved in 1995 to 1998 (%) - Hispanic or Latino
Year householder moved into unit - Moved in 1995 to 1998 (%) - American Indian and Alaska Native
Year householder moved into unit - Moved in 1995 to 1998 (%) - Multirace
Year householder moved into unit - Moved in 1995 to 1998 (%) - Other Race
Year householder moved into unit - Moved in 1990 to 1994 (%)
Year householder moved into unit - Moved in 1990 to 1994 (%) - White
Year householder moved into unit - Moved in 1990 to 1994 (%) - Black or African American
Year householder moved into unit - Moved in 1990 to 1994 (%) - Asian
Year householder moved into unit - Moved in 1990 to 1994 (%) - Hispanic or Latino
Year householder moved into unit - Moved in 1990 to 1994 (%) - American Indian and Alaska Native
Year householder moved into unit - Moved in 1990 to 1994 (%) - Multirace
Year householder moved into unit - Moved in 1990 to 1994 (%) - Other Race
Year householder moved into unit - Moved in 1980 to 1989 (%)
Year householder moved into unit - Moved in 1980 to 1989 (%) - White
Year householder moved into unit - Moved in 1980 to 1989 (%) - Black or African American
Year householder moved into unit - Moved in 1980 to 1989 (%) - Asian
Year householder moved into unit - Moved in 1980 to 1989 (%) - Hispanic or Latino
Year householder moved into unit - Moved in 1980 to 1989 (%) - American Indian and Alaska Native
Year householder moved into unit - Moved in 1980 to 1989 (%) - Multirace
Year householder moved into unit - Moved in 1980 to 1989 (%) - Other Race
Year householder moved into unit - Moved in 1970 to 1979 (%)
Year householder moved into unit - Moved in 1970 to 1979 (%) - White
Year householder moved into unit - Moved in 1970 to 1979 (%) - Black or African American
Year householder moved into unit - Moved in 1970 to 1979 (%) - Asian
Year householder moved into unit - Moved in 1970 to 1979 (%) - Hispanic or Latino
Year householder moved into unit - Moved in 1970 to 1979 (%) - American Indian and Alaska Native
Year householder moved into unit - Moved in 1970 to 1979 (%) - Multirace
Year householder moved into unit - Moved in 1970 to 1979 (%) - Other Race
Year householder moved into unit - Moved in 1969 or earlier (%)
Year householder moved into unit - Moved in 1969 or earlier (%) - White
Year householder moved into unit - Moved in 1969 or earlier (%) - Black or African American
Year householder moved into unit - Moved in 1969 or earlier (%) - Asian
Year householder moved into unit - Moved in 1969 or earlier (%) - Hispanic or Latino
Year householder moved into unit - Moved in 1969 or earlier (%) - American Indian and Alaska Native
Year householder moved into unit - Moved in 1969 or earlier (%) - Multirace
Year householder moved into unit - Moved in 1969 or earlier (%) - Other Race
Housing units lacking complete plumbing facilities (%)
Housing units lacking complete kitchen facilities (%)
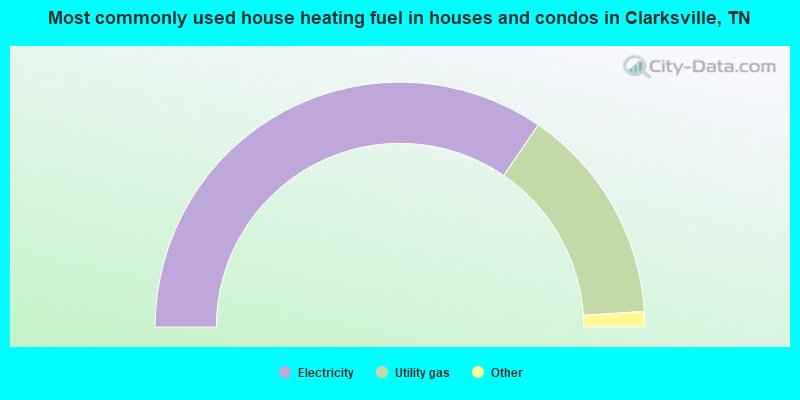
House heating fuel used in houses and condos - Utility gas (%)
House heating fuel used in houses and condos - Bottled, tank, or LP gas (%)
House heating fuel used in houses and condos - Electricity (%)
House heating fuel used in houses and condos - Fuel oil, kerosene, etc. (%)
House heating fuel used in houses and condos - Coal or coke (%)
House heating fuel used in houses and condos - Wood (%)
House heating fuel used in houses and condos - Solar energy (%)
House heating fuel used in houses and condos - Other fuel (%)
House heating fuel used in houses and condos - No fuel used (%)
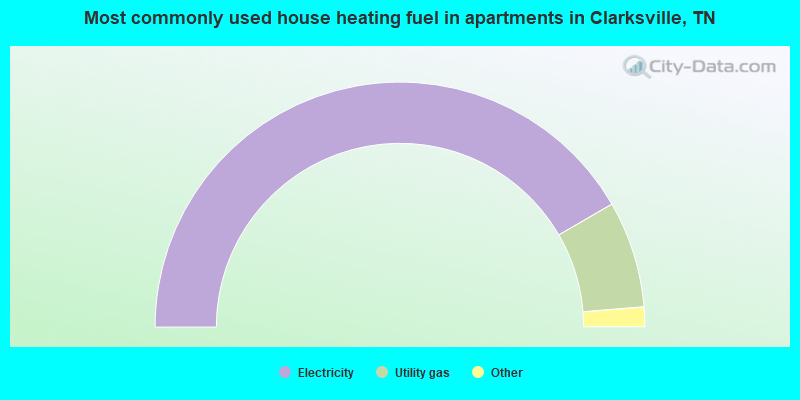
House heating fuel used in apartments - Utility gas (%)
House heating fuel used in apartments - Bottled, tank, or LP gas (%)
House heating fuel used in apartments - Electricity (%)
House heating fuel used in apartments - Fuel oil, kerosene, etc. (%)
House heating fuel used in apartments - Coal or coke (%)
House heating fuel used in apartments - Wood (%)
House heating fuel used in apartments - Solar energy (%)
House heating fuel used in apartments - Other fuel (%)
House heating fuel used in apartments - No fuel used (%)
Latest news about housing in Clarksville, TN collected exclusively by city-data.com from local newspapers, TV, and radio stations
Median year house/condo built: 1997Median year apartment built: 1999Household type by relationship:
Households: 176,977
Male householders: 35,616 (8,970 living alone ), Female householders: 33,088 (8,676 living alone )31,638 spouses (31,574 opposite-sex spouses ), 6,036 unmarried partners , (5,374 opposite-sex unmarried partners ), 52,661 children (50,372 natural , 1,269 adopted , 1,020 stepchildren ), 4,653 grandchildren , 1,410 brothers or sisters , 2,162 parents , 175 foster children , 1,447 other relatives , 4,009 non-relatives In group quarters: 4,082
Size of family households: 18,988 2-persons , 13,338 3-persons , 7,561 4-persons , 3,452 5-persons , 2,021 6-persons , 637 7-or-more-persons .
Size of nonfamily households: 17,646 1-person , 4,060 2-persons , 1,001 3-persons .
25,259 married couples with children. single-parent households (4,411 men , 12,192 women ).
88.9% of residents of Clarksville speak English at home. of residents speak Spanish at home (67% speak English very well , 18% speak English well , 9% speak English not well , 6% don't speak English at all ).of residents speak other Indo-European language at home (90% speak English very well , 7% speak English well , 2% speak English not well , 1% don't speak English at all ).of residents speak Asian or Pacific Island language at home (61% speak English very well , 28% speak English well , 11% speak English not well ).of residents speak other language at home (74% speak English very well , 16% speak English well , 10% speak English not well ).
Foreign born population: 11,108 (6.3%)of them are naturalized citizens )
Median number of rooms in houses and condos:
Median number of rooms in apartments
Owner-occupied Renter-occupied
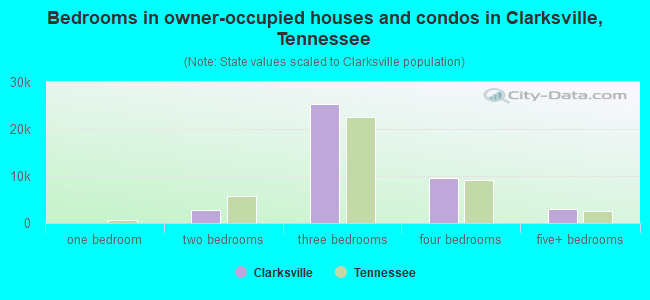
Bedrooms in owner-occupied houses and condos in Clarksville, Tennessee
0 no bedroom 93 1 bedroom 2,700 2 bedrooms 25,299 3 bedrooms 9,576 4 bedrooms 3,050 5+ bedrooms
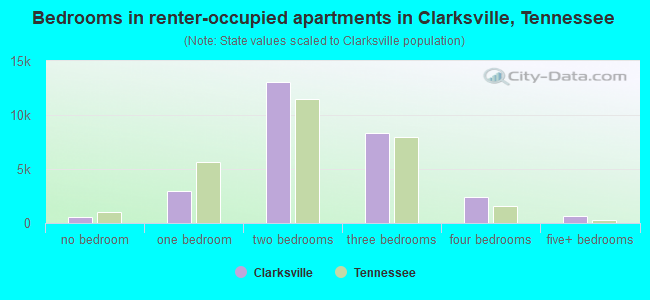
Bedrooms in renter-occupied apartments in Clarksville, Tennessee
562 no bedroom 2,999 1 bedroom 13,023 2 bedrooms 8,335 3 bedrooms 2,393 4 bedrooms 674 5+ bedrooms
Owner-occupied Renter-occupied
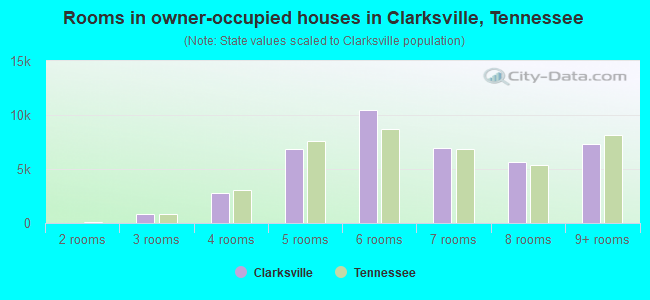
Rooms in owner-occupied houses in Clarksville, Tennessee
0 1 room 0 2 rooms 821 3 rooms 2,738 4 rooms 6,810 5 rooms 10,476 6 rooms 6,978 7 rooms 5,623 8 rooms 7,272 9+ rooms
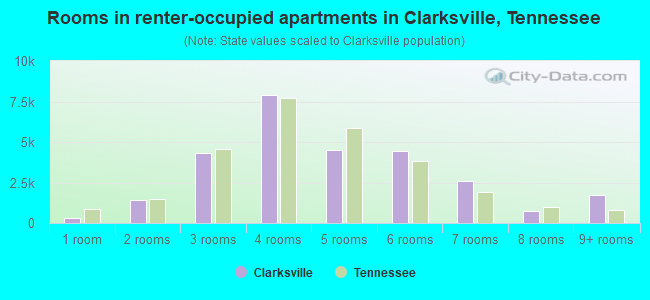
Rooms in renter-occupied apartments in Clarksville, Tennessee
290 1 room 1,426 2 rooms 4,336 3 rooms 7,875 4 rooms 4,487 5 rooms 4,432 6 rooms 2,620 7 rooms 769 8 rooms 1,751 9+ rooms
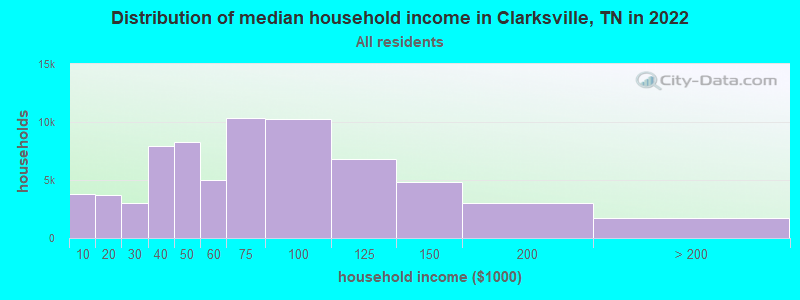
Clarksville, TN household income distribution 3,781 Less than $10,0003,737 $10,000 to $19,9993,040 $20,000 to $29,9997,907 $30,000 to $39,9998,242 $40,000 to $49,9994,995 $50,000 to $59,99910,381 $60,000 to $74,99910,230 $75,000 to $99,9996,819 $100,000 to $124,9994,841 $125,000 to $149,9993,045 $150,000 to $199,9991,686 $200,000 or more
Home value of owner - occupied houses in 2022 in Clarksville, TN 357 Less than $10,00057 $10,000 to $14,99977 $15,000 to $19,99941 $20,000 to $24,99953 $25,000 to $29,99921 $30,000 to $34,999131 $40,000 to $49,999116 $50,000 to $59,999192 $60,000 to $69,999220 $70,000 to $79,999600 $80,000 to $89,999459 $90,000 to $99,9991,495 $100,000 to $124,9991,230 $125,000 to $149,9992,223 $150,000 to $174,9992,102 $175,000 to $199,9998,738 $200,000 to $249,9996,528 $250,000 to $299,9996,030 $300,000 to $399,9993,618 $400,000 to $499,9991,833 $500,000 to $749,999365 $750,000 to $999,99987 $1,000,000 to $1,499,99964 $1,500,000 to $1,999,99963 $2,000,000 or moreRent paid by renters in 2022 in Clarksville, TN 93 $150 to $19973 $250 to $299171 $300 to $349162 $350 to $399243 $400 to $44971 $450 to $4991,169 $500 to $549461 $550 to $599760 $600 to $649724 $650 to $6991,253 $700 to $749850 $750 to $7992,970 $800 to $8994,322 $900 to $9995,647 $1,000 to $1,2494,682 $1,250 to $1,4993,000 $1,500 to $1,999318 $2,000 to $2,499194 $3,500 or more823 No cash rent
Percentage of workers working in this county: 66.0%Number of people working at home: 8,748 (10.1% of all workers )
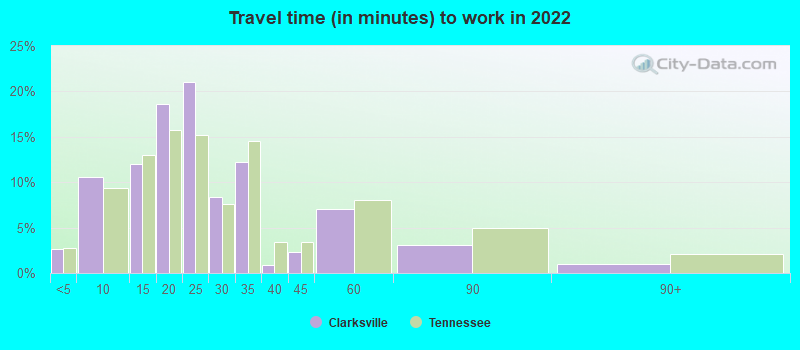
Travel time to work (commute)
Less than 5 minutes: 1,1305 to 9 minutes: 6,45110 to 14 minutes: 9,55015 to 19 minutes: 14,11820 to 24 minutes: 15,28125 to 29 minutes: 6,50230 to 34 minutes: 7,38235 to 39 minutes: 86840 to 44 minutes: 1,21945 to 59 minutes: 7,13060 to 89 minutes: 5,35690 or more minutes: 1,544
Means of transportation to work:
Drove a car alone: 52,132 (76.9%)Carpooled: 6,166 (9.1%)Bus : 252 (0.4%)Taxi: 1,165 (1.7%)Bicycle: 81 (0.1%)Walked: 560 (0.8%)Worked at home: 6,887 (10.2%)
Unemployment by race in 2022
Unemployment rate for White non-Hispanic residents 7.4% Males6.5% FemalesUnemployment rate for Black residents 6.9% Males2.6% FemalesUnemployment rate for American Indian and Alaska Native residents 7.1% Males1.4% FemalesUnemployment rate for Asian residents 2.7% Males4.0% FemalesUnemployment rate for other race residents 7.7% Males14.1% FemalesUnemployment rate for two or more race residents 6.7% Males1.7% FemalesUnemployment rate for Hispanic or Latino residents 4.4% Males7.7% Females
Year of entry for the foreign-born population in Clarksville, Tennessee
3,351 2010 or later 3,412 2000 to 2009 2,486 1990 to 1999 1,573 1980 to 1989 789 1970 to 1979 861 Before 1970
First ancestries reported:
American: 8,410 (9.8%)
English: 6,667 (7.8%)
German: 6,405 (7.5%)
Irish: 3,921 (4.6%)
European: 3,891 (4.5%)
Italian: 2,528 (2.9%)
African: 1,630 (1.9%)
Scottish: 905 (1.1%)
Scotch-Irish: 786 (0.9%)
Dutch: 719 (0.8%)
Jamaican: 459 (0.5%)
French Canadian: 385 (0.4%)
Polish: 337 (0.4%)
Danish: 312 (0.4%)
Syrian: 304 (0.4%)
French: 296 (0.3%)
Norwegian: 270 (0.3%)
Portuguese: 212 (0.2%)
British: 210 (0.2%)
Haitian: 205 (0.2%)
Slavic: 163 (0.2%)
Hungarian: 163 (0.2%)
Trinidadian and Tobagonian: 139 (0.2%)
Yugoslavian: 126 (0.1%)
Eastern European: 118 (0.1%)
Albanian: 105 (0.1%)
Brazilian: 103 (0.1%)
Greek: 102 (0.1%)
Swedish: 99 (0.1%)
Moroccan: 95 (0.1%)
Welsh: 94 (0.1%)
Guyanese: 89 (0.1%)
Nigerian: 84 (0.10%)
Basque: 78 (0.09%)
Ethiopian: 77 (0.09%)
Finnish: 74 (0.09%)
Lebanese: 73 (0.08%)
Iraqi: 70 (0.08%)
Scandinavian: 66 (0.08%)
Belgian: 54 (0.06%)
Kenyan: 51 (0.06%)
Russian: 43 (0.05%)
Latvian: 41 (0.05%)
West Indian: 40 (0.05%)
British West Indian: 39 (0.05%)
Celtic: 37 (0.04%)
Czech: 36 (0.04%)
Ukrainian: 36 (0.04%)
Romanian: 30 (0.03%)
Canadian: 28 (0.03%)
Liberian: 25 (0.03%)
Cajun: 24 (0.03%)
Egyptian: 23 (0.03%)
U.S. Virgin Islander: 23 (0.03%)
Sudanese: 21 (0.02%)
Czechoslovakian: 19 (0.02%)
Serbian: 19 (0.02%)
Austrian: 16 (0.02%)
Dutch West Indian: 15 (0.02%)
Jordanian: 13 (0.02%)
Lithuanian: 13 (0.02%)
Swiss: 11 (0.01%)
Most common places of birth for foreign-born residents (%): Mexico Clarksville:
16.2% (1,867)Tennessee:
23.0% (86,435)
Germany Clarksville:
8.3% (957)Tennessee:
2.2% (8,261)
Korea Clarksville:
7.5% (863)Tennessee:
2.3% (8,490)
Philippines Clarksville:
6.9% (797)Tennessee:
3.1% (11,640)
Dominican Republic Clarksville:
4.5% (518)Tennessee:
0.5% (1,963)
Canada Clarksville:
4.0% (460)Tennessee:
2.7% (10,295)
Jamaica Clarksville:
3.5% (408)Tennessee:
0.6% (2,405)
India Clarksville:
3.4% (394)Tennessee:
6.1% (23,079)
El Salvador Clarksville:
3.0% (346)Tennessee:
2.7% (10,313)
China, excluding Hong Kong and Taiwan Clarksville:
2.5% (285)Tennessee:
3.3% (12,582)
Brazil Clarksville:
1.9% (224)Tennessee:
0.8% (3,098)
Honduras Clarksville:
1.9% (220)Tennessee:
4.6% (17,433)
Guatemala Clarksville:
1.8% (206)Tennessee:
5.7% (21,286)
Tanzania Clarksville:
1.8% (204)Tennessee:
0.2% (573)
Panama Clarksville:
1.8% (202)Tennessee:
0.3% (1,008)
Micronesia Clarksville:
1.7% (200)Tennessee:
0.1% (404)
Nigeria Clarksville:
1.6% (189)Tennessee:
1.2% (4,662)
Place of birth for U.S.-born residents:
This state: 61,066Other state: 97,281Northeast: 14,012Midwest: 20,798South: 47,961West: 14,510 78.6% of Clarksville residents lived in the same house 1 years ago.
Out of people who lived in different houses, 31.8% lived in this county.
Out of people who lived in different counties, 36.5% lived in Tennessee.
Clarksville:
78.6%State average:
87.0%
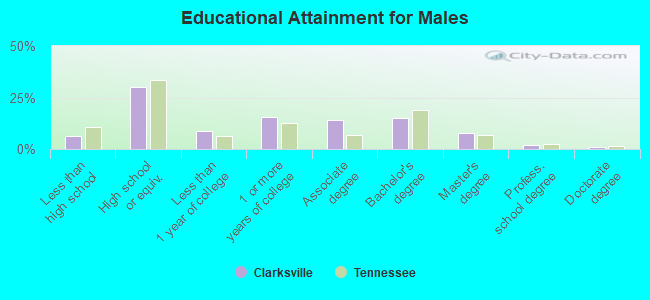
Education attainment for males 25 years and older:
No schooling: 1,088Nursery to 4th grade: 95th and 6th grade: 07th and 8th grade: 1249th grade: 9110th grade: 50611th grade: 70612th grade, no diploma: 883High school graduate (or equivalency): 16,028Less than 1 year of college: 4,602Some college more than 1 year, no degree: 8,214Associate degree: 7,617Bachelor's degree: 8,152Master's degree: 4,102Professional school degree: 994Doctorate degree: 441
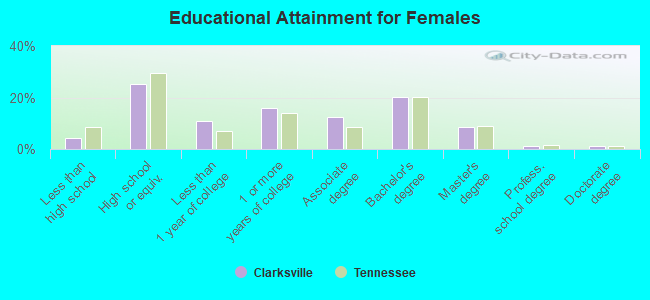
Education attainment for females 25 years and older:
No schooling: 445Nursery to 4th grade: 05th and 6th grade: 327th and 8th grade: 869th grade: 19910th grade: 20511th grade: 44512th grade, no diploma: 1,091High school graduate (or equivalency): 14,201Less than 1 year of college: 6,220Some college more than 1 year, no degree: 8,988Associate degree: 7,057Bachelor's degree: 11,357Master's degree: 4,733Professional school degree: 571Doctorate degree: 736
Housing units in structures:
One, detached: 49,532One, attached: 3,813Two: 2,0043 or 4: 5,8095 to 9: 4,24110 to 19: 3,22920 to 49: 84150 or more: 1,388Mobile homes: 1,574Median worth of mobile homes: $87,200
Housing units lacking complete plumbing facilities in 2022: 1.6%Housing units lacking complete kitchen facilities in 2022: 1.7%House/condo owner moved in on average 6 years ago
Renter moved in on average 2 years ago
Private vs. public school enrollment:
Students in private schools in grades 1 to 8 (elementary and middle school): 1,818 Students in private schools in grades 9 to 12 (high school): 950 Here:
10.7%Tennessee:
16.2%
Students in private undergraduate colleges: 1,503 Here:
13.1%Tennessee:
23.5%