Housing density: 2,417 houses/condos per square mile
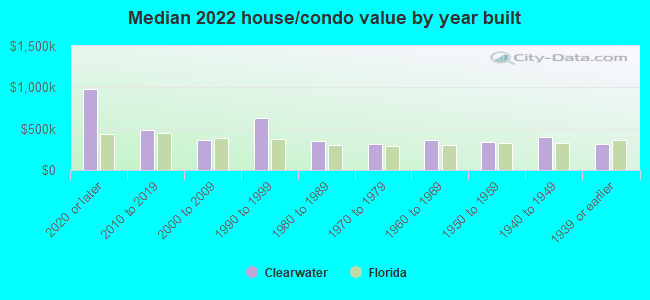
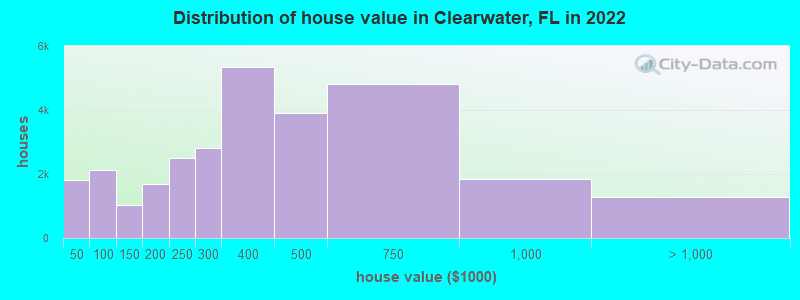
Median price asked for vacant for-sale houses and condos in 2022: $365,266.
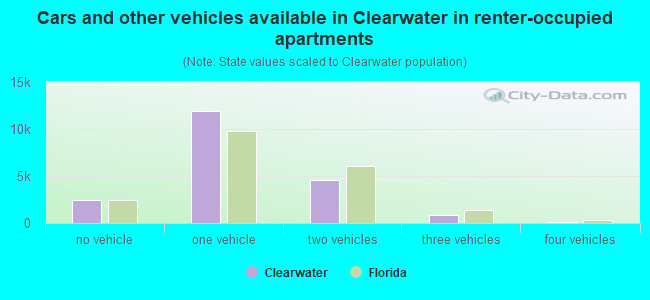
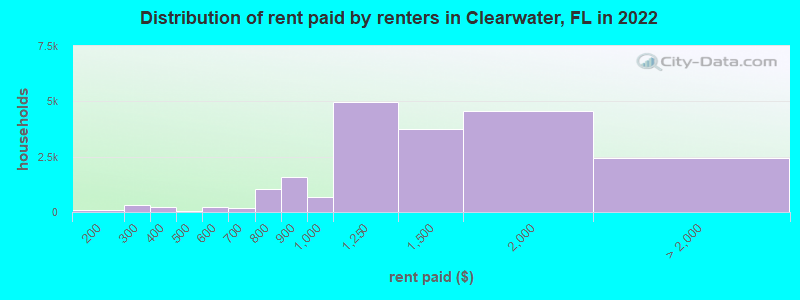
Median contract rent in 2022: $1,289 (lower quartile is $1,031, upper quartile is $1,693)
Median rent asked for vacant for-rent units in 2022: $3,855
Median gross rent in Clearwater, FL in 2022: $1,453
Housing units in Clearwater with a mortgage: 15,335 (1,503 second mortgage, 215 home equity loan, 1,083 both second mortgage and home equity loan) Houses without a mortgage: 1,649
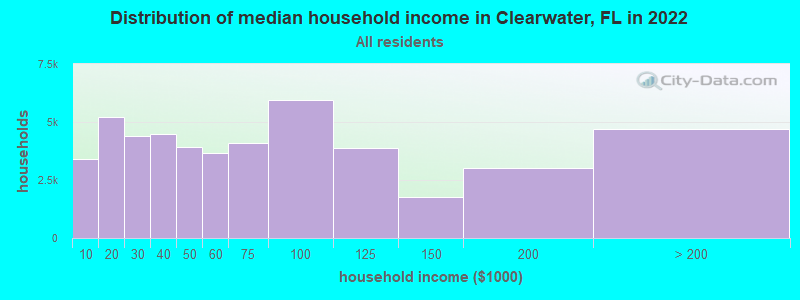
Median household income for houses/condos with a mortgage: $89,502
Median household income for apartments without a mortgage: $61,690
8,562 married couples with children.
7,376 single-parent households (2,399 men, 4,977 women).
79.1% of residents of Clearwater speak English at home.
11.8% of residents speak Spanish at home (46% speak English very well, 26% speak English well, 19% speak English not well, 9% don't speak English at all).
6.2% of residents speak other Indo-European language at home (67% speak English very well, 20% speak English well, 12% speak English not well, 2% don't speak English at all).
2.0% of residents speak Asian or Pacific Island language at home (65% speak English very well, 16% speak English well, 12% speak English not well, 7% don't speak English at all).
1.3% of residents speak other language at home (55% speak English very well, 14% speak English well, 30% speak English not well).
Foreign born population: 20,672 (17.7%)
(50.5% of them are naturalized citizens)
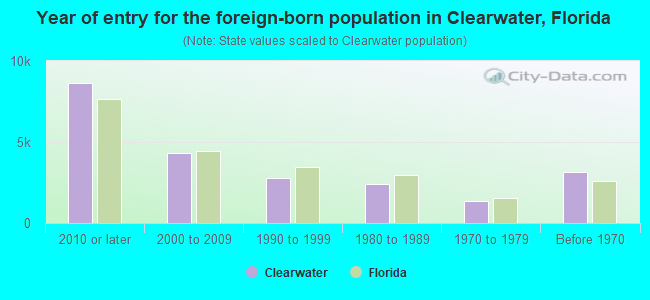
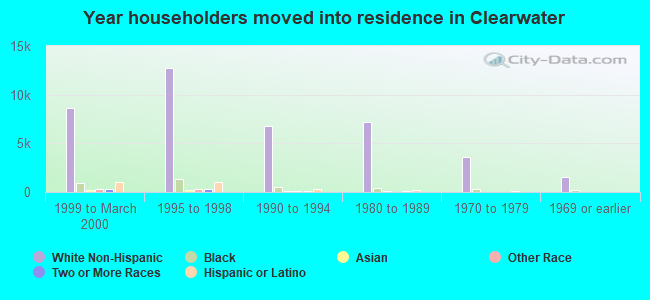
Year of entry for the foreign-born population in Clearwater, Florida
8,6522010 or later
4,3132000 to 2009
2,7991990 to 1999
2,4211980 to 1989
1,3341970 to 1979
3,133Before 1970
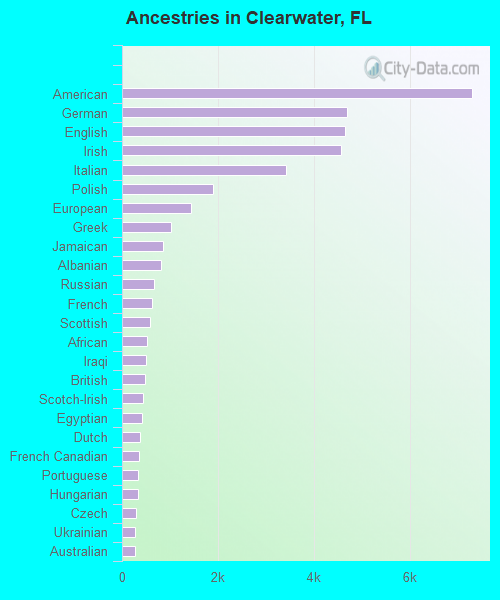
First ancestries reported:
American: 7,287 (11.3%)
German: 4,687 (7.3%)
English: 4,653 (7.2%)
Irish: 4,562 (7.1%)
Italian: 3,412 (5.3%)
Polish: 1,887 (2.9%)
European: 1,442 (2.2%)
Greek: 1,023 (1.6%)
Jamaican: 854 (1.3%)
Albanian: 810 (1.3%)
Russian: 665 (1.0%)
French: 629 (1.0%)
Scottish: 579 (0.9%)
African: 511 (0.8%)
Iraqi: 493 (0.8%)
British: 477 (0.7%)
Scotch-Irish: 444 (0.7%)
Egyptian: 412 (0.6%)
Dutch: 371 (0.6%)
French Canadian: 345 (0.5%)
Portuguese: 331 (0.5%)
Hungarian: 327 (0.5%)
Czech: 299 (0.5%)
Ukrainian: 281 (0.4%)
Australian: 270 (0.4%)
Canadian: 264 (0.4%)
Nigerian: 261 (0.4%)
Yugoslavian: 238 (0.4%)
Welsh: 234 (0.4%)
Eastern European: 228 (0.4%)
Lebanese: 222 (0.3%)
Brazilian: 201 (0.3%)
Swedish: 195 (0.3%)
Swiss: 191 (0.3%)
Croatian: 182 (0.3%)
Haitian: 182 (0.3%)
Iranian: 171 (0.3%)
Serbian: 135 (0.2%)
Lithuanian: 132 (0.2%)
South African: 126 (0.2%)
Norwegian: 125 (0.2%)
Belgian: 103 (0.2%)
Czechoslovakian: 99 (0.2%)
Palestinian: 98 (0.2%)
Moroccan: 88 (0.1%)
Guyanese: 69 (0.1%)
Bulgarian: 69 (0.1%)
Scandinavian: 68 (0.1%)
Northern European: 67 (0.1%)
Romanian: 65 (0.1%)
Armenian: 55 (0.09%)
Israeli: 54 (0.08%)
Turkish: 52 (0.08%)
Austrian: 48 (0.07%)
Ghanaian: 43 (0.07%)
Danish: 42 (0.07%)
Slovene: 42 (0.07%)
Slavic: 41 (0.06%)
Cape Verdean: 39 (0.06%)
New Zealander: 39 (0.06%)
Slovak: 34 (0.05%)
Macedonian: 27 (0.04%)
Finnish: 24 (0.04%)
Pennsylvania German: 21 (0.03%)
Celtic: 20 (0.03%)
Assyrian: 17 (0.03%)
Syrian: 16 (0.02%)
Bahamian: 15 (0.02%)
Barbadian: 15 (0.02%)
Carpatho Rusyn: 12 (0.02%)
Latvian: 11 (0.02%)
Cajun: 10 (0.02%)
Icelander: 10 (0.02%)
Trinidadian and Tobagonian: 10 (0.02%)
Jordanian: 9 (0.01%)
West Indian: 9 (0.01%)
Most common places of birth for foreign-born residents (%):
Mexico
Clearwater:
11.5% (2,399)
Florida:
5.6% (257,152)
Canada
Clearwater:
7.5% (1,563)
Florida:
2.4% (109,132)
Venezuela
Clearwater:
6.7% (1,401)
Florida:
5.7% (262,042)
Cuba
Clearwater:
4.6% (968)
Florida:
22.0% (1,006,576)
Philippines
Clearwater:
3.9% (811)
Florida:
1.8% (84,403)
India
Clearwater:
3.6% (761)
Florida:
2.1% (94,349)
Brazil
Clearwater:
3.0% (631)
Florida:
2.7% (122,906)
Poland
Clearwater:
2.9% (613)
Florida:
0.6% (25,219)
Colombia
Clearwater:
2.9% (595)
Florida:
6.5% (298,669)
El Salvador
Clearwater:
2.8% (593)
Florida:
1.1% (49,838)
Albania
Clearwater:
2.5% (521)
Florida:
0.2% (9,779)
Germany
Clearwater:
2.5% (516)
Florida:
1.2% (54,272)
Australia
Clearwater:
2.3% (478)
Florida:
0.1% (5,190)
Greece
Clearwater:
2.2% (469)
Florida:
0.2% (8,980)
Egypt
Clearwater:
2.2% (465)
Florida:
0.3% (13,998)
Jamaica
Clearwater:
2.1% (448)
Florida:
5.0% (227,319)
Vietnam
Clearwater:
2.1% (447)
Florida:
1.3% (60,604)
Italy
Clearwater:
2.1% (446)
Florida:
0.7% (30,755)
Dominican Republic
Clearwater:
2.0% (416)
Florida:
3.0% (137,727)
United Kingdom, excluding England and Scotland
Clearwater:
2.0% (409)
Florida:
0.7% (34,227)
Ukraine
Clearwater:
1.8% (371)
Florida:
0.5% (21,886)
Other Eastern Europe
Clearwater:
1.6% (336)
Florida:
0.2% (9,990)
Place of birth for U.S.-born residents:
This state: 40,461
Other state: 53,349
Northeast: 20,595
Midwest: 16,865
South: 10,711
West: 5,178
85.4% of Clearwater residents lived in the same house 1 years ago. Out of people who lived in different houses, 38.2% lived in this county. Out of people who lived in different counties, 20.9% lived in Florida.
Clearwater:
85.4%
State average:
86.3%
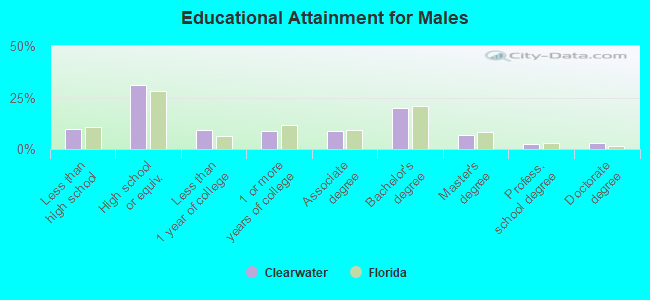
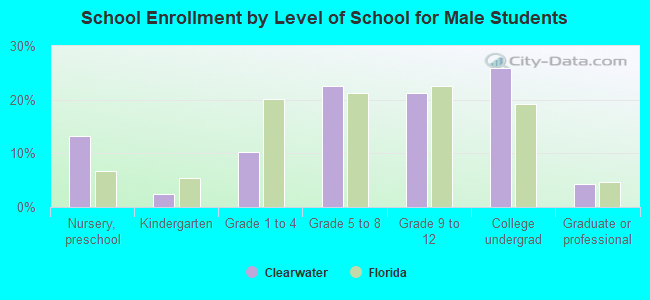
Education attainment for males 25 years and older:
No schooling: 655
Nursery to 4th grade: 165
5th and 6th grade: 503
7th and 8th grade: 525
9th grade: 266
10th grade: 492
11th grade: 852
12th grade, no diploma: 527
High school graduate (or equivalency): 12,802
Less than 1 year of college: 3,838
Some college more than 1 year, no degree: 3,496
Associate degree: 3,692
Bachelor's degree: 8,112
Master's degree: 2,864
Professional school degree: 1,075
Doctorate degree: 1,228
Education attainment for females 25 years and older:
No schooling: 474
Nursery to 4th grade: 387
5th and 6th grade: 175
7th and 8th grade: 451
9th grade: 207
10th grade: 650
11th grade: 641
12th grade, no diploma: 1,154
High school graduate (or equivalency): 14,220
Less than 1 year of college: 4,954
Some college more than 1 year, no degree: 5,334
Associate degree: 3,247
Bachelor's degree: 7,943
Master's degree: 4,904
Professional school degree: 772
Doctorate degree: 443
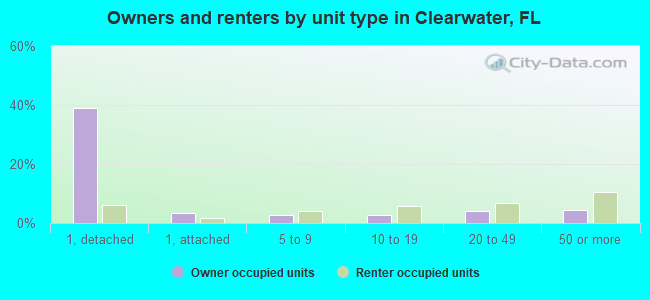
Housing units in structures:
One, detached: 21,167
One, attached: 4,110
Two: 1,896
3 or 4: 2,253
5 to 9: 5,494
10 to 19: 3,897
20 to 49: 7,341
50 or more: 11,947
Mobile homes: 3,000
Boats, RVs, vans, etc.: 26
Median worth of mobile homes: $58,000
Housing units lacking complete plumbing facilities in 2022: 0.5%
Housing units lacking complete kitchen facilities in 2022: 1.3%