Clermont, IN (Indiana) Houses and Residents
| Clermont: | $195,956 |
| Indiana: | $208,700 |
Mean price in 2022:
Detached houses: $215,135
Here: $215,135 State: $257,916
Total population: 1,402 (All urban)
Houses: 645 (615 occupied: 516 owner occupied, 111 renter occupied)
| % of renters here: | 18% |
| State: | 29% |
Housing density: 947 houses/condos per square mile
Median price asked for vacant for-sale houses and condos in 2022 in this county: $192,214.
Median contract rent in 2022: $792 (lower quartile is $681, upper quartile is $924)
Median rent asked for vacant for-rent units in 2022: $750
Median gross rent in Clermont, IN in 2022: $976
Housing units in Clermont with a mortgage: 349 (74 second mortgage, 0 home equity loan, 47 both second mortgage and home equity loan)
Houses without a mortgage: 7
Median household income for houses/condos with a mortgage: $98,888
Median household income for apartments without a mortgage: $71,045
Median monthly housing costs: $1,052
Compare current foreclosures near Clermont, IN:
| Photo | Address | Area | Beds / Baths | Price | Details |
|---|---|---|---|---|---|

|
#1
Wallace Ave
Indianapolis, IN 46201
|
801 sq. feet
|
1 baths 2 beds |
$175,000
|
show details |

|
#2
W 13th St
Indianapolis, IN 46214
|
1,300 sq. feet
|
1 baths 3 beds |
$112,320
|
show details |

|
#3
Ruth Dr
Indianapolis, IN 46240
|
848 sq. feet
|
1 baths 2 beds |
$245,000
|
show details |

|
#4
Wicklow Way
Brownsburg, IN 46112
|
3,158 sq. feet
|
2 baths 4 beds |
$479,900
|
show details |

|
#5
Powell Rd
Indianapolis, IN 46221
|
1,100 sq. feet
|
1 baths 3 beds |
$289,900
|
show details |

|
#6
Zoeller Ave
Indianapolis, IN 46226
|
746 sq. feet
|
1 baths 2 beds |
show details | |

|
#7
Newhart St
Indianapolis, IN 46217
|
2,170 sq. feet
|
1 baths 4 beds |
show details | |

|
#8
Hollingsworth Dr
Indianapolis, IN 46268
|
1,872 sq. feet
|
1 baths 4 beds |
show details | |

|
#9
E 33rd St
Indianapolis, IN 46226
|
1,188 sq. feet
|
1 baths 3 beds |
show details | |

|
#10
N Arsenal Ave
Indianapolis, IN 46218
|
1,330 sq. feet
|
- baths 3 beds |
show details |
| Photo | Address | Area | Beds / Baths | Price | Details |
|---|---|---|---|---|---|

|
#11
Five Points Rd
Indianapolis, IN 46239
|
2,088 sq. feet
|
2 baths 3 beds |
show details | |

|
#12
Milhouse Rd
Indianapolis, IN 46221
|
1,187 sq. feet
|
1 baths 3 beds |
show details | |

|
#13
Brookside Parkway North Dr
Indianapolis, IN 46201
|
2,430 sq. feet
|
1 baths 4 beds |
show details | |

|
#14
Pamona Dr
Indianapolis, IN 46214
|
2,056 sq. feet
|
1 baths 3 beds |
show details | |

|
#15
E 19th St
Indianapolis, IN 46218
|
768 sq. feet
|
1 baths 2 beds |
show details | |

|
#16
Kellum Dr
Indianapolis, IN 46221
|
1,618 sq. feet
|
2 baths 3 beds |
show details | |

|
#17
Danver Ln
Beech Grove, IN 46107
|
2,096 sq. feet
|
3 baths 4 beds |
show details | |

|
#18
Osman Dr
Avon, IN 46123
|
2,191 sq. feet
|
2 baths 4 beds |
show details | |

|
#19
Skyward Ln
Indianapolis, IN 46234
|
3,648 sq. feet
|
2 baths 4 beds |
show details | |

|
#20
N Keystone Ave
Indianapolis, IN 46220
|
1,104 sq. feet
|
2 baths 3 beds |
show details |
| Photo | Address | Area | Beds / Baths | Price | Details |
|---|---|---|---|---|---|

|
#21
N Gray St
Indianapolis, IN 46201
|
1,309 sq. feet
|
2 baths 3 beds |
show details | |

|
#22
Adams St
Indianapolis, IN 46218
|
- sq. feet
|
1 baths 3 beds |
show details | |

|
#23
S Biltmore Ave
Indianapolis, IN 46241
|
2,904 sq. feet
|
3 baths 4 beds |
show details | |

|
#24
N Oakland Ave
Indianapolis, IN 46201
|
1,704 sq. feet
|
1 baths 3 beds |
show details | |

|
#25
Taylor St
Mooresville, IN 46158
|
1,792 sq. feet
|
1 baths 1 beds |
show details | |

|
#26
Ironwood Dr
Carmel, IN 46033
|
2,594 sq. feet
|
2 baths 5 beds |
show details | |

|
#27
Bromley Pl
Indianapolis, IN 46219
|
2,424 sq. feet
|
2 baths 3 beds |
show details | |

|
#28
Rockville Rd
Indianapolis, IN 46222
|
800 sq. feet
|
1 baths 2 beds |
show details | |

|
#29
E Brunswick Ave
Indianapolis, IN 46227
|
1,056 sq. feet
|
1 baths 2 beds |
show details | |

|
#30
S Tacoma Ave
Indianapolis, IN 46237
|
1,140 sq. feet
|
1 baths 3 beds |
show details |
| Photo | Address | Area | Beds / Baths | Price | Details |
|---|---|---|---|---|---|

|
#31
King Ave
Indianapolis, IN 46222
|
1,248 sq. feet
|
1 baths 4 beds |
show details | |

|
#32
E Brunswick Ave
Indianapolis, IN 46227
|
1,944 sq. feet
|
1 baths 3 beds |
show details | |

|
#33
Aylesford Ln
Indianapolis, IN 46228
|
2,203 sq. feet
|
2 baths 3 beds |
show details | |

|
#34
Trails End
Brownsburg, IN 46112
|
1,402 sq. feet
|
2 baths 3 beds |
show details | |

|
#35
Clay Spring Dr
Carmel, IN 46032
|
5,648 sq. feet
|
3 baths 3 beds |
show details | |

|
#36
Sycamore Forge Ln
Indianapolis, IN 46254
|
1,664 sq. feet
|
1 baths 3 beds |
show details | |

|
#37
Woodland Heights Dr
Avon, IN 46123
|
2,376 sq. feet
|
2 baths 3 beds |
show details | |

|
#38
E Ayrshire Cir
Camby, IN 46113
|
3,196 sq. feet
|
2 baths 4 beds |
show details | |

|
#39
Creekbend Blvd
Indianapolis, IN 46217
|
1,820 sq. feet
|
1 baths 3 beds |
show details | |

|
#40
Broadway St
Indianapolis, IN 46280
|
960 sq. feet
|
1 baths 3 beds |
show details |
| Photo | Address | Area | Beds / Baths | Price | Details |
|---|---|---|---|---|---|

|
#41
E Edna Mills Dr
Camby, IN 46113
|
1,687 sq. feet
|
2 baths 4 beds |
show details | |

|
#42
Brooks Bnd
Brownsburg, IN 46112
|
1,920 sq. feet
|
2 baths 4 beds |
show details | |

|
#43
Kessler Boulevard North Dr
Indianapolis, IN 46228
|
1,620 sq. feet
|
1 baths 3 beds |
show details | |

|
#44
Zachary Ln
Indianapolis, IN 46231
|
3,051 sq. feet
|
2 baths 4 beds |
show details | |

|
#45
Shadowbrook Dr
Plainfield, IN 46168
|
2,340 sq. feet
|
2 baths 4 beds |
show details | |

|
#46
Sunrise Ln
Lizton, IN 46149
|
1,560 sq. feet
|
2 baths 3 beds |
show details | |

|
#47
Shadow Pointe Dr
Indianapolis, IN 46254
|
2,036 sq. feet
|
1 baths 4 beds |
show details | |

|
#48
Melbourne Rd
Indianapolis, IN 46228
|
3,564 sq. feet
|
1 baths 4 beds |
show details | |

|
#49
Guion Rd
Indianapolis, IN 46222
|
2,519 sq. feet
|
1 baths 4 beds |
show details | |

|
Check over 1 million property listings on Foreclosure.com!
|
browse all offers | |||

Latest news about housing in Clermont, IN collected exclusively by city-data.com from local newspapers, TV, and radio stations

 | Burbs within 30-min of the city, new home? (4 replies) |
| Notorious neighborhood (7 replies) |
| Gone but not forgotten in Indianapolis (277 replies) |
| Need an Apartment in Brownsburg (8 replies) |
| Most dangerous neighborhood in Indianapolis? (271 replies) |
| Too many cops in Indy (32 replies) |

Median year apartment built: 1973
Household type by relationship:
Households: 1,620- Male householders: 373 (105 living alone), Female householders: 235 (55 living alone)
327 spouses (275 opposite-sex spouses), 53 unmarried partners, (53 opposite-sex unmarried partners), 515 children (444 natural, 14 adopted, 55 stepchildren), 52 grandchildren, 8 brothers or sisters, 10 parents, 0 foster children, 24 other relatives, 16 non-relatives
Size of family households: 212 2-persons, 109 3-persons, 68 4-persons, 28 5-persons, 26 6-persons.
Size of nonfamily households: 156 1-person, 25 2-persons, 2 3-persons, 2 4-persons.
225 married couples with children.
105 single-parent households (26 men, 79 women).
84.4% of residents of Clermont speak English at home.
10.6% of residents speak Spanish at home (65% speak English very well, 32% speak English well, 3% speak English not well).
1.1% of residents speak other Indo-European language at home (100% speak English very well).
1.0% of residents speak Asian or Pacific Island language at home (100% speak English very well).
0.3% of residents speak other language at home (100% speak English very well).
Foreign born population: 122 (7.5%)
(46.7% of them are naturalized citizens)
| Here: | 6.8 |
| State: | 6.6 |
| Here: | 5.1 |
| State: | 4.3 |

- Bedrooms in owner-occupied houses and condos in Clermont, Indiana
- 0no bedroom
- 61 bedroom
- 1062 bedrooms
- 2403 bedrooms
- 1454 bedrooms
- 205+ bedrooms

- Bedrooms in renter-occupied apartments in Clermont, Indiana
- 0no bedroom
- 241 bedroom
- 372 bedrooms
- 413 bedrooms
- 64 bedrooms
- 35+ bedrooms

- Cars and other vehicles available in Clermont in owner-occupied houses/condos
- 0no vehicle
- 1331 vehicle
- 1792 vehicles
- 1133 vehicles
- 854 vehicles
- 65+ vehicles

- Cars and other vehicles available in Clermont in renter-occupied apartments
- 8no vehicle
- 381 vehicle
- 582 vehicles
- 43 vehicles
- 04 vehicles
- 35+ vehicles

- Rooms in owner-occupied houses in Clermont, Indiana
- 01 room
- 02 rooms
- 23 rooms
- 554 rooms
- 505 rooms
- 1166 rooms
- 1037 rooms
- 668 rooms
- 1259+ rooms

- Rooms in renter-occupied apartments in Clermont, Indiana
- 01 room
- 152 rooms
- 03 rooms
- 164 rooms
- 265 rooms
- 316 rooms
- 107 rooms
- 128 rooms
- 09+ rooms


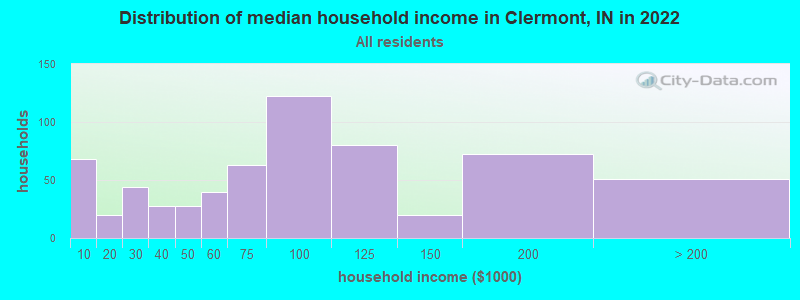
Clermont, IN household income distribution

- 68Less than $10,000
- 20$10,000 to $19,999
- 44$20,000 to $29,999
- 28$30,000 to $39,999
- 28$40,000 to $49,999
- 40$50,000 to $59,999
- 63$60,000 to $74,999
- 122$75,000 to $99,999
- 80$100,000 to $124,999
- 20$125,000 to $149,999
- 72$150,000 to $199,999
- 51$200,000 or more
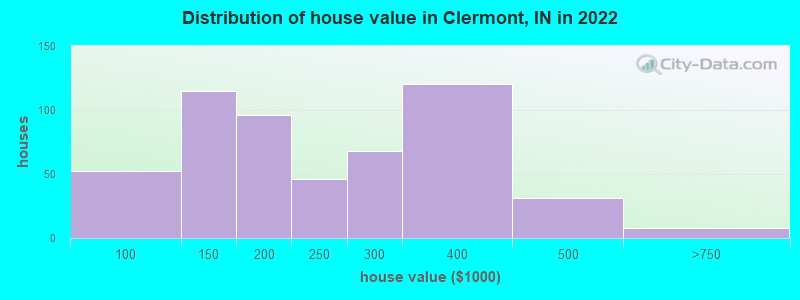
Home value of owner - occupied houses in 2022 in Clermont, IN
-
- 1$50,000 to $59,999
- 28$60,000 to $69,999
- 1$70,000 to $79,999
- 6$80,000 to $89,999
- 14$90,000 to $99,999
- 65$100,000 to $124,999
- 49$125,000 to $149,999
- 63$150,000 to $174,999
- 33$175,000 to $199,999
- 46$200,000 to $249,999
- 68$250,000 to $299,999
- 119$300,000 to $399,999
- 31$400,000 to $499,999
- 8$500,000 to $749,999
Rent paid by renters in 2022 in Clermont, IN
-
- 3$450 to $499
- 1$600 to $649
- 16$650 to $699
- 3$700 to $749
- 14$750 to $799
- 16$800 to $899
- 10$900 to $999
- 1$2,000 to $2,499
- 28No cash rent


Percentage of workers working in this county: 78.9%
Number of people working at home: 183 (20.0% of all workers)
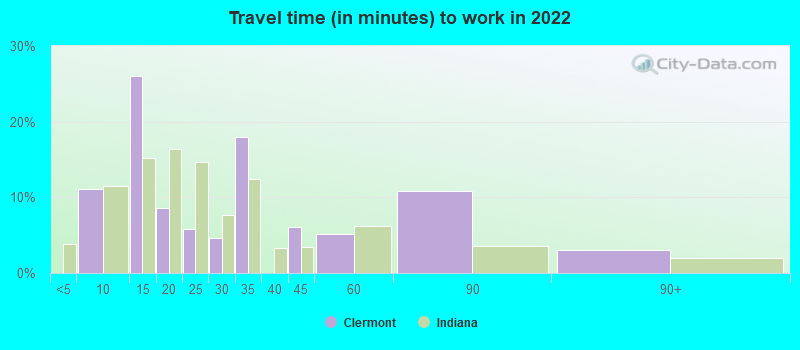
Travel time to work (commute)
- Less than 5 minutes: 29
- 5 to 9 minutes: 25
- 10 to 14 minutes: 59
- 15 to 19 minutes: 146
- 20 to 24 minutes: 182
- 25 to 29 minutes: 52
- 30 to 34 minutes: 142
- 35 to 39 minutes: 9
- 40 to 44 minutes: 23
- 45 to 59 minutes: 63
- 60 to 89 minutes: 7
- 90 or more minutes: 6
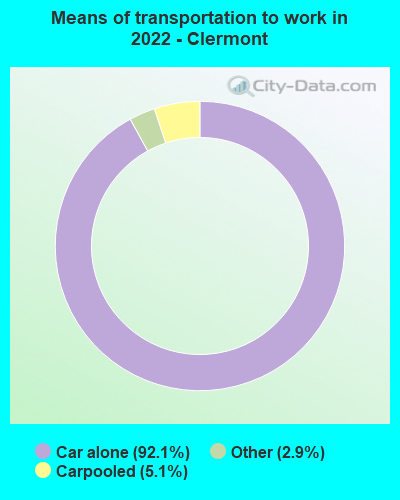
Means of transportation to work:
- Drove a car alone: 644 (74.1%)
- Carpooled: 41 (4.7%)
- Taxi: 28 (3.2%)
- Worked at home: 183 (21.1%)

- Unemployment by race in 2022
- Unemployment rate for White non-Hispanic residents
- 6.8%Males
- 0.5%Females

- Year of entry for the foreign-born population in Clermont, Indiana
- 02010 or later
- 532000 to 2009
- 01990 to 1999
- 51980 to 1989
- 01970 to 1979
- 16Before 1970
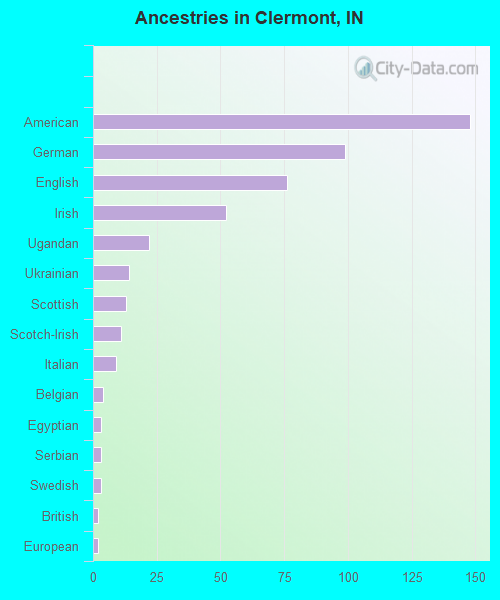
First ancestries reported:
- American: 148 (18.6%)
- German: 99 (12.5%)
- English: 76 (9.6%)
- Irish: 52 (6.5%)
- Ugandan: 22 (2.8%)
- Ukrainian: 14 (1.8%)
- Scottish: 13 (1.6%)
- Scotch-Irish: 11 (1.4%)
- Italian: 9 (1.1%)
- Belgian: 4 (0.5%)
- Egyptian: 3 (0.4%)
- Serbian: 3 (0.4%)
- Swedish: 3 (0.4%)
- British: 2 (0.3%)
- European: 2 (0.3%)
- Dutch: 1 (0.1%)
- French: 1 (0.1%)
- Slovak: 1 (0.1%)
Most common places of birth for foreign-born residents (%):
| Clermont: | 33.9% (38) |
| Indiana: | 1.6% (5,892) |
| Clermont: | 17.9% (20) |
| Indiana: | 0.5% (1,962) |
| Clermont: | 17.0% (19) |
| Indiana: | 0.1% (366) |
| Clermont: | 11.6% (13) |
| Indiana: | 2.2% (8,253) |
| Clermont: | 9.8% (11) |
| Indiana: | 2.3% (8,656) |
| Clermont: | 9.8% (11) |
| Indiana: | 27.0% (101,996) |
| Clermont: | 4.5% (5) |
| Indiana: | 1.8% (6,645) |
Place of birth for U.S.-born residents:
- This state: 1,133
- Other state: 326
- Northeast: 49
- Midwest: 169
- South: 68
- West: 39
90.8% of Clermont residents lived in the same house 1 years ago.
Out of people who lived in different houses, 40.8% lived in this county.
Out of people who lived in different counties, 90.7% lived in Indiana.
| Clermont: | 90.8% |
| State average: | 87.1% |
Education attainment for males 25 years and older:
- No schooling: 27
- Nursery to 4th grade: 0
- 5th and 6th grade: 9
- 7th and 8th grade: 4
- 9th grade: 1
- 10th grade: 11
- 11th grade: 9
- 12th grade, no diploma: 16
- High school graduate (or equivalency): 108
- Less than 1 year of college: 46
- Some college more than 1 year, no degree: 52
- Associate degree: 36
- Bachelor's degree: 154
- Master's degree: 22
- Professional school degree: 28
- Doctorate degree: 0

Education attainment for females 25 years and older:
- No schooling: 0
- Nursery to 4th grade: 0
- 5th and 6th grade: 0
- 7th and 8th grade: 0
- 9th grade: 0
- 10th grade: 21
- 11th grade: 5
- 12th grade, no diploma: 0
- High school graduate (or equivalency): 178
- Less than 1 year of college: 46
- Some college more than 1 year, no degree: 66
- Associate degree: 33
- Bachelor's degree: 131
- Master's degree: 71
- Professional school degree: 0
- Doctorate degree: 3


Housing units in structures:
- One, detached: 626
- One, attached: 13
- Mobile homes: 5
House/condo owner moved in on average 12 years ago
Renter moved in on average 8 years ago

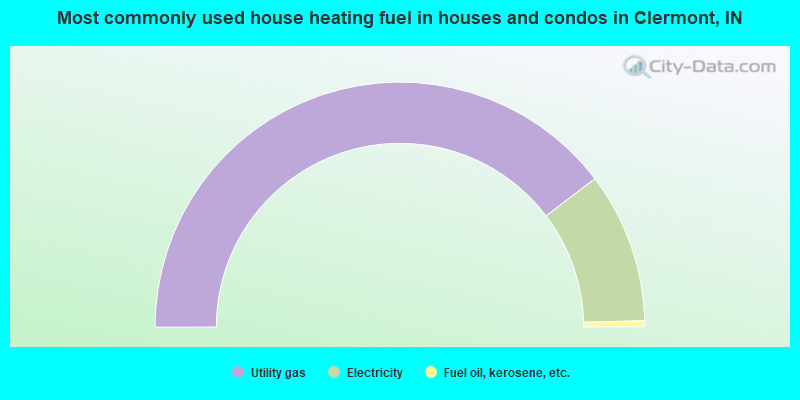
- 79.3%Utility gas
- 19.9%Electricity
- 0.8%Fuel oil, kerosene, etc.
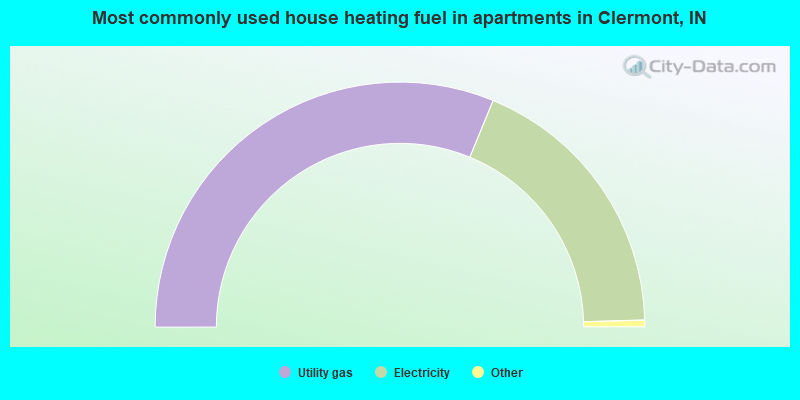
- 63.0%Utility gas
- 37.0%Electricity
Private vs. public school enrollment:
| Here: | 6.9% |
| Indiana: | 14.9% |
| Here: | 16.5% |
| Indiana: | 11.4% |
| Here: | 22.1% |
| Indiana: | 22.3% |


