Cloverdale, CA (California) Houses and Residents
| Cloverdale: | $618,242 |
| California: | $715,900 |
Mean price in 2022:
Detached houses: $650,552
Here: $650,552 State: $988,808 Townhouses or other attached units: $466,667
Here: $466,667 State: $838,546 In 5-or-more-unit structures: $270,031
Here: $270,031 State: $730,996 Mobile homes: $88,965
Here: $88,965 State: $184,506
Total population: 8,796 (Urban population: 7,073 (all inside urban clusters), Rural population: 14 (all nonfarm))
Houses: 3,569 (3,493 occupied: 2,447 owner occupied, 1,086 renter occupied)
| % of renters here: | 31% |
| State: | 44% |
Housing density: 1,415 houses/condos per square mile
Median price asked for vacant for-sale houses and condos in 2022 in this county: $439,673.
Median contract rent in 2022: $1,089 (lower quartile is $757, upper quartile is $1,756)
Median rent asked for vacant for-rent units in 2022: $30,707
Median gross rent in Cloverdale, CA in 2022: $1,237
Housing units in Cloverdale with a mortgage: 1,749 (102 second mortgage, 0 home equity loan, 71 both second mortgage and home equity loan)
Houses without a mortgage: 15
Median household income for houses/condos with a mortgage: $133,198
Median household income for apartments without a mortgage: $60,887
Median monthly housing costs: $1,862
Compare current foreclosures near Cloverdale, CA:
| Photo | Address | Area | Beds / Baths | Price | Details |
|---|---|---|---|---|---|

|
#1
Theresa Dr
Cloverdale, CA 95425
|
1,344 sq. feet
|
1 baths 3 beds |
show details | |

|
#2
Elm St
Cloverdale, CA 95425
|
900 sq. feet
|
1 baths 3 beds |
show details | |

|
#3
Elm St
Cloverdale, CA 95425
|
900 sq. feet
|
1 baths 3 beds |
show details | |

|
#4
W 4th St
Cloverdale, CA 95425
|
1,282 sq. feet
|
2 baths 2 beds |
show details | |

|
#5
Tarman Dr
Cloverdale, CA 95425
|
1,260 sq. feet
|
1 baths 3 beds |
show details | |

|
#6
River Rd
Cloverdale, CA 95425
|
- sq. feet
|
- baths - beds |
show details | |

|
#7
Treadway Ct
Cloverdale, CA 95425
|
- sq. feet
|
- baths - beds |
show details | |

|
#8
Timber Ridge Ct
Cloverdale, CA 95425
|
- sq. feet
|
- baths - beds |
show details | |

|
#9
Theresa Dr
Cloverdale, CA 95425
|
- sq. feet
|
- baths - beds |
show details | |

|
#10
Primrose Ln
Cloverdale, CA 95425
|
- sq. feet
|
- baths - beds |
show details |
| Photo | Address | Area | Beds / Baths | Price | Details |
|---|---|---|---|---|---|

|
#11
Hilltop Dr
Kelseyville, CA 95451
|
2,023 sq. feet
|
2 baths 3 beds |
show details | |

|
#12
Konocti Rd
Kelseyville, CA 95451
|
1,222 sq. feet
|
1 baths 2 beds |
show details | |

|
#13
Chiquita Rd
Healdsburg, CA 95448
|
1,606 sq. feet
|
1 baths 2 beds |
show details | |

|
#14
Pozzan Rd
Healdsburg, CA 95448
|
1,320 sq. feet
|
2 baths 2 beds |
show details | |

|
#15
March Ave
Healdsburg, CA 95448
|
1,692 sq. feet
|
3 baths 4 beds |
show details | |

|
#16
Chiquita Rd
Healdsburg, CA 95448
|
1,606 sq. feet
|
1 baths 2 beds |
show details | |

|
#17
Ward St
Healdsburg, CA 95448
|
1,074 sq. feet
|
1 baths 2 beds |
show details | |

|
#18
Tzabaco Creek Rd
Geyserville, CA 95441
|
1,536 sq. feet
|
2 baths 3 beds |
show details | |

|
#19
Hilltop Rd
Healdsburg, CA 95448
|
949 sq. feet
|
1 baths 1 beds |
show details | |

|
#20
Kennedy L 6
Healdsburg, CA 95448
|
- sq. feet
|
- baths - beds |
show details |
| Photo | Address | Area | Beds / Baths | Price | Details |
|---|---|---|---|---|---|

|
#21
Feliz Creek Rd
Hopland, CA 95449
|
- sq. feet
|
- baths - beds |
show details | |

|
#22
Gifford Spgs Rd
Cobb, CA 95426
|
- sq. feet
|
- baths - beds |
show details | |

|
Check over 1 million property listings on Foreclosure.com!
|
browse all offers | |||

Latest news about housing in Cloverdale, CA collected exclusively by city-data.com from local newspapers, TV, and radio stations


Median year apartment built: 1975
Household type by relationship:
Households: 8,857- Male householders: 1,458 (348 living alone), Female householders: 1,942 (468 living alone)
1,725 spouses (1,715 opposite-sex spouses), 298 unmarried partners, (267 opposite-sex unmarried partners), 2,587 children (2,527 natural, 0 adopted, 60 stepchildren), 9 grandchildren, 122 brothers or sisters, 37 parents, 0 foster children, 96 other relatives, 489 non-relatives
- In group quarters: 88
Size of family households: 1,065 2-persons, 406 3-persons, 636 4-persons, 117 5-persons, 30 6-persons, 56 7-or-more-persons.
Size of nonfamily households: 899 1-person, 213 2-persons, 29 3-persons, 23 4-persons.
1,161 married couples with children.
395 single-parent households (158 men, 237 women).
67.4% of residents of Cloverdale speak English at home.
30.5% of residents speak Spanish at home (59% speak English very well, 33% speak English well, 8% speak English not well).
0.6% of residents speak other Indo-European language at home (86% speak English very well, 14% speak English not well).
1.0% of residents speak Asian or Pacific Island language at home (4% speak English very well, 29% speak English well, 67% speak English not well).
0.9% of residents speak other language at home (100% speak English very well).
Foreign born population: 1,547 (17.5%)
(44.4% of them are naturalized citizens)
| Here: | 5.6 |
| State: | 6.0 |
| Here: | 3.8 |
| State: | 3.9 |

- Bedrooms in owner-occupied houses and condos in Cloverdale, California
- 21no bedroom
- 01 bedroom
- 7242 bedrooms
- 9993 bedrooms
- 5524 bedrooms
- 1525+ bedrooms

- Bedrooms in renter-occupied apartments in Cloverdale, California
- 95no bedroom
- 3531 bedroom
- 3312 bedrooms
- 2643 bedrooms
- 434 bedrooms
- 05+ bedrooms

- Cars and other vehicles available in Cloverdale in owner-occupied houses/condos
- 9no vehicle
- 5661 vehicle
- 1,0052 vehicles
- 5503 vehicles
- 2134 vehicles
- 1055+ vehicles

- Cars and other vehicles available in Cloverdale in renter-occupied apartments
- 99no vehicle
- 3631 vehicle
- 2802 vehicles
- 2073 vehicles
- 834 vehicles
- 535+ vehicles

- Rooms in owner-occupied houses in Cloverdale, California
- 01 room
- 212 rooms
- 553 rooms
- 2144 rooms
- 7205 rooms
- 6156 rooms
- 3387 rooms
- 3408 rooms
- 1469+ rooms

- Rooms in renter-occupied apartments in Cloverdale, California
- 681 room
- 1662 rooms
- 2073 rooms
- 2374 rooms
- 1215 rooms
- 1566 rooms
- 797 rooms
- 518 rooms
- 09+ rooms


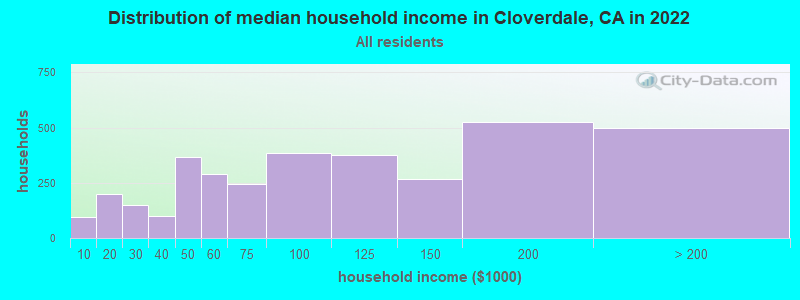
Cloverdale, CA household income distribution

- 96Less than $10,000
- 198$10,000 to $19,999
- 151$20,000 to $29,999
- 99$30,000 to $39,999
- 368$40,000 to $49,999
- 290$50,000 to $59,999
- 245$60,000 to $74,999
- 383$75,000 to $99,999
- 377$100,000 to $124,999
- 266$125,000 to $149,999
- 525$150,000 to $199,999
- 497$200,000 or more
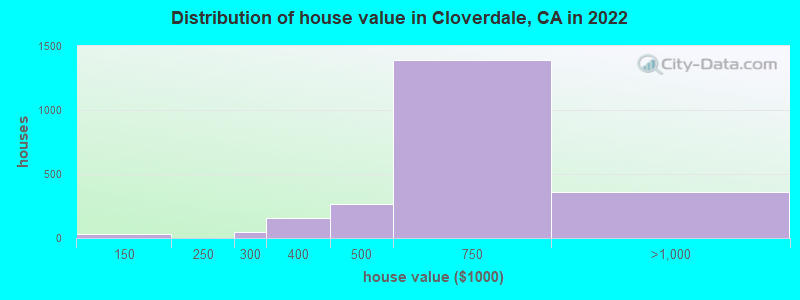
Home value of owner - occupied houses in 2022 in Cloverdale, CA
-
- 8$20,000 to $24,999
- 12$60,000 to $69,999
- 11$100,000 to $124,999
- 23$125,000 to $149,999
- 44$250,000 to $299,999
- 155$300,000 to $399,999
- 267$400,000 to $499,999
- 1,393$500,000 to $749,999
- 351$750,000 to $999,999
- 10$1,000,000 to $1,499,999
Rent paid by renters in 2022 in Cloverdale, CA
-
- 11$200 to $249
- 57$250 to $299
- 64$300 to $349
- 24$400 to $449
- 9$500 to $549
- 31$550 to $599
- 13$600 to $649
- 46$700 to $749
- 114$800 to $899
- 154$900 to $999
- 133$1,000 to $1,249
- 158$1,250 to $1,499
- 94$1,500 to $1,999
- 82$2,000 to $2,499
- 55$2,500 to $2,999
- 50$3,000 to $3,499
- 90No cash rent


Percentage of workers working in this county: 87.1%
Number of people working at home: 437 (10.1% of all workers)
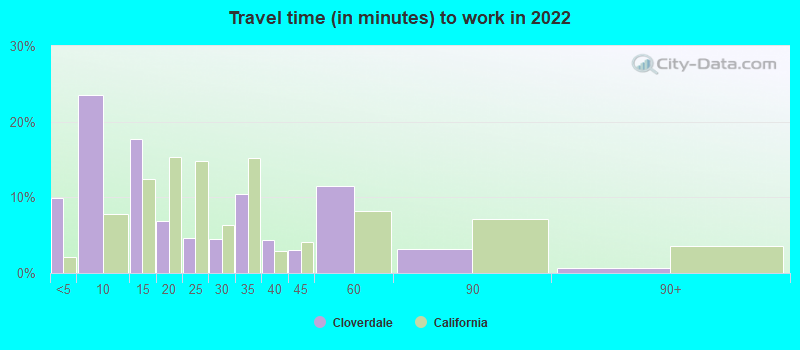
Travel time to work (commute)
- Less than 5 minutes: 213
- 5 to 9 minutes: 661
- 10 to 14 minutes: 200
- 15 to 19 minutes: 361
- 20 to 24 minutes: 260
- 25 to 29 minutes: 197
- 30 to 34 minutes: 583
- 35 to 39 minutes: 190
- 40 to 44 minutes: 357
- 45 to 59 minutes: 666
- 60 to 89 minutes: 160
- 90 or more minutes: 60
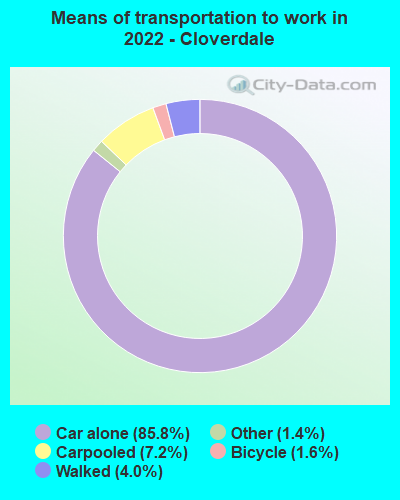
Means of transportation to work:
- Drove a car alone: 1,924 (72.9%)
- Carpooled: 133 (5.0%)
- Taxi: 27 (1.0%)
- Bicycle: 41 (1.6%)
- Walked: 103 (3.9%)
- Worked at home: 437 (16.6%)

- Unemployment by race in 2022
- Unemployment rate for White non-Hispanic residents
- 0.7%Males
- 1.4%Females
- Unemployment rate for Asian residents
- 6.2%Females
- Unemployment rate for other race residents
- 4.8%Females
- Unemployment rate for two or more race residents
- 11.6%Males
- Unemployment rate for Hispanic or Latino residents
- 6.4%Males
- 1.9%Females

- Year of entry for the foreign-born population in Cloverdale, California
- 3672010 or later
- 2342000 to 2009
- 4961990 to 1999
- 3661980 to 1989
- 1491970 to 1979
- 137Before 1970

First ancestries reported:
- English: 258 (6.7%)
- Irish: 231 (6.0%)
- American: 201 (5.2%)
- German: 185 (4.8%)
- Italian: 176 (4.6%)
- European: 108 (2.8%)
- Hungarian: 79 (2.1%)
- Scottish: 72 (1.9%)
- Northern European: 55 (1.4%)
- Norwegian: 50 (1.3%)
- Scotch-Irish: 42 (1.1%)
- Czech: 30 (0.8%)
- Yugoslavian: 27 (0.7%)
- British: 25 (0.7%)
- Dutch: 21 (0.5%)
- French: 21 (0.5%)
- Icelander: 19 (0.5%)
- Swedish: 19 (0.5%)
- Danish: 15 (0.4%)
- Canadian: 10 (0.3%)
- Finnish: 10 (0.3%)
- French Canadian: 10 (0.3%)
- Scandinavian: 4 (0.1%)
Most common places of birth for foreign-born residents (%):
| Cloverdale: | 77.3% (1,201) |
| California: | 37.2% (3,881,193) |
| Cloverdale: | 4.4% (68) |
| California: | 0.6% (65,335) |
| Cloverdale: | 3.9% (61) |
| California: | 4.2% (440,287) |
| Cloverdale: | 3.7% (58) |
| California: | 0.1% (10,936) |
| Cloverdale: | 1.9% (29) |
| California: | 1.7% (176,274) |
| Cloverdale: | 1.5% (24) |
| California: | 0.1% (9,241) |
Place of birth for U.S.-born residents:
- This state: 5,634
- Other state: 1,624
- Northeast: 181
- Midwest: 439
- South: 493
- West: 530
89.9% of Cloverdale residents lived in the same house 1 years ago.
Out of people who lived in different houses, 35.2% lived in this county.
Out of people who lived in different counties, 71.6% lived in California.
| Cloverdale: | 89.9% |
| State average: | 88.9% |
Education attainment for males 25 years and older:
- No schooling: 81
- Nursery to 4th grade: 6
- 5th and 6th grade: 14
- 7th and 8th grade: 26
- 9th grade: 73
- 10th grade: 94
- 11th grade: 35
- 12th grade, no diploma: 393
- High school graduate (or equivalency): 692
- Less than 1 year of college: 189
- Some college more than 1 year, no degree: 591
- Associate degree: 375
- Bachelor's degree: 415
- Master's degree: 255
- Professional school degree: 67
- Doctorate degree: 20

Education attainment for females 25 years and older:
- No schooling: 0
- Nursery to 4th grade: 49
- 5th and 6th grade: 29
- 7th and 8th grade: 0
- 9th grade: 134
- 10th grade: 8
- 11th grade: 54
- 12th grade, no diploma: 167
- High school graduate (or equivalency): 490
- Less than 1 year of college: 462
- Some college more than 1 year, no degree: 490
- Associate degree: 457
- Bachelor's degree: 483
- Master's degree: 291
- Professional school degree: 73
- Doctorate degree: 0


Housing units in structures:
- One, detached: 2,577
- One, attached: 220
- Two: 151
- 3 or 4: 89
- 5 to 9: 303
- 10 to 19: 12
- 20 to 49: 54
- 50 or more: 27
- Mobile homes: 132
Median worth of mobile homes: $129,698
House/condo owner moved in on average 13 years ago
Renter moved in on average 6 years ago

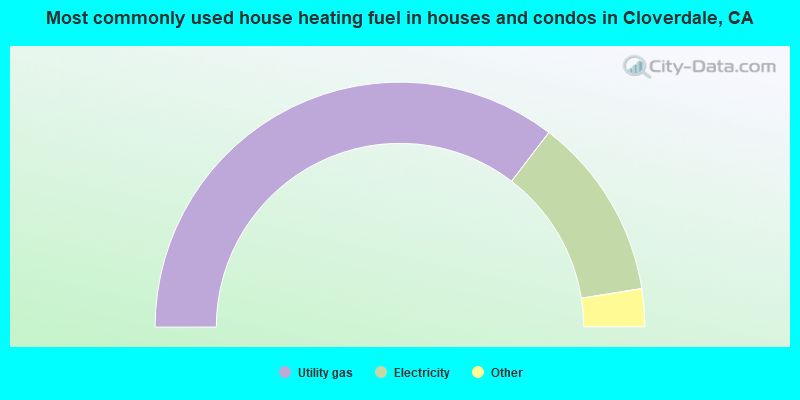
- 70.8%Utility gas
- 24.2%Electricity
- 2.4%Other fuel
- 1.6%Wood
- 1.0%Solar energy
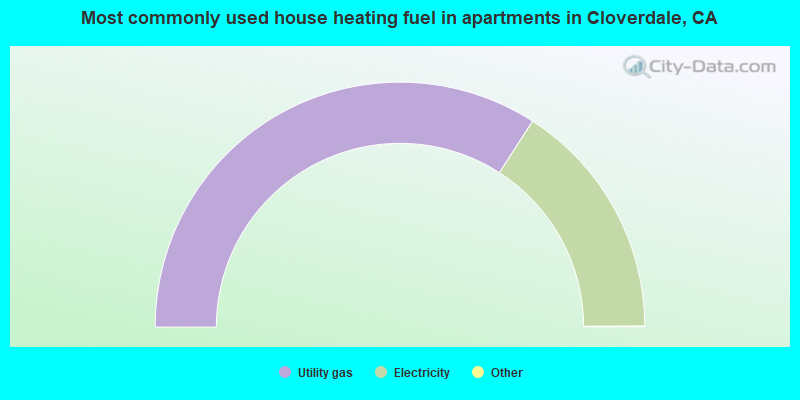
- 68.3%Utility gas
- 31.7%Electricity
Private vs. public school enrollment:
| Here: | 4.0% |
| California: | 10.5% |
| Here: | 0.0% |
| California: | 8.5% |
| Here: | 6.9% |
| California: | 15.9% |


