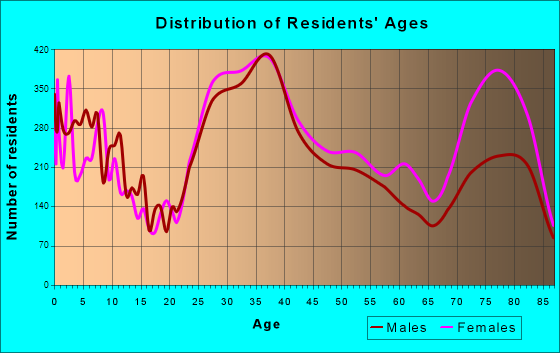
Coconut Creek, FL (Florida) Houses and Residents
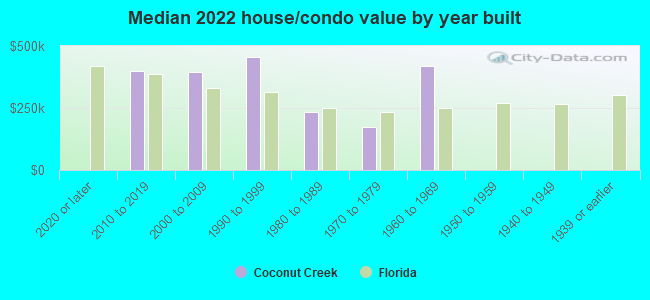
| Coconut Creek: | $281,583 |
| Florida: | $354,100 |
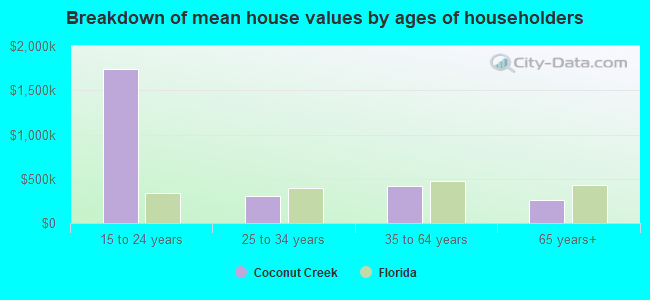
Mean price in 2022:
Detached houses: $551,725
Here: $551,725 State: $500,941 Townhouses or other attached units: $357,063
Here: $357,063 State: $370,869 In 2-unit structures: $348,067
Here: $348,067 State: $423,188 In 3-to-4-unit structures: $218,229
Here: $218,229 State: $309,944 In 5-or-more-unit structures: $188,402
Here: $188,402 State: $447,145 Mobile homes: $149,117
Here: $149,117 State: $113,202
Total population: 58,536 (Urban population: 43,327, Rural population: 0)
Houses: 27,187 (23,904 occupied: 15,783 owner occupied, 8,266 renter occupied)
| % of renters here: | 34% |
| State: | 33% |
Housing density: 2,355 houses/condos per square mile
Median price asked for vacant for-sale houses and condos in 2022: $319,088.
Median contract rent in 2022: $1,904 (lower quartile is $1,513, upper quartile is over $2,000)
Median rent asked for vacant for-rent units in 2022: $1,654
Median gross rent in Coconut Creek, FL in 2022: $1,976
Housing units in Coconut Creek with a mortgage: 8,759 (638 second mortgage, 5 home equity loan, 614 both second mortgage and home equity loan)
Houses without a mortgage: 220
Median household income for houses/condos with a mortgage: $98,612
Median household income for apartments without a mortgage: $52,915
Median monthly housing costs: $1,622
Compare current foreclosures near Coconut Creek, FL:
| Photo | Address | Area | Beds / Baths | Price | Details |
|---|---|---|---|---|---|

|
#1
NW 104th Ave Apt 405
Fort Lauderdale, FL 33322
|
965 sq. feet
|
2 baths 2 beds |
$112,000
|
show details |

|
#2
Poppy Pl 52-B
Delray Beach, FL 33484
|
1,220 sq. feet
|
2 baths 2 beds |
$193,800
|
show details |

|
#3
NW 99th Ave
Pompano Beach, FL 33076
|
4,003 sq. feet
|
3 baths 5 beds |
$878,800
|
show details |

|
#4
Ashmont Cir # 210
Fort Lauderdale, FL 33321
|
1,010 sq. feet
|
2 baths 2 beds |
$214,900
|
show details |

|
#5
Bridgewood Dr
Boca Raton, FL 33434
|
1,400 sq. feet
|
2 baths 2 beds |
$165,000
|
show details |

|
#6
NE 11th St Apt 310
Fort Lauderdale, FL 33304
|
976 sq. feet
|
1 baths 1 beds |
$229,500
|
show details |

|
#7
Port Royale Dr N Apt 905
Fort Lauderdale, FL 33308
|
1,290 sq. feet
|
2 baths 2 beds |
$374,400
|
show details |

|
#8
SW 13th St
Boca Raton, FL 33486
|
1,596 sq. feet
|
2 baths 4 beds |
$535,500
|
show details |

|
#9
Radice Crt Apt 805
Fort Lauderdale, FL 33319
|
1,149 sq. feet
|
2 baths 1 beds |
$165,000
|
show details |

|
#10
Briarwood Cir Apt 4
Boynton Beach, FL 33437
|
2,227 sq. feet
|
2 baths 2 beds |
$321,100
|
show details |
| Photo | Address | Area | Beds / Baths | Price | Details |
|---|---|---|---|---|---|

|
#11
Trent Dr # 207
Fort Lauderdale, FL 33321
|
1,456 sq. feet
|
2 baths 2 beds |
$202,350
|
show details |

|
#12
Westgate Ln Apt D
Boynton Beach, FL 33436
|
1,808 sq. feet
|
2 baths 2 beds |
$130,000
|
show details |

|
#13
NE 35th St
Fort Lauderdale, FL 33306
|
4,419 sq. feet
|
4 baths 6 beds |
$2,024,900
|
show details |

|
#14
Sunrise Lakes Dr N Apt 312
Fort Lauderdale, FL 33322
|
850 sq. feet
|
2 baths 2 beds |
$160,000
|
show details |

|
#15
Ft Lauderdale Beach
Fort Lauderdale, FL 33304
|
1,308 sq. feet
|
2 baths 1 beds |
$339,900
|
show details |

|
#16
NE 22nd Way
Fort Lauderdale, FL 33308
|
1,030 sq. feet
|
2 baths 2 beds |
show details | |

|
#17
S Ocean Blvd Apt 16n
Pompano Beach, FL 33062
|
1,300 sq. feet
|
2 baths 2 beds |
show details | |

|
#18
SW 7th St
Pompano Beach, FL 33068
|
1,482 sq. feet
|
2 baths 4 beds |
show details | |

|
#19
N Santa Catalina Cir
Pompano Beach, FL 33068
|
1,224 sq. feet
|
2 baths 2 beds |
show details | |

|
#20
Saint Tropez Ln
Pompano Beach, FL 33068
|
1,356 sq. feet
|
2 baths 3 beds |
show details |
| Photo | Address | Area | Beds / Baths | Price | Details |
|---|---|---|---|---|---|

|
#21
S Cypress Bend Dr Apt 80
Pompano Beach, FL 33069
|
1,399 sq. feet
|
2 baths 2 beds |
show details | |

|
#22
SW 9th Mnr
Fort Lauderdale, FL 33325
|
1,654 sq. feet
|
2 baths 3 beds |
show details | |

|
#23
Barbarossa St
Boca Raton, FL 33433
|
1,514 sq. feet
|
2 baths 2 beds |
show details | |

|
#24
Stardust
Pompano Beach, FL 33068
|
1,500 sq. feet
|
2 baths 4 beds |
show details | |

|
#25
NW 44th Ct
Fort Lauderdale, FL 33319
|
3,100 sq. feet
|
2 baths 4 beds |
show details | |

|
#26
NW 36th St
Fort Lauderdale, FL 33309
|
1,517 sq. feet
|
2 baths 2 beds |
show details | |

|
#27
NW 24th St
Pompano Beach, FL 33065
|
3,168 sq. feet
|
2 baths 4 beds |
show details | |

|
#28
S Ocean Blvd Apt 206
Pompano Beach, FL 33062
|
780 sq. feet
|
2 baths 2 beds |
show details | |

|
#29
SW 28th Rd
Fort Lauderdale, FL 33312
|
2,010 sq. feet
|
1 baths 3 beds |
show details | |

|
#30
SW 64th Ave
Pompano Beach, FL 33068
|
1,942 sq. feet
|
2 baths 4 beds |
show details |
| Photo | Address | Area | Beds / Baths | Price | Details |
|---|---|---|---|---|---|

|
#31
NW 10th Ct
Fort Lauderdale, FL 33313
|
2,263 sq. feet
|
2 baths 4 beds |
show details | |

|
#32
NW 75th St
Fort Lauderdale, FL 33321
|
1,782 sq. feet
|
2 baths 2 beds |
show details | |

|
#33
NW 15th Pl
Pompano Beach, FL 33060
|
1,454 sq. feet
|
2 baths 3 beds |
show details | |

|
#34
Hibiscus Ave
Pompano Beach, FL 33062
|
1,135 sq. feet
|
2 baths 2 beds |
show details | |

|
#35
Hibiscus Ave Apt 305
Pompano Beach, FL 33062
|
1,129 sq. feet
|
2 baths 2 beds |
show details | |

|
#36
NW 24th St
Fort Lauderdale, FL 33311
|
- sq. feet
|
2 baths 3 beds |
show details | |

|
#37
NW 20th Pl
Fort Lauderdale, FL 33322
|
1,819 sq. feet
|
2 baths 3 beds |
show details | |

|
#38
NE 42nd Ct
Fort Lauderdale, FL 33308
|
8,512 sq. feet
|
7 baths 6 beds |
show details | |

|
#39
Woodmont Ave
Fort Lauderdale, FL 33321
|
1,319 sq. feet
|
2 baths 3 beds |
show details | |

|
#40
SW 11th Ave
Delray Beach, FL 33444
|
1,196 sq. feet
|
2 baths 3 beds |
show details |
| Photo | Address | Area | Beds / Baths | Price | Details |
|---|---|---|---|---|---|

|
#41
NW 84th Ter
Pompano Beach, FL 33067
|
6,925 sq. feet
|
4 baths 5 beds |
show details | |

|
#42
River Reach Dr Apt 102
Fort Lauderdale, FL 33315
|
1,250 sq. feet
|
2 baths 2 beds |
show details | |

|
#43
River Reach Dr Apt 102
Fort Lauderdale, FL 33315
|
1,236 sq. feet
|
2 baths 2 beds |
show details | |

|
#44
NW 19th Ave
Fort Lauderdale, FL 33311
|
1,690 sq. feet
|
2 baths 3 beds |
show details | |

|
#45
SW 1st Ter
Pompano Beach, FL 33060
|
1,014 sq. feet
|
1 baths 3 beds |
show details | |

|
#46
NW 61st Ave
Pompano Beach, FL 33067
|
3,345 sq. feet
|
2 baths 5 beds |
show details | |

|
#47
NW 29th St
Fort Lauderdale, FL 33311
|
3,733 sq. feet
|
2 baths 4 beds |
show details | |

|
#48
NW 14th St
Fort Lauderdale, FL 33313
|
1,000 sq. feet
|
2 baths 3 beds |
show details | |

|
#49
SW 118th Ter
Fort Lauderdale, FL 33325
|
1,969 sq. feet
|
2 baths 3 beds |
show details | |

|
Check over 1 million property listings on Foreclosure.com!
|
browse all offers | |||


 | Coconut Creek apartments advice (1 reply) |
| Rcm Apartments And Townhomes In Coral Springs (7 replies) |
| Miramar and Coconut Creek (3 replies) |
| Moving to Fort Lauderdale-apartments near Coconut Creek? (1 reply) |
| NEED HELP-Want to Buy Townhouse/Villa- in Coconut Creek/Boca (6 replies) |
| Buying a house with polybutylene pipes? (6 replies) |
Median year apartment built: 1993
Household type by relationship:
Households: 57,755- Male householders: 11,426 (3,138 living alone), Female householders: 12,343 (4,903 living alone)
9,711 spouses (9,522 opposite-sex spouses), 1,514 unmarried partners, (1,424 opposite-sex unmarried partners), 16,131 children (15,120 natural, 192 adopted, 818 stepchildren), 989 grandchildren, 1,154 brothers or sisters, 1,702 parents, 0 foster children, 973 other relatives, 1,547 non-relatives
- In group quarters: 259
Size of family households: 6,580 2-persons, 3,276 3-persons, 2,792 4-persons, 1,038 5-persons, 546 6-persons, 220 7-or-more-persons.
Size of nonfamily households: 7,961 1-person, 1,435 2-persons, 69 3-persons, 71 4-persons.
7,459 married couples with children.
2,806 single-parent households (641 men, 2,165 women).
57.7% of residents of Coconut Creek speak English at home.
23.9% of residents speak Spanish at home (67% speak English very well, 17% speak English well, 11% speak English not well, 5% don't speak English at all).
14.6% of residents speak other Indo-European language at home (60% speak English very well, 23% speak English well, 15% speak English not well, 2% don't speak English at all).
1.6% of residents speak Asian or Pacific Island language at home (52% speak English very well, 32% speak English well, 15% speak English not well, 1% don't speak English at all).
2.1% of residents speak other language at home (78% speak English very well, 17% speak English well, 5% speak English not well).
Foreign born population: 20,650 (35.8%)
(66.0% of them are naturalized citizens)
| Here: | 5.0 |
| State: | 5.9 |
| Here: | 4.0 |
| State: | 4.2 |
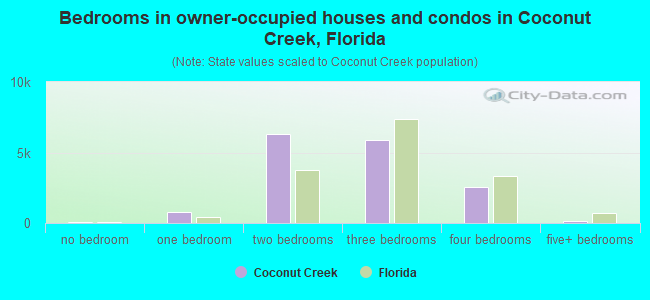
- Bedrooms in owner-occupied houses and condos in Coconut Creek, Florida
- 83no bedroom
- 7931 bedroom
- 6,3302 bedrooms
- 5,8613 bedrooms
- 2,5434 bedrooms
- 1745+ bedrooms
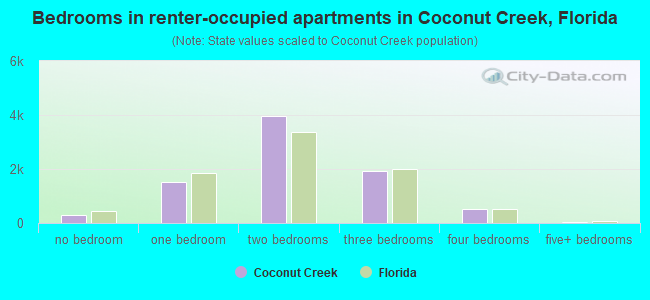
- Bedrooms in renter-occupied apartments in Coconut Creek, Florida
- 288no bedroom
- 1,5241 bedroom
- 3,9792 bedrooms
- 1,9343 bedrooms
- 5074 bedrooms
- 355+ bedrooms
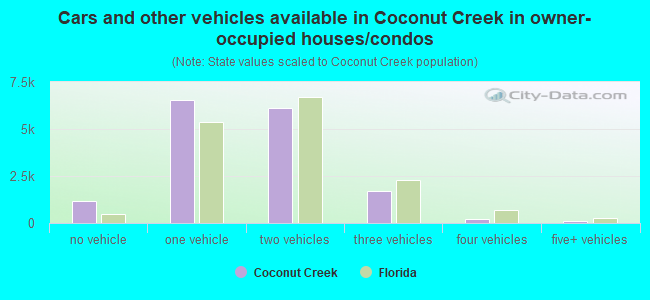
- Cars and other vehicles available in Coconut Creek in owner-occupied houses/condos
- 1,144no vehicle
- 6,5211 vehicle
- 6,0972 vehicles
- 1,6813 vehicles
- 2264 vehicles
- 1155+ vehicles
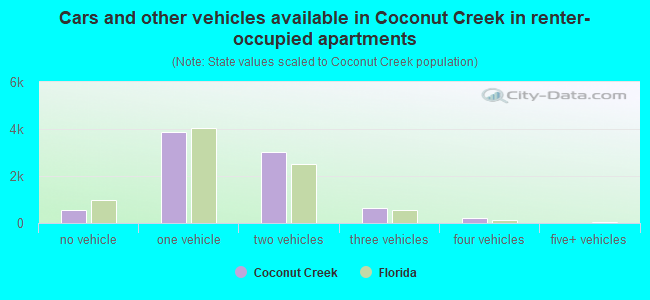
- Cars and other vehicles available in Coconut Creek in renter-occupied apartments
- 554no vehicle
- 3,8621 vehicle
- 3,0212 vehicles
- 6213 vehicles
- 2094 vehicles
- 05+ vehicles
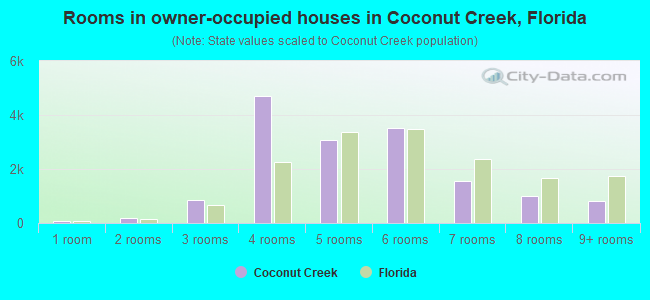
- Rooms in owner-occupied houses in Coconut Creek, Florida
- 621 room
- 1912 rooms
- 8413 rooms
- 4,7184 rooms
- 3,0885 rooms
- 3,5136 rooms
- 1,5617 rooms
- 9988 rooms
- 8139+ rooms
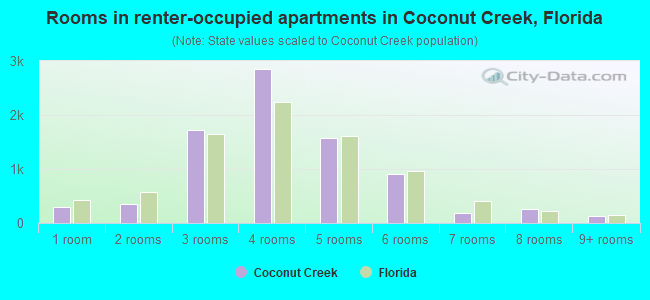
- Rooms in renter-occupied apartments in Coconut Creek, Florida
- 2881 room
- 3592 rooms
- 1,7163 rooms
- 2,8544 rooms
- 1,5805 rooms
- 9116 rooms
- 1857 rooms
- 2528 rooms
- 1219+ rooms
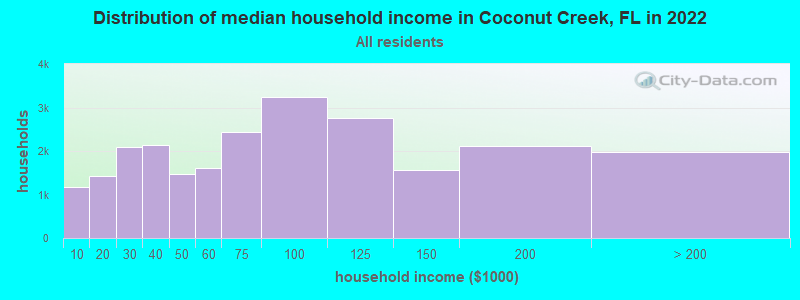
Coconut Creek, FL household income distribution

- 1,172Less than $10,000
- 1,429$10,000 to $19,999
- 2,092$20,000 to $29,999
- 2,145$30,000 to $39,999
- 1,478$40,000 to $49,999
- 1,612$50,000 to $59,999
- 2,444$60,000 to $74,999
- 3,236$75,000 to $99,999
- 2,752$100,000 to $124,999
- 1,562$125,000 to $149,999
- 2,123$150,000 to $199,999
- 1,980$200,000 or more
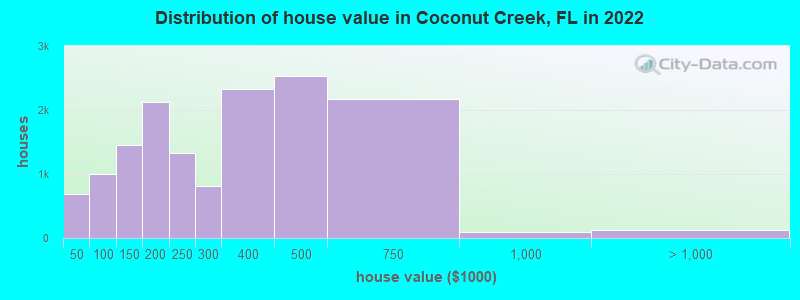
Home value of owner - occupied houses in 2022 in Coconut Creek, FL
-
- 197Less than $10,000
- 110$10,000 to $14,999
- 83$15,000 to $19,999
- 28$20,000 to $24,999
- 37$25,000 to $29,999
- 49$30,000 to $34,999
- 119$35,000 to $39,999
- 60$40,000 to $49,999
- 28$50,000 to $59,999
- 226$60,000 to $69,999
- 144$70,000 to $79,999
- 357$80,000 to $89,999
- 183$90,000 to $99,999
- 768$100,000 to $124,999
- 678$125,000 to $149,999
- 1,193$150,000 to $174,999
- 935$175,000 to $199,999
- 1,330$200,000 to $249,999
- 806$250,000 to $299,999
- 2,332$300,000 to $399,999
- 2,539$400,000 to $499,999
- 2,165$500,000 to $749,999
- 88$750,000 to $999,999
- 86$1,000,000 to $1,499,999
- 32$1,500,000 to $1,999,999
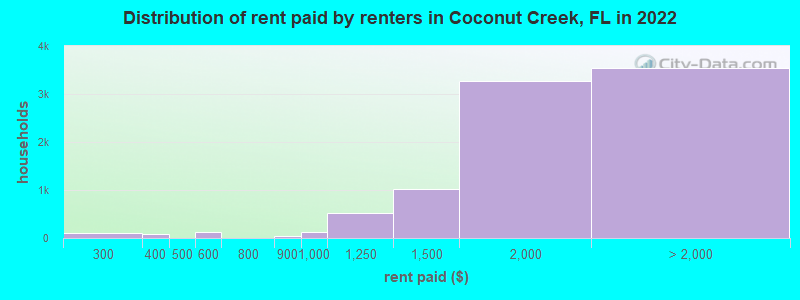
Rent paid by renters in 2022 in Coconut Creek, FL
-
- 102$200 to $249
- 77$350 to $399
- 107$500 to $549
- 22$550 to $599
- 33$800 to $899
- 116$900 to $999
- 525$1,000 to $1,249
- 1,011$1,250 to $1,499
- 3,275$1,500 to $1,999
- 1,556$2,000 to $2,499
- 1,166$2,500 to $2,999
- 273$3,000 to $3,499
- 242$3,500 or more
- 297No cash rent
Percentage of workers working in this county: 78.9%
Number of people working at home: 4,871 (16.2% of all workers)
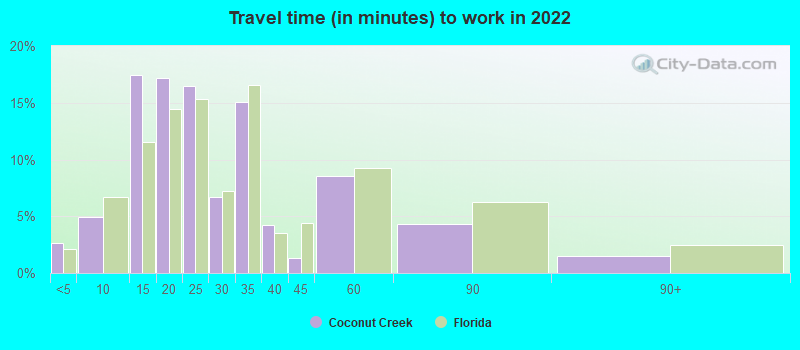
Travel time to work (commute)
- Less than 5 minutes: 517
- 5 to 9 minutes: 1,160
- 10 to 14 minutes: 2,380
- 15 to 19 minutes: 2,904
- 20 to 24 minutes: 4,067
- 25 to 29 minutes: 2,155
- 30 to 34 minutes: 5,189
- 35 to 39 minutes: 1,120
- 40 to 44 minutes: 1,422
- 45 to 59 minutes: 1,879
- 60 to 89 minutes: 1,486
- 90 or more minutes: 1,058
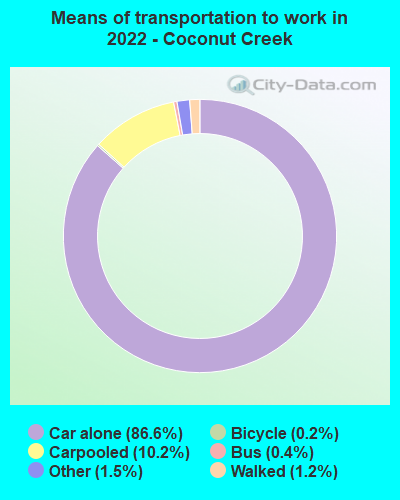
Means of transportation to work:
- Drove a car alone: 12,532 (65.5%)
- Carpooled: 1,682 (8.8%)
- Bus: 56 (0.3%)
- Taxi: 230 (1.2%)
- Bicycle: 26 (0.1%)
- Walked: 200 (1.0%)
- Worked at home: 4,871 (25.5%)
- Unemployment by race in 2022
- Unemployment rate for White non-Hispanic residents
- 2.5%Males
- 3.8%Females
- Unemployment rate for Black residents
- 15.6%Males
- 1.4%Females
- Unemployment rate for American Indian and Alaska Native residents
- 28.8%Females
- Unemployment rate for Asian residents
- 10.3%Males
- 2.7%Females
- Unemployment rate for other race residents
- 1.2%Females
- Unemployment rate for two or more race residents
- 4.7%Males
- 2.3%Females
- Unemployment rate for Hispanic or Latino residents
- 4.3%Males
- 1.3%Females
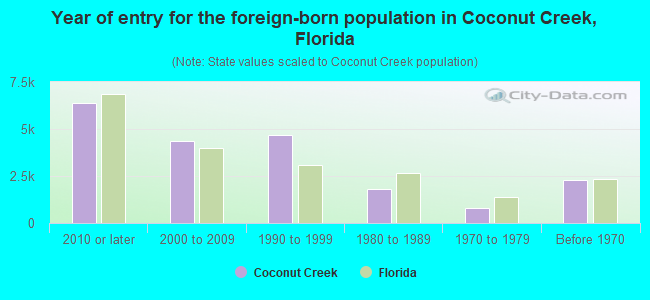
- Year of entry for the foreign-born population in Coconut Creek, Florida
- 6,3742010 or later
- 4,3662000 to 2009
- 4,6851990 to 1999
- 1,7851980 to 1989
- 8031970 to 1979
- 2,297Before 1970
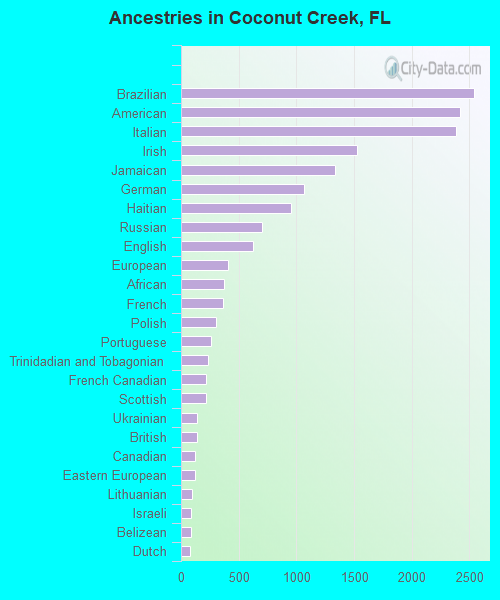
First ancestries reported:
- Brazilian: 2,542 (8.0%)
- American: 2,421 (7.6%)
- Italian: 2,380 (7.5%)
- Irish: 1,526 (4.8%)
- Jamaican: 1,335 (4.2%)
- German: 1,065 (3.3%)
- Haitian: 951 (3.0%)
- Russian: 705 (2.2%)
- English: 623 (2.0%)
- European: 404 (1.3%)
- African: 374 (1.2%)
- French: 363 (1.1%)
- Polish: 305 (1.0%)
- Portuguese: 256 (0.8%)
- Trinidadian and Tobagonian: 236 (0.7%)
- French Canadian: 218 (0.7%)
- Scottish: 215 (0.7%)
- Ukrainian: 142 (0.4%)
- British: 138 (0.4%)
- Canadian: 119 (0.4%)
- Eastern European: 118 (0.4%)
- Lithuanian: 97 (0.3%)
- Israeli: 90 (0.3%)
- Belizean: 87 (0.3%)
- Dutch: 80 (0.3%)
- Guyanese: 70 (0.2%)
- Palestinian: 69 (0.2%)
- Hungarian: 66 (0.2%)
- Moroccan: 61 (0.2%)
- West Indian: 57 (0.2%)
- Swedish: 54 (0.2%)
- Greek: 52 (0.2%)
- Syrian: 49 (0.2%)
- Northern European: 49 (0.2%)
- Belgian: 35 (0.1%)
- Norwegian: 35 (0.1%)
- Armenian: 35 (0.1%)
- Barbadian: 30 (0.09%)
- Slavic: 29 (0.09%)
- Turkish: 26 (0.08%)
- Scotch-Irish: 24 (0.08%)
- Czech: 23 (0.07%)
- U.S. Virgin Islander: 22 (0.07%)
- Austrian: 15 (0.05%)
- Scandinavian: 14 (0.04%)
- Nigerian: 12 (0.04%)
- South African: 12 (0.04%)
- Danish: 10 (0.03%)
- Arab: 9 (0.03%)
- Bulgarian: 9 (0.03%)
- Lebanese: 9 (0.03%)
- Romanian: 8 (0.03%)
- Welsh: 7 (0.02%)
- British West Indian: 5 (0.02%)
- Bahamian: 4 (0.01%)
Most common places of birth for foreign-born residents (%):
| Coconut Creek: | 18.4% (3,790) |
| Florida: | 2.7% (122,906) |
| Coconut Creek: | 11.2% (2,322) |
| Florida: | 6.5% (298,669) |
| Coconut Creek: | 9.6% (1,992) |
| Florida: | 2.1% (96,693) |
| Coconut Creek: | 9.2% (1,907) |
| Florida: | 5.0% (227,319) |
| Coconut Creek: | 5.2% (1,064) |
| Florida: | 1.2% (54,585) |
| Coconut Creek: | 5.0% (1,037) |
| Florida: | 7.5% (342,375) |
| Coconut Creek: | 3.9% (806) |
| Florida: | 3.0% (137,727) |
| Coconut Creek: | 3.9% (796) |
| Florida: | 22.0% (1,006,576) |
| Coconut Creek: | 3.4% (699) |
| Florida: | 5.7% (262,042) |
| Coconut Creek: | 2.6% (541) |
| Florida: | 0.1% (4,021) |
| Coconut Creek: | 2.3% (475) |
| Florida: | 2.1% (94,349) |
| Coconut Creek: | 2.1% (435) |
| Florida: | 1.0% (43,642) |
| Coconut Creek: | 1.8% (362) |
| Florida: | 2.4% (109,132) |
| Coconut Creek: | 1.6% (340) |
| Florida: | 1.3% (57,263) |
Place of birth for U.S.-born residents:
- This state: 17,414
- Other state: 17,913
- Northeast: 11,368
- Midwest: 3,021
- South: 2,919
- West: 656
87.2% of Coconut Creek residents lived in the same house 1 years ago.
Out of people who lived in different houses, 38.1% lived in this county.
Out of people who lived in different counties, 54.6% lived in Florida.
| Coconut Creek: | 87.2% |
| State average: | 86.3% |
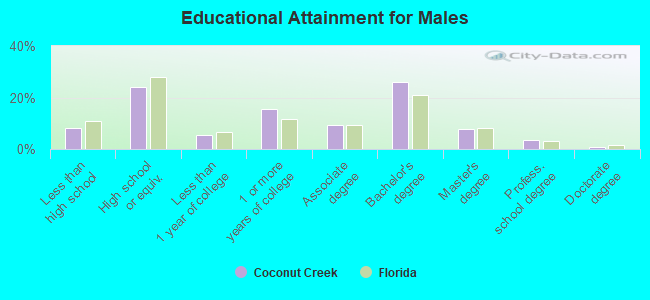
Education attainment for males 25 years and older:
- No schooling: 468
- Nursery to 4th grade: 0
- 5th and 6th grade: 44
- 7th and 8th grade: 96
- 9th grade: 64
- 10th grade: 183
- 11th grade: 197
- 12th grade, no diploma: 483
- High school graduate (or equivalency): 4,638
- Less than 1 year of college: 1,073
- Some college more than 1 year, no degree: 2,951
- Associate degree: 1,794
- Bachelor's degree: 4,971
- Master's degree: 1,485
- Professional school degree: 643
- Doctorate degree: 133
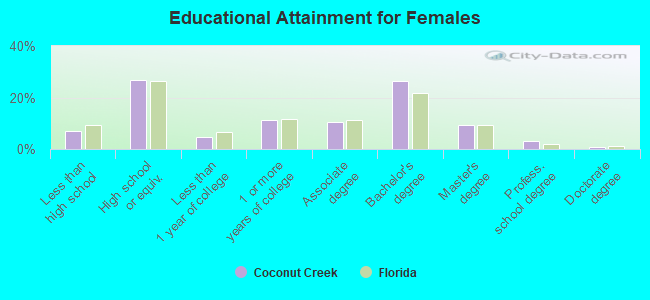
Education attainment for females 25 years and older:
- No schooling: 429
- Nursery to 4th grade: 85
- 5th and 6th grade: 247
- 7th and 8th grade: 107
- 9th grade: 44
- 10th grade: 65
- 11th grade: 216
- 12th grade, no diploma: 440
- High school graduate (or equivalency): 6,095
- Less than 1 year of college: 1,089
- Some college more than 1 year, no degree: 2,543
- Associate degree: 2,431
- Bachelor's degree: 6,036
- Master's degree: 2,143
- Professional school degree: 711
- Doctorate degree: 163
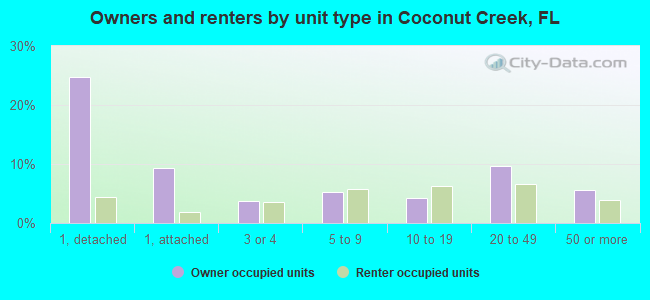
Housing units in structures:
- One, detached: 7,444
- One, attached: 2,424
- Two: 295
- 3 or 4: 1,703
- 5 to 9: 2,906
- 10 to 19: 2,941
- 20 to 49: 5,260
- 50 or more: 2,739
- Mobile homes: 1,470
Median worth of mobile homes: $67,674
Housing units lacking complete kitchen facilities in 2022: 0.9%
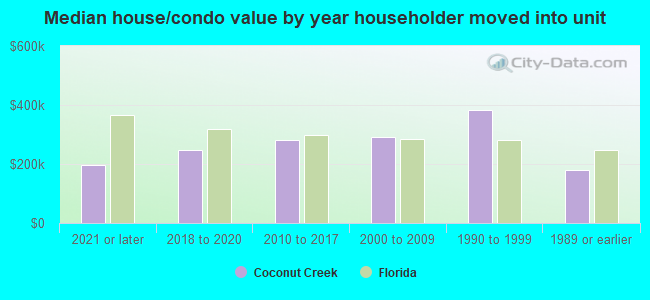
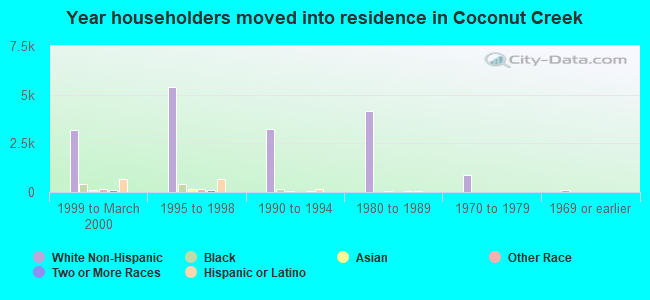
House/condo owner moved in on average 9 years ago
Renter moved in on average 4 years ago
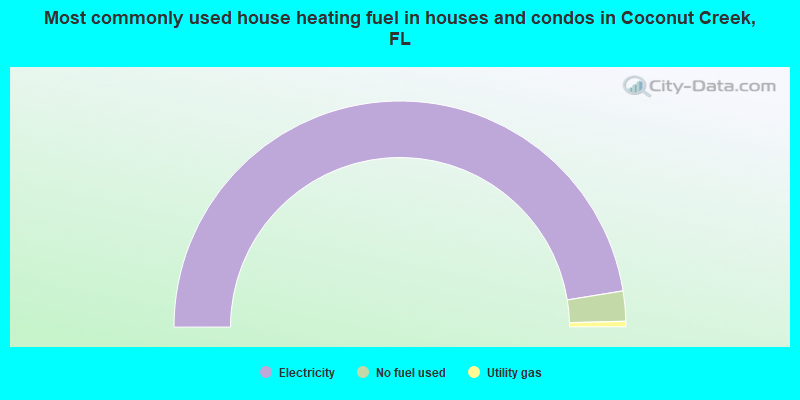
- 94.8%Electricity
- 4.3%No fuel used
- 0.8%Utility gas
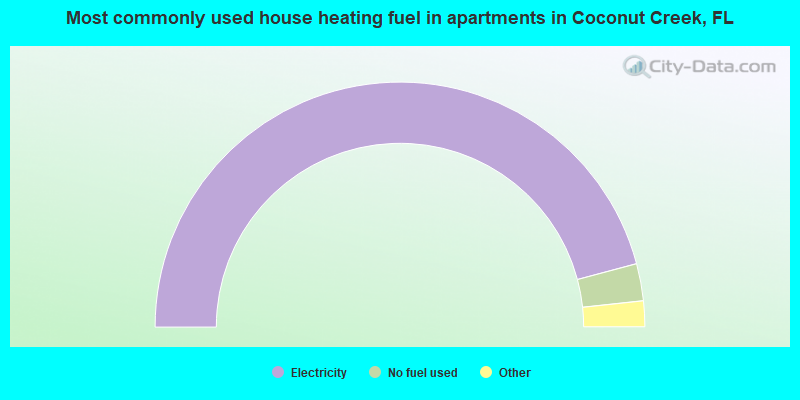
- 91.7%Electricity
- 4.9%No fuel used
- 2.0%Utility gas
- 1.1%Bottled, tank, or LP gas
- 0.3%Fuel oil, kerosene, etc.
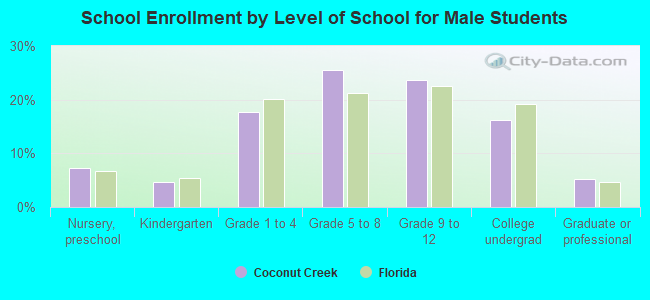
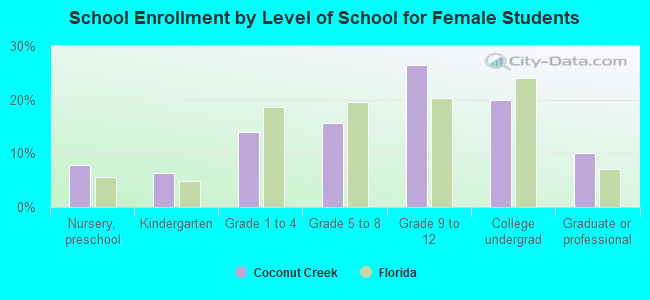
Private vs. public school enrollment:
| Here: | 23.2% |
| Florida: | 15.8% |
| Here: | 16.4% |
| Florida: | 12.9% |
| Here: | 20.3% |
| Florida: | 23.6% |